

Given the slow progress of the World Trade Organization [WTO] Doha Round negotiations, the attractiveness of entering into Regional Trade Agreements [RTAs] has deepened during the last two decades.Footnote 1 WTO members are permitted to enter into RTAs under specific conditions within three sets of rules, Article XXIV of the General Agreement on Tariffs and Trade [GATT],Footnote 2 the Enabling Clause,Footnote 3 and Article V of the General Agreement on Trade in Services [GATS].Footnote 4 RTAs formulate rules aiming at trade liberalization, which cover the formation and operations of custom unions and free trade agreements [FTAs].Footnote 5 One of the favourable impacts of RTAs on the WTO is the possibility of facilitating WTO negotiations, given that RTAs generally reach a higher level of tariff elimination.Footnote 6 In addition, RTAs can also broaden its coverage in rule-making by accepting new members.Footnote 7 In contrast, the proliferation of RTAs also generates integration concerns in the light of the fact that some RTAs are “light and superficial”.Footnote 8
Several Asian countries, particularly in Southeast and East Asia, have aggressively entered into multiple trade blocs, namely the Association of Southeast Asian Nations [ASEAN] FTA (1992), the Sino-ASEAN FTA (2005), the South Korea-ASEAN FTA (2007), the Japan-ASEAN FTA (2008), the Australia-New Zealand-ASEAN FTA (2010), the ASEAN-India FTA (2010), and so on. The tariff and rules of origin [ROOs] reforms as well as the trade facilitation measures implemented through these preferential trade agreements have significantly contributed in deepening the global value chains [GVCs] and international production networks [IPNs] in the region.Footnote 9 The recent initiative to enhance the trade relations of the region with North America has, however, been stalled after the pull-out of the US from the Trans-Pacific Partnership [TPP].Footnote 10 It has been conjectured that the US pull-out from the TPP may accelerate the ongoing negotiations on another mega-regional bloc, namely he Regional Comprehensive Economic Partnership [RCEP] involving ASEAN and its six FTA partners.Footnote 11 It is expected that the RCEP, a bloc connecting economies from a wider development spectrum and spread across a significant part of the continent, would be instrumental in augmenting cross-border trade and investment flows by addressing concerns about a “noodle bowl” of overlapping bilateral agreements.Footnote 12 As the bloc by scope and coverage targets “WTO-consistent” provisions only, it scores over other similar mega-regional provisions (e.g. the TPP).Footnote 13 However, the development divergence among the RCEP countries and ASEAN's existing FTAs with six partners is possibly posing a significant hurdle in further liberalizing trade.Footnote 14 For instance, securing the “appropriate forms of flexibility including provision for special and differential treatment” poses a major challenge for the negotiation process.Footnote 15 As a result, arriving at “common consensus” has been a problem, as the products under tariff elimination commitment in ASEAN's FTA partners are “only 73.3% on average”, compounding the process of negotiations.Footnote 16
The RCEP was launched in November 2012 and the negotiations began in May 2013. The objective of launching the RCEP negotiations was “to achieve a modern, comprehensive, high-quality and mutually beneficial economic partnership agreement among the ASEAN Member States and ASEAN's FTA Partners”, that would “cover trade in goods, trade in services, investment, economic and technical cooperation, intellectual property, competition, dispute settlement and other issues”.Footnote 17
The first round of negotiations was held in May 2013, and by July 2018 twenty-two rounds as well as several RCEP Ministerial Meetings had taken place.Footnote 18 The third RCEP Ministerial Meeting acknowledged the attempts by countries to progress with “offers and requests in goods to achieve the maximum ambition possible, while balancing sensitivities through suitable mechanisms like staging periods and line exceptions”.Footnote 19 With a growing focus to conclude the final agreement, negotiations have become increasingly more complex, with around 700 officials gathering for negotiations in 2017, compared to sixty delegates at the meetings in 2013.Footnote 20
The Joint Leaders’ Statement after the first RCEP Summit on 14 November 2017 reiterated the commitment of the bloc to facilitate trade liberalization through market access, rules, and co-operation. The gaining momentum in negotiations on eighteen core areas (Trade in Goods, ROOs, Trade in Services, Financial Services, Telecommunication Services, Remedies, Investment, Competition, Government Procurement, Intellectual Property, E-Commerce, Dispute Settlement, etc.) was noted and the group's objective to conclude negotiations at the earliest was underlined.Footnote 21
Minute details of the negotiations remain largely confidential,Footnote 22 although official reports provide updates on progress made—e.g. two chapters (on Small and Medium-sized Enterprises, and Economic and Technical Cooperation [ECOTECH]) had been concluded by the end of 2016.Footnote 23 The recent status of RCEP negotiations can be assessed from the Joint Leaders’ Statement released after the second RCEP Summit on 14 November 2018. The RCEP Participating Countries [RPCs] noted the conclusion of negotiations on provisions for five key provisions, namely: Customs Procedures and Trade Facilitation [CPTF]; Government Procurement; Institutional Provisions; Sanitary and Phytosanitary [SPS] Measures; and Standards, Technical Regulations, and Conformity Assessment Procedures [STRACAP]. The statement expressed satisfaction over considerable progress in negotiations on goods and services market access and on investment reservation lists through a series of negotiations during 2018.Footnote 24
It is clear from past trends that RCEP negotiations aim to minimize possible grievances among Member Countries once the trade reforms are initiated. For instance, the negotiations for the creation of cohesiveness among members, i.e. small enterprises, technical co-operation, trade facilitation, SPS measures, and conformity assessment procedures, have been concluded before finalizing the trade in goods provisions, given the dominance of small and medium-sized enterprises [SMEs] in constituent developing economies, which are characterized by diverging levels of internationalization.Footnote 25
The RECP thus displays clear emphasis on economic co-operation to deal with the problems of the developing Member States and, once completed, it will offer a powerful boost to the rules-based global trading system.Footnote 26 It encompasses the first ever agreements that cover China, India, Japan, and South Korea. As the most ambitious agreement ever negotiated by the developing countries, it changes the landscape and offers new evidence of Asian leadership in world trade.Footnote 27 One of the crucial advantages of the proposed RCEP bloc is the existing bilateral agreements among partners, gradually deepening trade links, and the associated familiarity effects. Despite these drivers, the slow progress of RCEP negotiations,Footnote 28 which includes an ambitious agendaFootnote 29 covering trade in merchandise products, services, investment, and WTO-Plus areas like competition policy,Footnote 30 can be partly explained by the delays in finalizing tariff preferences in currently non-existing arrangements in the mega-RTA. Pressure is mounting on countries like India, whose average tariff is higher than the corresponding figure for ASEAN.Footnote 31 Also, the process of establishing the missing linkages in the trade agreement architecture has been slow. For instance, China and India are not linked through a preferential agreement at present, and arriving at a mutually beneficial tariff reform arrangement at the RCEP involving these two countries has so far proved to be difficult.Footnote 32 This is despite the potential optimality of dealing with China through an RTA rather than a bilateral agreement.Footnote 33 A practical challenge for the RCEP had been to streamline trade reforms among RCEP partners without a prior relationship, and rounds of negotiations have eased the concerns. It has now been agreed at the third RCEP Ministerial meeting on 24 August 2015 that “India would do a 42.5% threshold with China reciprocating with a 42.5% threshold, New Zealand doing a 62.5% threshold and Australia doing an 80% threshold over a 10 year period”.Footnote 34
The RECP’s economic effects are expected to be substantial, although much depends on the template that emerges as only eighty percent of tariff lines are with long phase-out periods, while for the Comprehensive and Progressive Agreement for Trans-Pacific Partnership [CPTPP], some countries may reduce one hundred percent.Footnote 35 Further, the US-China trade war complicates RCEP negotiations. On the bright side, it may accelerate the process of completing the RCEP, especially with the US introducing a “poison pill” clause in the United States-Mexico-Canada Agreement [USMCA]. Under this clause, it effectively nullifies the ability of any three members to conclude a deal with a country that “at least one Party has determined to be a non-market economy for purposes of its trade remedy laws”, such as China.Footnote 36 Some commentators also worried that the trade war will shift Chinese exports to their markets; in the meantime, India and Vietnam may enjoy greater access to the US market.Footnote 37
The current analysis intends to look into the major trends involving India's trade pattern with ASEAN countries and other RCEP members, and to understand whether the performance of the country under the ASEAN-India FTA [AIFTA] in any way influences its participation in the RCEP negotiations. The paper is arranged along the following lines. First, the background of the AIFTA negotiations is briefly mentioned. The legal architecture of the AIFTA is analyzed next in the light of the other bilateral agreements of ASEAN. The modest outcome of the AIFTA so far is analyzed next with help of select trade indicators. Finally, based on the findings, the policy conclusions are drawn.
I. INDO-ASEAN: GREAT EXPECTATIONS
After the inception of the WTO in 1995, India initially focused on the multilateral route for export promotion. However, the euphoria over achievements at the Doha Ministerial (2001) of the WTO gradually subsided after the modest achievements from the Cancun Ministerial (2003) onwards. Since 2004, India increasingly started to explore the RTA route for export promotion.Footnote 38
A. Genesis of the Indo-ASEAN FTA
Given the slow progress of negotiations on the South Asia Free Trade Area [SAFTA] and the development profile of ASEAN members, India subsequently entered into an Early Harvest Programme [EHP] under the Indo-Thai FTA (2004) and Indo-Singapore Comprehensive Economic Cooperation Agreement [CECA] (2005). These initiatives fitted in with the broad Indian policy frameworks, namely the “Look East Policy” (1991) and the “National Common Minimum Programme” (2004).Footnote 39 To deepen India's trade with Southeast Asia further, the Framework Agreement of the AIFTA was signed in 2004. However, the conclusion of the FTA was delayed due to differences over several issues, covering the sequencing of tariff reforms, negative list and sensitive items (particularly in agriculture), determining ROOs, reducing the import duty on refined palm oil and other agricultural products, and so on.Footnote 40 The agreement to liberalize trade in merchandise finally came into force in 2010. The primary motivation for India to embrace a trade relationship with ASEAN was a positive expectation towards a rise in bilateral trade volumes in the post-bloc period.Footnote 41 The rise in merchandise trade was expected to follow from both tariff and non-tariff barrier [NTBs] reforms.Footnote 42 Moreover, enhanced investment flows to an India rich in skilled labour from technologically advanced ASEAN members (e.g. Singapore, Thailand) and other regional partners, with the potential for technology transfer, were among the expected benefits.Footnote 43
Apart from the potential rise in merchandise trade, a considerable increase in services exports from India was also predicted.Footnote 44 It is observed that while several Southeast Asian countries are more competitive vis-à-vis India for merchandise products, in professional services categories the competitiveness pattern is reversed.Footnote 45 In other words, Indian policy-makers became aware of the possibility that potential losses in the ASEAN market on the merchandise front might be compensated for by the gains in the service sectors. The negotiations to remove barriers to trade in services in Indo-ASEAN trade followed after inception of the FTA in merchandise products. However, the negotiation on revised offers and sectoral exceptions (i.e. market access and national treatment limitations) from ASEAN members proved to be a lengthy process.Footnote 46 The delays to the conclusion of the negotiations for the Indo-ASEAN CECA therefore caused India to seek access to key ASEAN markets bilaterally through the Indo-Malaysia CECA (2011), and to initiate discussions for the Indo-Indonesia CECA in 2011.Footnote 47 In 2014, an agreement on trade in services was reached, in which both sides decided to open up sectors such as “telecommunication and financial and insurance services, while regulating the movement of natural persons”.Footnote 48
B. India's “Act East Policy”
India launched the “Act East Policy” in 2014, with an explicit focus on expanding economic co-operation with the Asia-Pacific.Footnote 49 With the conclusion of the India-South Korea Comprehensive Economic Partnership Agreement [CEPA] and AIFTA in 2010, and the India-Japan CEPA in 2011, India's trade with both Southeast and East Asia started increasing.Footnote 50 The linkage of the Indian manufacturing sector with firms located in these two subregions increased as a result of the tariff reforms.Footnote 51 In this context, participation in the RCEP has been considered an ideal move to enhance India's trade with Asia-Pacific in general, and to deepen its integration in Asian IPNs and GVCs in particular.Footnote 52 However, India's average trade deficit with ASEAN has worsened from US$0.85bn in 2001–05 to US$6.11bn in 2006–10, and further to US$9.63bn in 2011–16.Footnote 53 Given the central role of ASEAN in the RCEP arrangement, the intensity of India's negotiations at the RCEP forum can be considered an indirect function of realized modest success of the AIFTA, driven further by apprehension on expected benefits.
A couple of factors significantly influenced the bilateral trade and investment flows between India and ASEAN. First, the Indo-ASEAN agreement became operational from 2010,Footnote 54 considerably later than ASEAN's engagements with China (2005),Footnote 55 South Korea (2007),Footnote 56 and Japan (2008).Footnote 57 With the consequent tariff reforms, these partners had a lead time over India to consolidate their positions in the ASEAN market. Moreover, the investment integration of ASEAN with Japan and South Korea flourished from the late 1970s following the “Flying Geese” model, which paved the way for technology transfer, the fragmentation of production blocs, and intense bilateral flows.Footnote 58 The South Korea-ASEAN and Japan-ASEAN FTAs, through explicit trade facilitations provisions, significantly enhanced bilateral trade volumes, which often were intra-industry trade [IIT] in nature.Footnote 59 On a similar note, China pushed for market economy status in ASEAN in the post-FTA period, which significantly improved its export penetration.Footnote 60
On the other hand, India, a latecomer to the ASEAN market as an FTA partner, had to withstand intense competition from the existing partners and the associated tariff preferences.Footnote 61 For instance, Vietnam imposed a duty of five percent and zero percent on the import of Linear Alkyl Benzene Sulphonic Acid from India and South Korea, respectively, and similar examples abound.Footnote 62 Second, slow reforms of the NTBs in the ASEAN market, particularly the Sanitary and Phytosanitary Measures [SPS] and Technical Barriers to Trade [TBT] related ones, reduced opportunities for Indian exports.Footnote 63 Even with the comprehensive partners, the lack of mutual recognition of standards is a major challenge for Indian exports.Footnote 64 Conversely, ASEAN partners often raised voices against existing tariffs as well as the NTBs in the Indian market.Footnote 65 Third, a wide range of trade-restrictive measures including NTBs still persist in the ASEAN market on service imports,Footnote 66 much to the chagrin of IndiaFootnote 67. Fourth, despite launching the Indo-ASEAN CECA and the introduction of initiatives such as “Make-in-India” at home, the Foreign Direct Investment [FDI] policy reform in India was more influenced by the political economic undercurrents. For instance, a major set of FDI reforms was implemented by the ruling party after its defeat in a state election.Footnote 68 Fifth, the modest performance of the country in terms of Ease of Doing Business (ranked 130th and 131st during 2017 and 2016, respectively)Footnote 69 further contributed to lower FDI inflows. The country considerably improved its ranking to 100th position in the subsequent year, which is expected to increase FDI inflows.Footnote 70 Finally, India has been ranked 44th in the Logistics Performance Index 2018, with only Singapore (ranked 7th) and Malaysia (ranked 41nd) among ASEAN members positioned above it.Footnote 71 The cumulative effects of this mismatch in the level of trade facilitation, existing tariff barriers, and NTBs, and other concerns, could not enhance India's manufacturing sector competitiveness vis-à-vis ASEAN to the desired extent on the one hand and limited bilateral trade flows on the other. This observation underlines the need for further improvements in trade facilitation measures and the mutual recognition of product standards. In all, while the AIFTA formalized the trade relationship, unfinished reforms at both ends possibly undermined the realization of trade potentials.
II. THE INDO-ASEAN FTA IN THE CONTEXT OF OTHER ASEAN FTAs
The slow progress of the RCEP negotiations can further be explained through the possible divergences in the operational aspects, e.g. (1) the comprehensiveness of tariff elimination, (2) the differing rules of origin, and (3) differences in legal architecture among the ASEAN+5 (i.e. ASEAN plus five other jurisdictions, namely, Japan, China, South Korea, Hong Kong, and Taiwan) countries. First, through a stocktaking of the provisions in existing ASEAN trade agreements, Shujiro Urata noted that the actual trade liberalization rate (defined as the proportion of tariff lines subject to tariff elimination) under the AIFTA had remained at a moderate level vis-à-vis other agreements. For instance, the ASEAN-Australia/New Zealand FTA has the highest trade liberalization rate at 95.7 percent, with tariff elimination on almost all imports from ASEAN countries completed. While a similar level of trade liberalization is visible in ASEAN's FTAs with China (94.7 percent), Korea (94.5 percent), and Japan (92.8 percent), the corresponding figure for the AIFTA stand at the lowest level of 79.6 percent.Footnote 72 In other words, the proportion of tariff lines under “negative list” and “safeguard list” is much wider in the AIFTA, with consequent trade repercussions.
The low trade liberalization rates in the AIFTA can be attributed to three factors. First, in many product segments sharp competition prevails between India and the ASEAN countries for capturing the global market, e.g. apparel products, iron and steel products, auto components, etc.Footnote 73 On the other hand, Indian export patterns are not evolving in line with the import pattern of several ASEAN countries, as reflected in a moderate trade complementarity scenario.Footnote 74 In other words, a trade friction as well as a trade focus mismatch are quite apparent. Second, because the level of trade liberalization is negotiated bilaterally in ASEAN + 1 FTAs, reciprocity is of crucial importance. India's level of trade liberalization is significantly lower than that of ASEAN's other FTA partners, and the ASEAN countries’ commitments tend to be lower in their agreements with India. For instance, the overall trade liberalization rate for Singapore stands at 100 percent for all five ASEAN + 1 FTAs, indicating complete tariff elimination. The corresponding figures for other ASEAN countries are: Brunei Darussalam (95.9 percent), the Philippines (93.1 percent), Thailand (92.6 percent), Malaysia (92.0 percent), Cambodia (90.0 percent), Viet Nam (89.5 percent), Lao PDR (89.3 percent), Myanmar (87.3 percent), and Indonesia (83.4 percent). Conversely, trade liberalization figures for Indonesia in the AIFTA register a rate of 48.7 percent.Footnote 75 Hence, for arriving at an RCEP, the need for incremental reform under the AIFTA is far more complex as compared to the other five ASEAN + 1 FTAs.
Second, the FTAs might have various types of ROOs, namely: wholly obtained or produced in a country [WO], regional value content [RVC], change in tariff heading [CTH], and specific process rule [SPR]. If a country is wary of a surge in imports in the post-bloc period, they can opt for twin criteria, involving: (1) value addition and (2) substantial transformation. On the former, both sides may agree on a minimum value addition level (e.g. thirty, thirty-five, or forty percent) in the partner country, so that the export can be eligible for a preferential tariff at the point of import. RVC enables the exporting country to procure the necessary parts and components from partner countries within the bloc (e.g. for Thailand to import from another ASEAN member such as Singapore and then export to India after necessary value addition). If the value addition requirement under the RVC is lower (e.g. thirty percent), it implies that the partners are agreeing to allow the import of more raw materials (either more cost efficient or characterized by better quality) to enter from countries outside the bloc. On the latter front, if the countries agree to a change in chapter ([CC], i.e. at Harmonized System 2-digit level), it means that there has to be substantial transformation of the import from outside the bloc. For instance, under this provision India can import cotton products (say, HS 520100) from Mexico (a non-member country) and export garment products (HS 610910) to Thailand (an FTA partner). The substantial transformation requirement is quite stringent in this context. Conversely, for a change in tariff heading ([CTH], i.e. at Harmonized System 4-digit level) and a change in tariff sub-heading ([CTSH], i.e. at Harmonized System 6-digit level), the stringency gradually comes down.
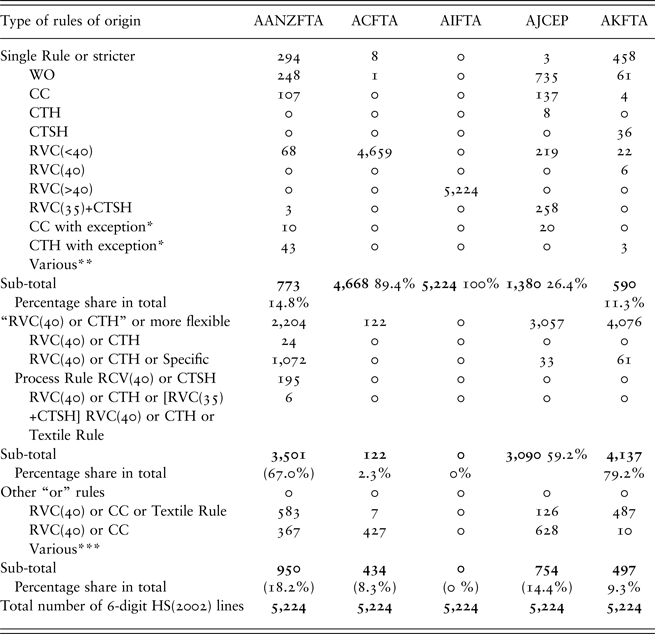
The complexity of the ROOs in the five existing ASEAN + 1 FTAs can be compared in Table 1. First, it can be seen that, while there are no products with CC requirements in AIFTA, the application of twin criteria—an RVC of thirty-five percent (of the f.o.b. value) plus CTSH, is quite common for India. It can be noted that India follows the thirty-five percent RVC (of the f.o.b. value) and CTSH with South Korea and Japan, while forty percent RVC and CTSH is followed for Singapore and Thailand.Footnote 76 Second, the application of a single ROO criterion has not been considered in the Indian context. Barring the other exception of the ASEAN-People's Republic of China [PRC] FTA, ASEAN follows a co-equal rule: a minimum of forty percent RVC or a CTH criterion. The co-equal rule is less restrictive than a single rule, because it gives traders a choice in the application of ROOs, and they can select the less restrictive rule as applied to their specific goods. For the ASEAN-PRC FTA, the general rule is that a forty percent RVC or product-specific ROOs are applied.Footnote 77 Comparing the AIFTA with the other five ASEAN-centric FTAs, it can be noted that the RVC requirement at thirty-five percent for India is less restrictive when compared to the corresponding figure of forty percent in the other FTAs, but the CTSH requirement (i.e. at HS 6-digit level) might add to the operational complexity of the arrangement. Harmonization of the ROOs among the RCEP for RCEP partners would therefore be a complex process.
Frequency by type of rules of origin used in ASEAN + 1 Free Trade Agreements.

Source: Urata (2013; see ftn 72), Table 6, based on research by E.M. Medalla
Notes: AANZFTA = ASEAN-Australia/New Zealand FTA; ACFTA = ASEAN-People's Republic of China FTA; AIFTA = ASEAN-India FTA; AJCEP = ASEAN-Japan Comprehensive Economic Partnership; AKFTA = ASEAN-Korea FTA. CC = product-specific rules about change of commodity classification. CTH = change in tariff heading at the HS 4-digit level. CTSH = change in tariff heading at the HS 6-digit level, making it less restrictive than CTH. * Exception varies, from sourcing of materials to process; ** e.g. CTH + RVC(40), CC + RVC(40), CC + Textile Rule; *** e.g. [RVC(40)+Textile Rule] or CC, RVC(>40), or CTH.
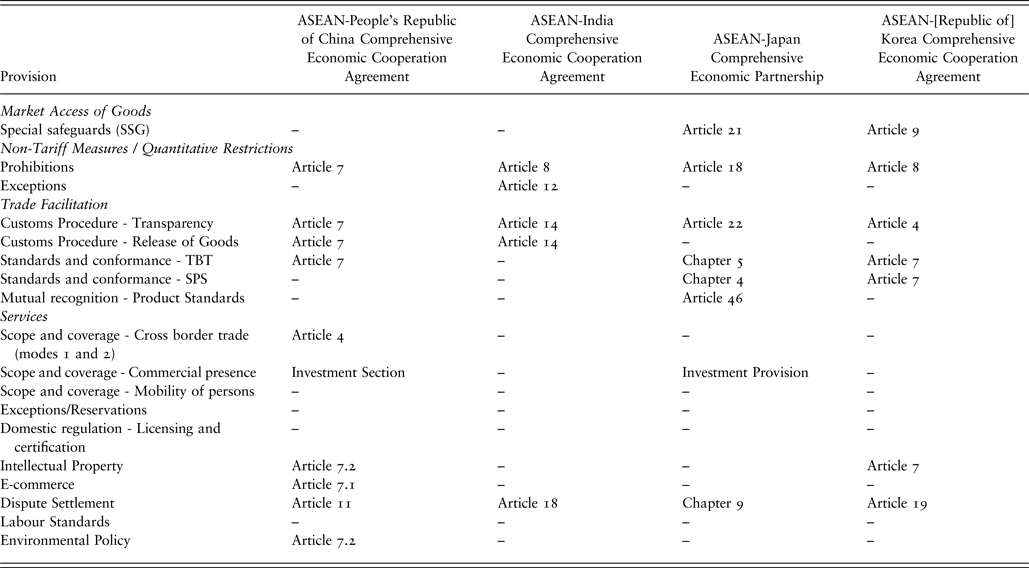
Last, the legal provisions under ASEAN's FTAs with China, India, Japan, and South Korea are compared with help of Table 2, by obtaining information from the ADB ARIC database.Footnote 78 For market access of goods, special safeguard measures are regulated under Article 21 of the ASEAN-Japan FTAFootnote 79 and Article 9 of the ASEAN-Korea FTA, respectively.Footnote 80 In contrast, this type of provision is absent under the AIFTA and ASEAN-China FTA. Safeguard remedies are imposed based on the concept of fair-trade practice in the form of import restrictions. In general, safeguard measures aim at ensuring that a domestic economy “does not suffer serious harm from imports and trade concessions”. Footnote 81
Comparing ASEAN's Free Trade Agreements by provisions.

Source: Compiled from ADB ARIC database (as of 29 September 2018),
Under the non-tariff measures, only the AIFTA provides exceptions under Artcile 12 and incorporates Article XX of the GATT,Footnote 82 which normally serve as the rationale and justification for trade-restrictive policies, such as the protection of human, animal, or plant life.Footnote 83 With regard to trade facilitation measures, customs procedure for the release of goods is regulated under Article 7 of the ASEAN-China FTAFootnote 84 and Article 14 of the AIFTA,Footnote 85 whereas it is absent from the ASEAN-Japan FTA and the ASEAN-Korea FTA. In respect of standards and conformance for the TBT,Footnote 86 the ASEAN-China FTA, the ASEAN-Japan FTA, and the ASEAN-Korea FTA all provide such regulations under Article 7, Chapter 5,Footnote 87 and Article 7Footnote 88 individually, other than the AIFTA. Apart from the ASEAN-China FTA and the AIFTA, SPS are regulated under Chapter 4 of the ASEAN-Japan FTAFootnote 89 and Article 7 of the ASEAN-Korea FTA. TBT and SPS aim to ensure that the measures undertaken are not discriminatory and do not create unnecessary obstacles to trade. To elaborate, the national measures should not condemn for imposing discriminatory treatment or unjustifiable costs in order to favour domestic industry.Footnote 90 At the same time, TBT and SPS recognize a state's right to implement measures by regulating goods. The measures can be implemented in ways that are different from market regulation in order to protect important values; however, such a distinction between protectionist measures and “justifiable regulatory autonomy” is difficult to make.Footnote 91 Last, mutual recognition on product standards is only identified under Article 46 of the ASEAN-Japan FTA.Footnote 92
For provisions regarding services, Article 4 of the ASEAN-China FTAFootnote 93 recognizes cross-border trade under modes 1 and 2 exclusively, compared with mode 3 (commercial presence), defined under the investment sections of both the ASEAN-China FTA and the ASEAN-Japan FTA. Article 7.2 of the ASEAN-China FTAFootnote 94 and Article 7 of the ASEAN-Korea FTAFootnote 95 stipulate the protection of intellectual property. In the longer term, it is expected that “the effective utilization and exploitation of intellectual property” between ASEAN and its external trade partners will contribute “higher exports and greater in-flows of investment”.Footnote 96 The ASEAN-China FTA engages matters in relation to E-commerce and environmental policy under Articles 7.1Footnote 97 and 7.2, in contrast to the other three ASEAN FTAs which lack such provisions, although differences over intellectual property and e-commerce remain two main hurdles to cross during the RCEP negotiations.Footnote 98
Two major observations emerge from the analysis. First, trade facilitation provisions under the AIFTA are narrower in scope as compared to the ASEAN-Japan FTA, as mutual recognition of SPS or product standards are not explicitly included therein. The observation partly explains the relatively modest trade performance of the AIFTA observed so far. Second, service-related provisions do not form a major component of the ASEAN-centric FTAs. However, for India, facilitating service exports through the RCEP market is of crucial importance. India's cautious approach during the RCEP negotiations needs to be viewed in this light. Finally, the SPS standards, NTBs, and intellectual property rights related provisions are not evenly covered under the ASEAN-centric FTAs, and India needs to include these provisions in the RCEP for securing export success.
III. DEEPENING TRADE FLOWS?
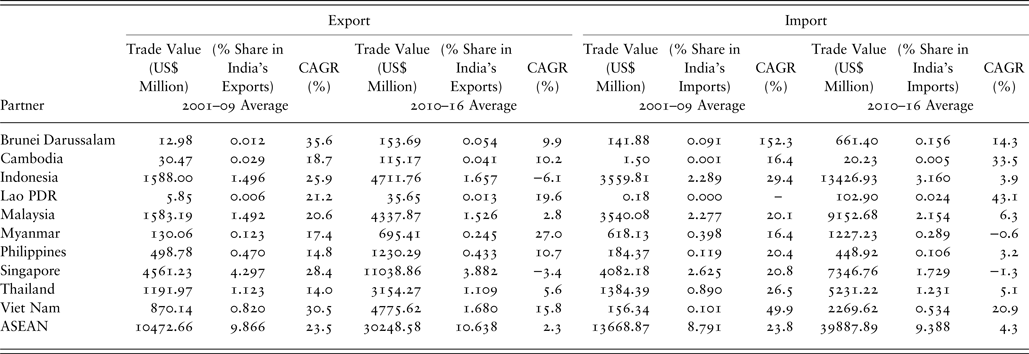
In order to evaluate whether the initial expectations from the Indo-ASEAN FTA have been fulfilled so far, a data analysis has been conducted in the following. Table 3 shows India's merchandise trade with ASEAN partners during 2001–16. The analysis has been conducted with Trade Map data.Footnote 99 The study period has been divided in two sub-periods, namely, 2001–09 and 2010–16. While the former period depicts the limited trade integration (barring the Indo-Singapore CECA) of India with ASEAN, the latter provides insights on the post-bloc dynamics. The observations are noted in the following.
India's export and import scenario with ASEAN countries (2001–16).

Source: Computed by authors from ITC (undated).
First and foremost, there has been a sharp rise in India's bilateral trade flows with all ASEAN partners, indicating growing convergence. The rise in the absolute value of Indian exports has been sharper with the relatively bigger economies, namely Indonesia, Malaysia, Singapore, and Thailand. Interestingly, with all these economies, India either has a bilateral comprehensive arrangement or is in the process of negotiating the same.Footnote 100 Exports to Vietnam have also witnessed a sharp rise. A similar change in imports has been noted as well. Second, the rise in import value has been sharper, thereby widening India's trade deficits with ASEAN. In the post-bloc period, India's average trade balance witnessed a surplus with only four ASEAN members—Cambodia, the Philippines, Singapore, and Vietnam. Interestingly, the trade deficit has increased in the post-2010 period, indicating that the Indo-ASEAN FTA has significantly increased imports from partners. Also, India has a negative trade balance with Malaysia and Indonesia, the former already a “comprehensive” trade partner and the latter expected to be so shortly. The observation indicates that India's market penetration in ASEAN remains modest so far. Third, the importance of the ASEAN partners in India's trade basket has increased, but not in a very significant manner. Interestingly, the share of the Philippines and Singapore, with whom India enjoys a trade surplus, is declining in India's export basket. Only Vietnam stands out in the list. Finally, the compound annual growth rate [CAGR] figures reveal that India's export growth has generally declined for its ASEAN partners (barring the exception of Myanmar) in the post-2010 period, i.e. after the formation of the AIFTA. While the result can be in part explained by the lower trade base during 2001, the competition faced by India in the ASEAN market from other preferential trade partners in the bloc is also underlined.
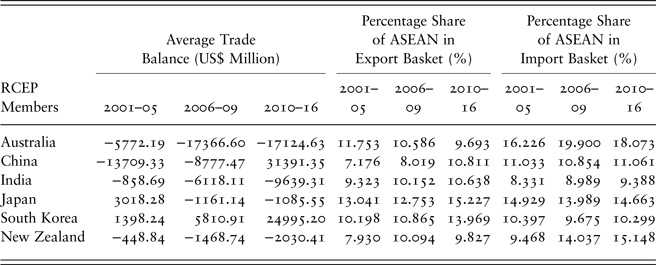
To gain a wider perspective, India's trade performance with ASEAN compared with the other five FTA partners of the bloc is presented in Table 4. The study period has been divided in three sub-periods, namely 2001–05, 2006–09, and 2010–16. The first two periods indicate the modest trade link of the partners with ASEAN. The last period, however, indicates a time when all the FTAs had been signed, i.e. a period of deeper integration. Several interesting insights emerge from the table. First, only India and New Zealand have witnessed a decline in their trade balance with ASEAN over the period. However, the extent of the trade deficit decline has been sharper for India. Second, Australia and Japan also experienced a trade deficit with ASEAN, but the extent is narrowing. South Korea, on the other hand, witnessed a growing trade surplus with ASEAN over the period. However, China registers a massive turnaround as its trade deficit with ASEAN during 2001–05 narrowed during 2006–09 and finally turned into a surplus during 2010–16. Second, the importance of ASEAN in the export basket increased for all the partners, with the exception of Australia and New Zealand. However, the increase during 2010–16 has been quite sharp for China, Japan, and South Korea. Finally, ASEAN's share declined in the import basket only for Australia. In particular, ASEAN's penetration in Chinese and Indian imports is relatively modest vis-à-vis their performance in Japan and South Korea. The results further indicate that, among all the RCEP partners, India's trade performance vis-à-vis ASEAN has been quite humble.
Comparison of trade balance scenario of RCEP members with ASEAN.

Source: Computed by authors from ITC (undated).
The extent of trade integration between India and its ASEAN partners can be further understood by analyzing the bilateral Trade Intensity Index [TII], which shows whether two countries are engaged through trade more intensely vis-à-vis their global trade flows. The TII is calculated by the following formulation:
 $$TII = \; \displaystyle{{\mathop \sum \nolimits_{sd} Xsd_{}/\mathop \sum \nolimits_{sw} X_{sw}} \over {\mathop \sum \nolimits_{wd} X_{wd}/\mathop \sum \nolimits_{wy} X_{wy}}}$$
In the numerator, Xsd refers to the bilateral exports of a given country pair (say, India and Thailand), while Xsw indicates their global exports. In the denominator, Xwd and Xwy represent world exports to a country pair (e.g. India and Thailand) and to the world, respectively. The value of the TII above 1 for any given country pair (say, India and Vietnam) indicates that the trade relation is “intense”, while a value less than 1 indicates otherwise. It is expected that, as a result of the formation of a trade agreement, the index would increase and eventually cross 1. The TII indices have been obtained from the ADB ARIC database.Footnote 101
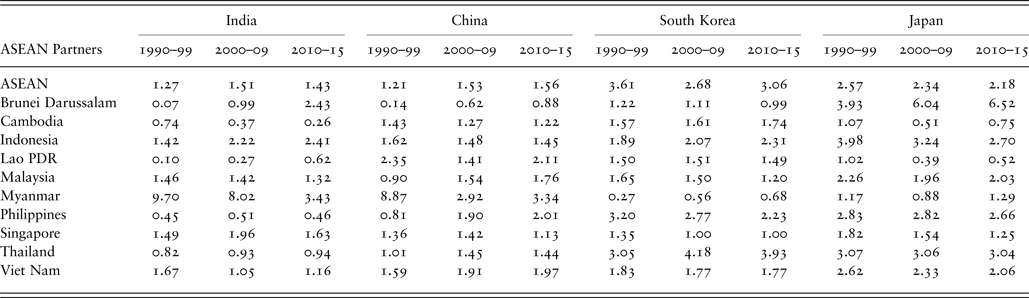
The average TII results for total trade flows are summarized in Table 5. The study period has been divided in three sub-periods, namely, 1990–99, 2000–09, and 2010–15. The last period is known for the deeper trade integration of ASEAN with its FTA trade partners. To compare India's performance in the light of other RCEP partners, the corresponding results for China, Japan, and South Korea are also reported. The results indicate that, at the aggregate level, India is not having an intense trade relationship with four ASEAN countries during 2010–15, namely Cambodia, Lao PDR, the Philippines, and Thailand. The corresponding numbers for China, Japan, and South Korea are one (Brunei), two (Cambodia, Lao PDR), and two (Brunei, Myanmar), respectively. While India's non-intense trade relations, even after the formation of the FTA, with almost fifty percent of ASEAN members is a matter of concern; the development profile of these countries is also telling. For instance, the presence of only the Philippines and Thailand, two developing countries in the list, underlines India's limited market penetration vis-à-vis other RCEP partners.
India's Overall Trade Intensity Index with ASEAN in comparison with select RCEP members.

Source: Constructed by authors from ADB (undated).
The intensity of a country to reach the partner markets as compared to rest of the world, particularly for key economic sectors, can be understood through the Export Intensity Index [EII]. The EII can be calculated by the following formulation:
 $$EII = \displaystyle{{x_{ij}/X_{iw}} \over {x_{wj}/X_{ww}}}$$
In the numerator, Xij refers to the bilateral export of a given country pair (say, India's exports to South Korea), while Xiw indicates India's global exports (either in total trade or in a particular sector, say, pharmaceuticals). In the denominator, Xwj and Xww represents world exports to the importing country (i.e. South Korea in this case) and to the rest of the world, respectively. A value of the EII above 1 for any given country pair (say, India and South Korea) indicates that export penetration from India is “intense”, while a value of less than 1 indicates otherwise. As with the TII, it is expected that trade integration would result in a rise in the index, which eventually may pass 1.
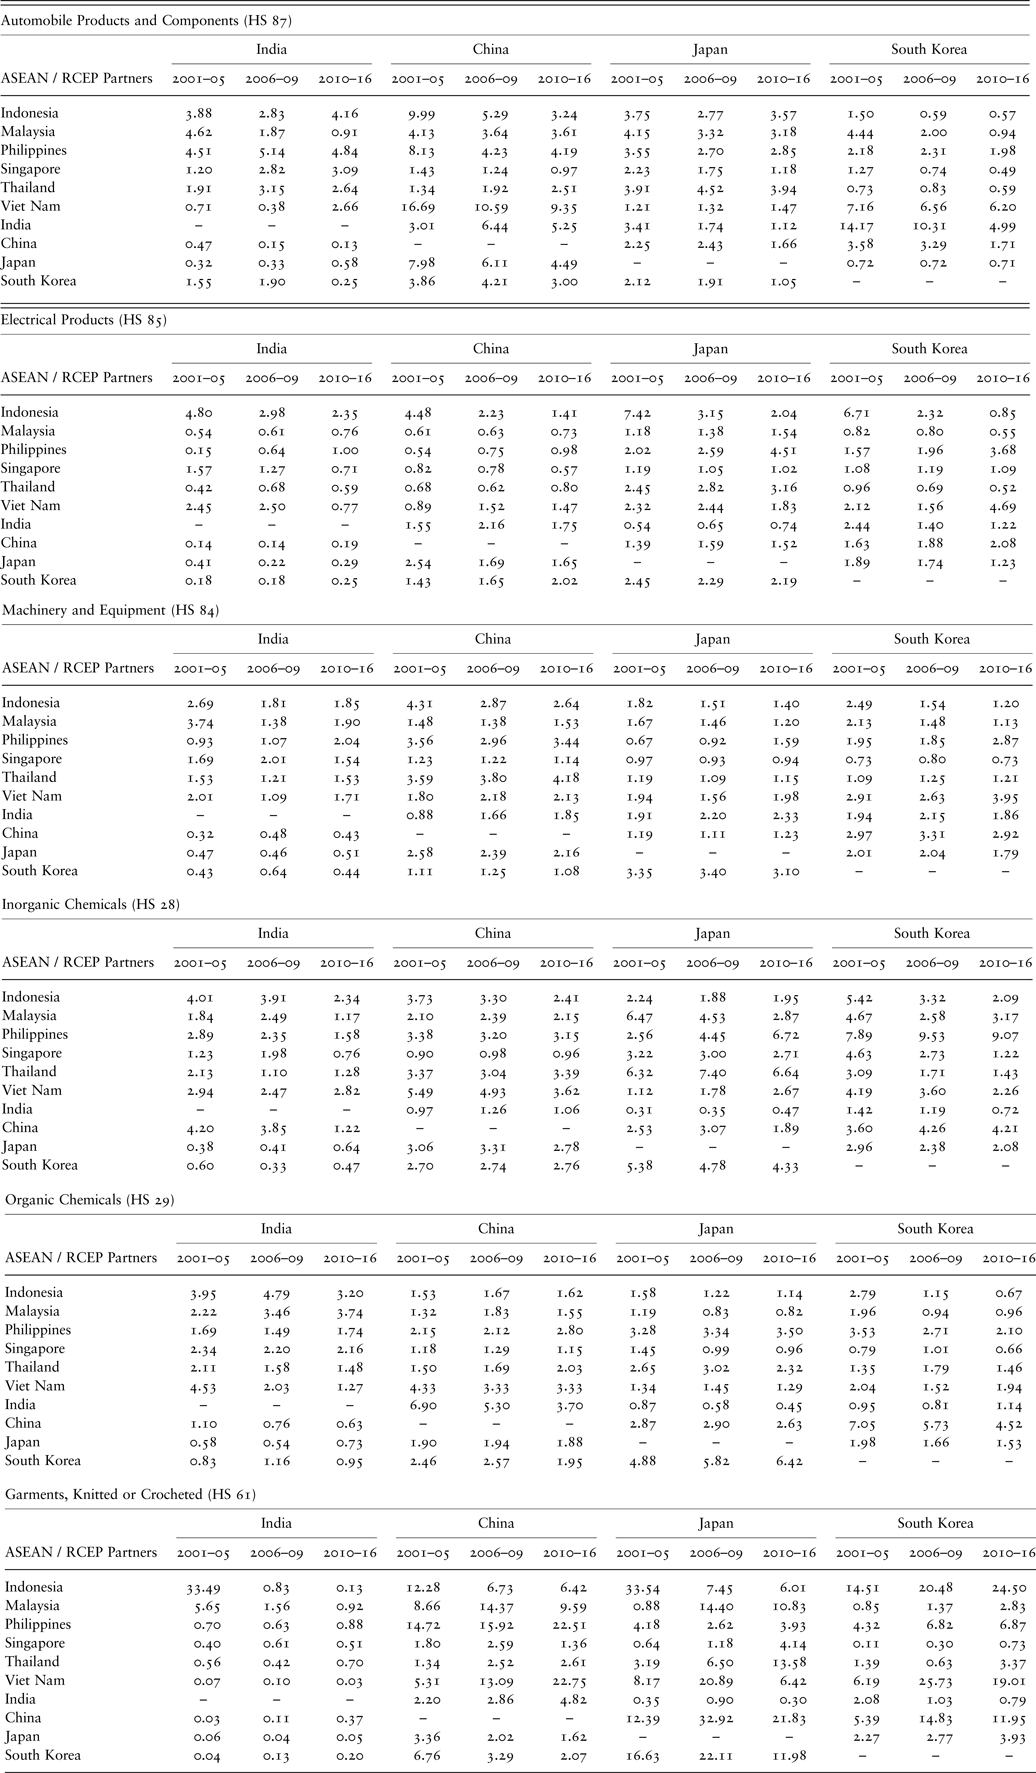
The EII indices have been computed from the Trade Map data. EII data for six key sectors, namely Inorganic Chemicals (HS 28), Organic Chemicals (HS 29), Garments, Knitted or Crocheted (HS 61), Machinery and Equipment (HS 84), Electrical Products (HS 85), and Automobile Products and Components (HS 87) have been computed for India, China, Japan, and South Korea, involving their trade with key ASEAN countries. Also, for additional insight, the EIIs for ASEAN's four FTA partners in their bilateral trade with the bloc have been reported.
The sectoral EII results summarized in Table 6 indicate how the effects of regional integration on merchandise trade influence the current RCEP negotiations. First, India's EII is generally above unity with ASEAN countries for several sectors, underlining its deeper penetration in respective markets vis-à-vis the rest of the world. However, for electrical products and garments, its penetration to most of the ASEAN economies has not deepened even in the post-bloc period. Second, India's EII is generally less than unity in all six sectors with China, Japan, and South Korea. This prevails despite the tariff preferences implemented under the Indo-Japan and India-Korea CEPAs. Third, China enjoys an intense export relationship with most of the ASEAN economies and its three FTA partners, indicating its growing competitiveness and urge to push for the RCEP. Finally, Japan and South Korea enjoy a favourable EII in most of the ASEAN markets and China. However, in the Indian market for garments sector the EII is less than unity for both countries. In addition, Japan also witnessed a non-intense export relation with India in the chemical sectors.
India's sectoral Export Intensity Index with key ASEAN players in comparison with select RCEP members.

Source: Computed by authors from ITC (undated).
The EII observations underline India's negotiating perspective in the RCEP, considering its practical gains in the Indo-ASEAN FTA, and the Indo-Japan and India-Korea CEPA. The non-intense relation in several sectors with the FTA partners is reflected in India's rising trade deficits. Similarly, the sectoral non-intense relations with the three RCEP partners, despite the tariff preferences on its exports, may prompt India to adopt a cautious approach during RCEP negotiations. On the other hand, China enjoys an intense export relation with India, which it would like to formalize through further tariff reforms in India under the RCEP. India, however, would be cautious against possible Chinese dumping in the post-bloc period, an issue which is already a major area of concern.Footnote 102 Japan and South Korea, on the other hand, look forward to further trade reforms and economies of scale for investment projects through the RCEP in a wider geographical region.
IV. QUESTIONING THE RELEVANCE OF THE INDIA-ASEAN FTA
Deepening participation in IPNs has been another major motive for India to join the Southeast and East Asian FTAs. When a country is exporting a product (e.g. garments), it can either rely on domestic players to produce the entire value chain (i.e. produce cotton, fibre, fabric, and finally garments within the country) or depend on foreign suppliers for certain stages of production (e.g. produce and export cotton, and import fabric for garment production). It may also import quality services (e.g. banking, IT, consultancy, logistics) from abroad to enhance export competitiveness and potential.
If a country liberalizes import policy (either unilaterally or through an RTA), it is expected that, during the initial stage, the percentage contribution of domestic players in the exported product would decline, as exporters would source quality raw materials, intermediate products, and parts and components from abroad at a cheaper rate. This gives rise to the “Smile Curve” phenomenon,Footnote 103 which may occur either due to the exit of domestic players caused by foreign competition or because of greater integration with regional IPNs. The former would lead to readjustments in the domestic sector, creating short-run resistances against liberalization. For a country like India, where participation by global multinational corporations [MNCs] remained nominalFootnote 104 even two decades after liberalization, the foreign value content in exports may increase through the working of both forces. In the long run, as the domestic industry consolidates and matures by gaining competitiveness, their contribution in exports is likely to increase.
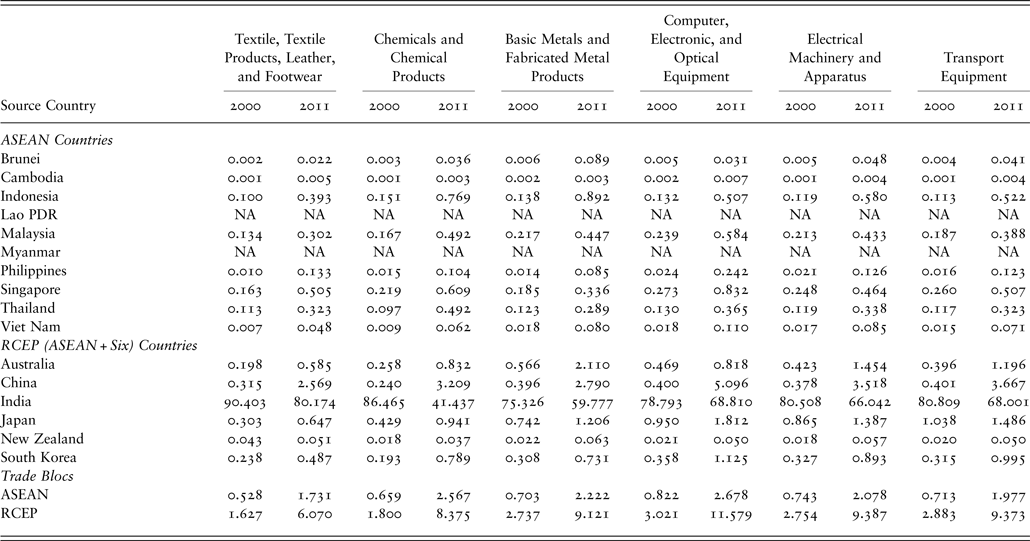
In the current context, the data on origin of value added in the exports of six sectors is drawn from the Organisation for Economic Co-operation and Development [OECD] Trade in Value-Added [TIVA] database.Footnote 105 The six manufacturing sectors considered for analysis, namely textile and leather, chemical, base metals, computer and electronics, electricals, and transport equipment, are characterized by the presence of deepened IPNs. Table 7 summarizes the origin of the value added scenario for these sectors during 2000 and 2011 for Indian exports from RCEP partners. In other words, the table shows, for every US$100 worth of Indian exports in each sector, the value contribution from individual ASEAN and RCEP partners. The year 2000 represents the period before the formation of the major Asian FTAs, while the integration effects started materializing in 2011.
Origin of value added in gross exports from India in select sectors (percentages).

Source: Constructed by authors from the OECD (undated).
The summarized results have the following interpretation. The figures presented in the row for India for a sector (e.g. transport equipment) indicate the percentage share of domestic value addition, while the other country rows represent the contribution of foreign value addition from that country. For instance, the last two columns reveal that, while in 2000 domestic value addition in the transport equipment sector in India (e.g. local parts and components, labour values embodied in output) contributed 80.809 percent of value addition to the country's total export of transport equipment, the corresponding figure in 2011 declined to 68.001 percent. On the other hand, the contribution of Chinese players in Indian exports of this category has increased significantly from 0.401 percent to 3.667 percent over this period. This implies greater participation by foreign players in the upstream activities of Indian exporting firms. While on the one hand this signifies a deepening of India's IPN integration with the world in the transport equipment sector, threats to domestic parts and components manufacturers from import penetration may not be ruled out.
The following observations emerge from Table 7. First, for exports of all six product categories, the percentage share of domestic value addition is declining for India, signifying increased sourcing from ASEAN and RCEP members and from other parts of the world. This might result from both the rise in imports of intermediate products in India given the tariff preferences, and the possible lack of competitiveness in semi-processed and intermediate product categories. Also, the rise in value addition in exports from Singapore (CECA in 2005) and Malaysia (CEPA in 2011) signifies that ASEAN suppliers are becoming integrated into Indian IPNs, with the aid of tariff preferences. However, participation by Indian players in upstream activities for ASEAN's exports still remains modest.Footnote 106
Second, the rise in participation from ASEAN in India's production pattern remains much weaker as compared to China, which is an indicator of the dragon's growing competitiveness in the manufacturing sector, particularly in parts and components and intermediate products. The growing trade deficit of India with respect to China, resulting from both possible imports of intermediate products and service link costs, needs to be viewed in this light. This is in line with China's export pattern to other RCEP countries, where the country is expanding its share in the partner's export value content for several manufacturing categories.Footnote 107
Third, the contribution from the CEPA partners South Korea and Japan has also increased in India's exports, given the tariff and trade facilitation reforms implemented through the RTA. However, their contribution looks quite modest in comparison with China. The phenomenon can be explained by two factors. One, because of geographical proximity and associated lower transportation costs Chinese products can enter the Indian market with relative ease vis-à-vis the Japanese and Korean players, and can participate more deeply in the value chains. Two, it is often observed that Indian traders are using the MFN route for trading with another FTA partner rather than following the preferential route, to avoid the associated compliance-related complexities.Footnote 108 Finally, despite freeing FDI restrictions in India across sectors, the ease of doing business and other factors are still not favourable. The degree of FDI reform has also slowed down,Footnote 109 perhaps thereby limiting the participation of Japanese and Korean players. This calls for initiating the necessary procedural reforms in existing FTAs on one hand and suitably amending the FDI policy framework on the other.
In recent global value and supply chains, particularly in process industries and logistics operations, increasing recourse to digital and artificial intelligence [AI] related technologies is being observed.Footnote 110 Taking note of the emerging global trend, the Digital India initiative launched by the government of India in 2015 is already focusing on this aspect.Footnote 111 The increasing use of AI-IT applications and robotics currently find applications in both the private and government sectors. It has been observed that “[c]ommercial applications of AI are huge and Indian start-ups are beginning to identify them and tap into the market, which is still nascent”.Footnote 112
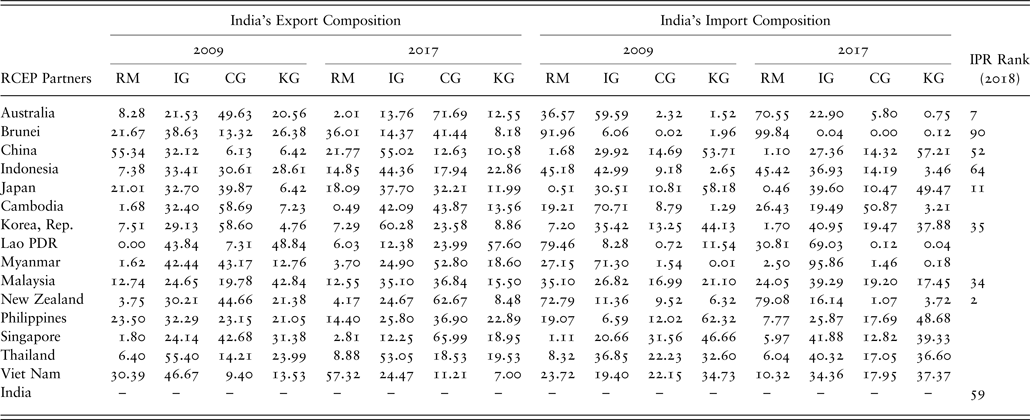
Table 8 summarizes the intra-RCEP trade pattern from an Indian perspective, by focusing on the stage of processing, for 2009 and 2017, respectively. By United Nations Conference on Trade and Development [UNCTAD] classifications, trade flows can be divided into four broad categories, namely raw materials (e.g. cotton yarn), intermediate goods (e.g. fibre and fabrics), consumer goods (e.g. 100 percent cotton garments), and capital goods (e.g. textile machines). In addition to trade patterns, the Intellectual Property Rights [IPR] Index rank of countries in 2018 is also noted. Several observations emerge from the table. First, it is observed that India's export basket to the advanced economies, i.e. Australia, Japan, New Zealand, and South Korea, primarily consists of intermediate products and consumer products. Second, for countries such as Australia and Singapore, the proportional share of capital goods has come down over the period. Third, India's import basket is predominantly tilted in favour of raw materials (coal and petroleum products) from Australia, Brunei, Indonesia, and New Zealand. Fourth, import of intermediate goods has increased from advanced countries like Japan, Malaysia, Singapore, South Korea, and Thailand, on the one hand, and emerging countries like Lao PDR and Myanmar, on the other. Finally, the relative import of capital goods is high from both advanced countries such as China, Japan, Singapore, South Korea, and Thailand, and emerging economies such as Vietnam.
Comparing the composition of India's trade with RCEP Partners (in percentages) and intellectual rights protection.

Source: Computed from the WITS (World Bank, undated) data and Property Rights Alliance (2018); Notes: RM – raw materials; IG – intermediate goods; CG – consumer goods; KG – capital goods.
It can be observed from Table 8 that India is emerging primarily as an exporter of components and consumer goods to the RCEP region, barring the exception of Lao PDR. Though trade in technology products (distributed in consumer and capital goods) is very much observed, exports from India to the RCEP on that front have not yet intensified. One underlying reason behind this fact is that, through FDI from Japan, South Korea, and other sources over the last two decades, the ASEAN countries have reached a higher technology plane vis-à-vis India.Footnote 113 This is reflected in both higher R&D expensesFootnote 114 and better IPR rankings for the ASEAN countries when compared to India. In addition, AI is at a nascent stage in India now and the focus is concentrated on basic activities like healthcare, education, infrastructure, etc.Footnote 115 Therefore, in the short run, the India-RCEP technology trade may intensify on the import front, and only after innovation becomes deeply rooted in the country through the “Make-in-India” initiative may exports pick up.
V. CONCLUSION: A SPEEDY RESOLUTION OF RCEP NEGOTIATIONS?
The analysis so far indicates that India's achievements under the Indo-ASEAN FTA have indeed been modest, with only partial fulfilment of initial expectations. The outcome can be explained in the following manner. Since the late 1990s, India has emerged as a service exporter, while the manufacturing sector has been steadily losing competitiveness. This poor performance has been explained by a lack of labour reforms, an absence of economies of scale, low firm turnover, imperfect market integration, high concentration, prevalence of obsolete technology, etc.Footnote 116 While the manufacturing sectors in ASEAN members and China have benefitted greatly through technology transfer from Korean and Japanese investments, a similar effect on the Indian context is still missing despite the inception of the CEPAs. This cautious approach by foreign investors can be explained by several factors, e.g. the modest ease of doing business scenario prevailing in India, infrastructural bottlenecks, poor skill levels, and so on. In addition, several Indian Special Economic Zones [SEZs] have been set up with ease of land acquisition in mind, rather than proximity to a port and ease of exporting considerations. As a result, actual exports even from these regions remain far below potential.Footnote 117 In the absence of these stage two reforms, tariff reforms under the FTA have merely increased imports, as reflected in the rising trade deficit and growing foreign value content in Indian exports.
Only in the recent period is India trying to make a concerted echo effect to revive the manufacturing sector. For instance, the recent “Make-in-India” campaign to facilitate FDI inflow and technology transfer has started to show positive results.Footnote 118 The “Skill India” initiative is similarly expected to create a pool of highly skilled workers and thereby address the concerns of potential investors. The creation of crucial industrial corridors, linking the major economic and manufacturing centres, is another initiative to secure a reduction in the cost of domestic production on the one hand and facilitating foreign investment on the other.Footnote 119 Finally the introduction of a Goods and Services Tax [GST] in India since 1 July 2017 is expected to simplify the tax regime in the country, helping both the domestic and foreign players established in the country. However, only in the long run will these measures strengthen Indian manufacturing sector competitiveness. Hence, in the recent period, the domestic sector has repeatedly approached the government for respite against cheaper imports from ASEAN, often through contingency measures.Footnote 120 Similar protection against imports from China has also been sought and granted at times.Footnote 121
India hoped to compensate for the limited gains under the Indo-ASEAN FTA in merchandise trade through increased export opportunities under trade in services. It agreed to participate in services sector negotiations after completion of the merchandise sector agreement, hoping that ASEAN would reciprocate. However, the lengthy negotiations on a services agreement with ten ASEAN countries after the entry of the FTA in goods resulted in less than expected benefits. Though India and ASEAN entered into the trade agreement on services and investment in September 2014, Indonesia and Cambodia are yet to ratify the provisions, primarily fearing entry of Indian professionals into their service markets.Footnote 122 India is presently looking for further service sector reforms in other ASEAN markets as well. The country's recent interest in a Trade Facilitation in Services [TFS] agreement needs to be viewed in this light.Footnote 123 The increasing stringency in the US services market would also force India to negotiate harder in the RCEP.Footnote 124
The cautious approach adopted by India during the RCEP negotiations so far can therefore be explained by the growing trade deficit with the “East” economies on the one hand and the apprehensions about the exposure of domestic players to the duty-free entry of Chinese imports on the other. The growing merchandise trade deficit is already a matter of concern in India, with associated political repercussions.Footnote 125 The partial realization of the potential benefits of service sector exports in the ASEAN market pose another challenge for India. The past experience with ASEAN and the prevailing trade scenario rationalize India's inclinations to conduct the RCEP merchandise and services agreement negotiations simultaneously rather than sequentially. The divergence in sectoral interests, e.g. China's ambitious agenda on trade in goods and defensive interests in services,Footnote 126 is contrary to India's expectations from the bloc. Second, several tariff and non-tariff barriers on Indian products in the Chinese market have been noted in the literature, e.g. marine, chemicals, pharma, textiles and apparel, rubber, iron and steel, non-ferrous metals, plastics, and machinery sectors, among others.Footnote 127 However, given the fact that ASEAN and China may press for deeper reform in India's merchandise imports, the slow progress of the negotiations is unlikely to change. Therefore, unless India receives a matching deal in the sphere of services, speedy agreement on the RCEP would remain elusive.
It deserves mention that the absence of wider stakeholder consultations and access to negotiating documents have often been criticized,Footnote 128 which fuel a negative sentiment against the possible ill-effects of the bloc. The negotiators therefore prefer to adopt a cautious approach at RCEP forums, and the associated delays, if interpreted as negotiating victories, might provide political mileage at home.Footnote 129