

Overall objective and organization of this review
The review is organized into several broad categories. We begin by describing foundational principles of metastasis and tumor heterogeneity. This is followed by some of the earliest metastasis suppressor gene discoveries (nm23, KISS1, BRMS1) and how they were discovered. Their mechanisms of action are outlined along with some of the context-specific differences reported for each. Next, genes and gene products regulating epigenetic processes are presented, followed by RNA and protein translational regulation molecules. A brief segue will introduce background genetics and how they alter metastasis efficiency before summarizing molecules involved in adhesion, signaling, and invasion.
What has emerged is a clear conclusion that metastasis genetics is complex, multifactorial, and context dependent. Idiosyncrasies of each gene (and gene product) are still being worked out. Despite those complexities, significant progress has been made, and clinically translatable endpoints are coming more into focus (Steeg and Theodorescu, Reference Steeg and Theodorescu2007; Steeg et al., Reference Steeg2009; Gelman, Reference Gelman2023). Importantly, metastasis-associated genes control multiple cellular responses to different microenvironments. Indeed, some metastasis-associated molecules regulate the tissue microenvironment. As individual genes are described next, we have attempted to summarize key correlative findings as well as any disparities of findings in different tumor types and in different assays.
Throughout this review, we have attempted to minimize presentation of our bias regarding strength and weakness of specific data, preferring that readers make conclusions based on their experiences and incorporation of some as-yet-unreported data. While we have attempted to be relatively comprehensive, we acknowledge that some papers and findings are missing. Likewise, for practical reasons, we present some genes/gene products in greater depth, while others are included only to emphasize specific points and/or patterns. Our hope is that this critical analysis will highlight directions for future studies with these, and newly discovered, metastasis-associated genes.
In the end, this review provides a lot of information. We encourage readers to not focus on the details (unless they are of particular interest to you) since the major theme – the context dependency of metastasis gene function – will be lost. Rather, we suggest looking at vignettes illustrated by each of the genes, gene classes, or signaling pathways to demonstrate how the context matters. Location (tissue of origin and subcellular), isoforms and post-translational modifications, interactors (both cellular and molecular), regulators (signaling and epigenetic), and stability are all determinants of metastasis gene (product) mechanism(s) of action. Additionally, we encourage readers to consider the quality and availability of selective reagents and how those parameters have limited the ability to define mechanisms of action. As the field moves forward, careful integration of these currently disparate observations will reveal an accurate and holistic view of the metastatic process. From those new insights, improvements in cancer diagnosis and treatment will emerge.
Since this journal has a wide spectrum of readership, we have prepared supplemental tables of abbreviations and a list of commonly used cell lines that are cited in order to overcome specialty-specific jargon. Whenever appropriate, we have cited original articles rather than other summary reviews. Doing so, we hope that readers will be able to critically evaluate the claims made.
Metastasis biology
Metastasis involves dissemination of cells away from the original tumor via different routes – hematogenous (Fidler, Reference Fidler1978; Nicolson, Reference Nicolson1988), lymphatics (Sleeman and Thiele, Reference Sleeman and Thiele2009; Nathanson et al., Reference Nathanson2018; Leong and Witte, Reference Leong and Witte2024), across coelomic cavities (Lengyel, Reference Lengyel2010; Clark et al., Reference Clark2013), along nerves (Marchesi et al., Reference Marchesi2010; Sleeman et al., Reference Sleeman2011; Roh et al., Reference Roh2015), and between endothelial cells and basement membranes (Lugassy et al., Reference Lugassy2004). All of these routes of metastasis are clinically important, but hematogenous metastasis (Figure 1) is most extensively studied since it is associated with development of visceral metastases. Dissemination involves motility of cancer cells that occurs by a variety of mechanisms in which cells utilize cell–cell and cell–matrix interactions (Wolf et al., Reference Wolf2007; Yilmaz and Christofori, Reference Yilmaz and Christofori2010; Friedl et al., Reference Friedl2012; Simini et al., Reference Simini2012; Te Boekhorst et al., Reference Te Boekhorst2016; Stuelten et al., Reference Stuelten2018; Mishra et al., Reference Mishra2019; Parlani et al., Reference Parlani2023; Garcia-Arcos et al., Reference Garcia-Arcos2024; Chastney et al., Reference Chastney2025). Some of the motile cells move about haphazardly, while others are sometimes directed by chemotactic, haptotactic, or durotactic signals (Rieppi et al., Reference Rieppi1999; Luangdilok et al., Reference Luangdilok2007; Su et al., Reference Su2010; Stuelten et al., Reference Stuelten2018; Chitty et al., Reference Chitty2026). Recent evidence suggests that subsets of cancer cells serve as pioneers, while others follow leader cells (Konen et al., Reference Konen2017; Khatib et al., Reference Khatib2025; Wan et al., Reference Wan2025). Invasion, as the defining feature of malignancy, describes the capacity for neoplastic cells to penetrate basement membranes and stroma. Invasion often involves degradation of matrices (Stetler-Stevenson et al., Reference Stetler-Stevenson1993; Mason and Joyce, Reference Mason and Joyce2011; Radisky, Reference Radisky2024), but proteolytic cleavage of the extracellular matrix (ECM) is not always required (Wolf et al., Reference Wolf2003; Wolf and Friedl, Reference Wolf and Friedl2006; Te Boekhorst et al., Reference Te Boekhorst2016). While invasion is required for metastasis, it is not sufficient for cells to metastasize.
The pathogenesis of blood-borne metastasis. Although metastases can arise by dissemination via multiple routes, hematogenous spread is considered especially important because it results in widespread seeding of cells to multiple visceral, vital organs. Metastatic cells arise from heterogeneous populations of neoplastic cells which arose as a result of genomic instability and epigenetic responses to the tumor microenvironment (TME). The cancer cells likewise influence the TME by inducing new vessels (angiogenesis), which are commonly less patent and more convoluted. Competent neoplastic cells invade locally, eventually intravasating into thin-walled vessels, where they enter circulation. During transport, cells are susceptible to sheer and attack by immune cells as well as cooperation with platelets and other blood components. Individual cells or cell clusters (homotypic or heterotypic) adhere to endothelial surface molecules or become trapped by their inability to squeeze through small vessels. Arrested cells then exit the vessels (extravasate) and, if they have arrived at permissive sites and can respond favorably to new TME, they proliferate and colonize secondar tissues.

Figure 1. Long description
The flowchart consists of eight sequential stages connected by black arrows.
1. Tumor growth Genetic instability. A cluster of heterogeneous neoplastic cells sits atop a basement membrane.
2. Angiogenesis. New, convoluted blood vessels grow into the tumor mass.
3. Local invasion Intravasation. Cancer cells break through the basement membrane and enter the newly formed vessels.
4. Transport Interaction with blood components. Cells travel through a winding blood vessel, interacting with red blood cells and platelets.
5. Adhesion forward slash Arrest. A cancer cell adheres to the endothelial lining of a vessel wall.
6. Extravasation. The cancer cell squeezes through the vessel wall into the surrounding tissue matrix.
7. Colonization. The cells proliferate in the new environment, forming a secondary tumor mass.
8. Final Seeding. The path concludes at a group of vital organs showing metastatic sites, including the brain, lungs, liver, and a cross-section of bone marrow.
Metastasis is recognized as the primary contributor to cancer morbidity and mortality (Welch and Hurst, Reference Welch and Hurst2019), but it is not the only cause of cancer deaths (Boire et al., Reference Boire2024). When cancers are detected early, survival rates improve dramatically. However, if the cancer has already spread, cure rates drop sharply. Fortunately, not all cancers metastasize. Some cancers are highly aggressive, establishing secondary lesions with high frequency (e.g., melanoma, pancreatic ductal adenocarcinoma, small cell carcinoma of the lung). Other cancers rarely metastasize despite being locally aggressively invasive (e.g., basal cell carcinomas of the skin, glioblastoma multiforme) (Esserman and Varma, Reference Esserman and Varma2019). Some argue that invasion is recapitulation of an embryonic process – the epithelial–mesenchymal transition (EMT) (Thiery, Reference Thiery2002). EMT allows dissociation of epithelial cells by acquisition of mesenchymal characteristics (Chaffer et al., Reference Chaffer2016; Lambert et al., Reference Lambert2017). Concomitantly, cells undergoing EMT acquire stem-like characteristics that will be required for proliferation at secondary sites (Mani et al., Reference Mani2008; Lambert et al., Reference Lambert2017). The EMT theory also includes reversion to an epithelial phenotype, so cells can resume proliferation. The reversion is termed the mesenchymal–epithelial transition (MET) (Chaffer et al., Reference Chaffer2006; Tsai et al., Reference Tsai2012a). However, it is important to recognize that EMT is not exclusively bimodal. There is a continuum of phenotypes exhibiting characteristics of the epithelial and mesenchymal states (Bakir et al., Reference Bakir2020; Graziani et al., Reference Graziani2022; Zhang et al., Reference Zhang2025a). Likewise, cooperative migration of cell clusters often observed in histologic sections argues for relatively common retention of cell–cell junctions (Saitoh, Reference Saitoh2018).
Abundant evidence supports roles for EMT in carcinomas, but a few experiments point to the nonuniversality of EMT as a requirement for cancer metastasis. Tsuji et al. isolated and generated cell lines from a single tumor which were stable for either epithelial or mesenchymal characteristics (Tsuji et al., Reference Tsuji2008, Reference Tsuji2009). Neither population successfully completed the metastatic cascade when injected individually. However, when coinjected, both cells were found in metastases. In other studies that utilized reporter genetic constructs activated when cells underwent EMT, metastases were formed even when cells had not undergone intervening EMT (Fischer et al., Reference Fischer2015; Zheng et al., Reference Zheng2015). Therefore, while EMT is a means to metastasis, it is neither necessary nor sufficient.
Following invasion into blood, lymphatics, or body cavities, neoplastic cells must survive sheer forces (Krog and Henry, Reference Krog and Henry2018) and immune cell killing (Delclaux et al., Reference Delclaux2024; Goddard et al., Reference Goddard2024; Dai et al., Reference Dai2025). Surviving cells eventually arrest as single cells or emboli when vessel diameters become too small to traverse (Fidler, Reference Fidler1970, Reference Fidler1973a; Updyke and Nicolson, Reference Updyke and Nicolson1986). Or they selectively recognize and adhere to plasma membrane molecules on vessel walls (endothelium) or tissue linings which represent cellular “addresses” (Alby and Auerbach, Reference Alby and Auerbach1984; Auerbach et al., Reference Auerbach1987; Belloni and Nicolson, Reference Belloni and Nicolson1988; Belloni and Tressler, Reference Belloni and Tressler1989; Pasqualini and Ruoslahti, Reference Pasqualini and Ruoslahti1996; Pasqualini et al., Reference Pasqualini2002). Following arrival at secondary sites, cells must eventually proliferate to form secondary masses in order to be called a bona fide metastasis (Welch and Hurst, Reference Welch and Hurst2019; Gerstberger et al., Reference Gerstberger2023).
Colonization, the last step in the metastatic cascade, involves co-option of existing vessels, angiogenesis, or the formation of vascular channels by tumor cells themselves (Hendrix et al., Reference Hendrix2003; Folkman, Reference Folkman2006; Naumov et al., Reference Naumov2008). Emerging evidence suggests that signals from a primary tumor create a niche which subsequently disseminated cells depend upon for eventual survival and proliferation (Kaplan et al., Reference Kaplan2006; Psaila and Lyden, Reference Psaila and Lyden2009; Peinado et al., Reference Peinado2017). The nature of these premetastatic niches varies and can involve bone marrow progenitors (Kaplan et al., Reference Kaplan2005; Lucotti et al., Reference Lucotti2025), myeloid-derived suppressor cells (Psaila and Lyden, Reference Psaila and Lyden2009), neutrophils (Wculek and Malanchi, Reference Wculek and Malanchi2015; Albrengues et al., Reference Albrengues2018), and neutrophil extracellular traps (Demers et al., Reference Demers2012; Cedervall et al., Reference Cedervall2016; Lee et al., Reference Lee2025; Shahzad et al., Reference Shahzad2026). Importantly, the niches alter the microenvironment and allow cells that have arrived to thrive and proliferate in the new location (Deasy and Erez, Reference Deasy and Erez2022; Mukherjee and Bravo-Cordero, Reference Mukherjee and Bravo-Cordero2023; Nowosad et al., Reference Nowosad2023; Patras et al., Reference Patras2023; Monteran et al., Reference Monteran2024; Wu et al., Reference Wu2024; Lucotti et al., Reference Lucotti2025; Parida and Malladi, Reference Parida and Malladi2025; Thakur et al., Reference Thakur2025). However, it is important to note that metastases can subsequently metastasize as well (Fidler and Nicolson, Reference Fidler and Nicolson1977).
Colonization of secondary (or higher order) sites does not require immediate cell division. Cancer cells can remain dormant for years following seeding (Yeh and Ramaswamy, Reference Yeh and Ramaswamy2015; Gay and Malanchi, Reference Gay and Malanchi2017; Aguirre-Ghiso and Sosa, Reference Aguirre-Ghiso and Sosa2018; Chiu et al., Reference Chiu2023; Tau and Miller, Reference Tau and Miller2023; Truskowski et al., Reference Truskowski2023; Agudo et al., Reference Agudo2024; Tomasin and Ghajar, Reference Tomasin and Ghajar2024; DeMichele et al., Reference DeMichele2025). From a clinical perspective, dormancy simply means that the volume of tumor cells is below the limit of detection using current imaging or biochemical assays. From a mechanistic perspective, dormancy is critically important. There is considerable interest in maintaining cells in a latent state as it could lengthen the asymptomatic or a symptomatic phase of cancer which is more tolerable, allowing patients to live longer while retaining a high quality of life (Werner-Klein and Klein, Reference Werner-Klein and Klein2019; Agudo et al., Reference Agudo2024).
For many years, metastasis was considered the ultimate stage of tumor progression, that is, it occurs late in the pathobiology of neoplasia. However, several recent studies have introduced some doubt into that conclusion. Namely, cancer cells can begin disseminating long before a primary tumor is detectable (Husemann et al., Reference Husemann2008; Friberg and Nystrom, Reference Friberg and Nystrom2015; Harper et al., Reference Harper2016; Hosseini et al., Reference Hosseini2016). Fortunately, the metastatic process is highly inefficient (Weiss, Reference Weiss1990). But the possibility that cells exist systemically – even if not detectable at the time of diagnosis – alters treatment options and strategies. As a result, the underlying mechanisms leading to any of the earlier steps of metastasis will be pivotal to improving treatment outcomes. It is to that end that we submit this review.
Heterogeneity of cancer and metastasis
Another important tenet regarding metastasis derives from the long-recognized heterogeneity that exists within every neoplasm (Hunter et al., Reference Hunter2018) and metastasis (Yang et al., Reference Yang2026). Behavioral and morphologic differences are due to genetic, epigenetic, positional, or temporal variations (Welch, Reference Welch2016). Genetic heterogeneity is defined by inherent and relatively stable properties for a given phenotype. Epigenetic heterogeneity is characterized by transient chemical modifications of DNA or chromatin that alter gene transcription in a spatial and temporal manner. Critically, most metastases are clonally derived (Wolman et al., Reference Wolman1985; Fidler and Talmadge, Reference Fidler and Talmadge1986; Yamamoto et al., Reference Yamamoto2003; McGranahan and Swanton, Reference McGranahan and Swanton2017) and the cells that eventually colonize ectopic sites can be selected for (Fidler, Reference Fidler1973b). Since a small fraction of cells successfully metastasize and since the signal-to-noise ratio for biochemical, genetic, and epigenetic changes in that small population could be masked by the majority of cells, progress in identifying the underlying mechanisms of metastasis has been painstakingly slow. The mixed compositions of metastases can be explained by inherent genetic and genomic instability of neoplastic cells, movement of cells between metastases, seeding by late-arriving cells, and differential responses of cells within the metastasis to external signals. Nonetheless, substantial progress has been made.
As one explores the underlying genetics of metastasis, another caution is advised. Metastasis is a complex genetic disease. By complex disease, we refer to any disease or disorder that involves the interplay of multiple genes (termed quantitative trait loci, QTL), each contributing a small part to the whole (reviewed in Cookson et al., Reference Cookson2009; Qi et al., Reference Qi2024). Of the steps outlined earlier, a successful metastatic cell must possess all those characteristics. For if a cell cannot complete any step in the metastatic cascade, it cannot proceed to subsequent steps. Moreover, complex diseases occur on different genetic backgrounds which amplify or mute specific genetic or epigenetic changes in the cancer cells (Medicine NAoSEa, 2023). When coupled with environmental influences, assessment of the impacts of specific genes and molecules is daunting.
Metastasis genetics, like cancer genetics, can be categorized in different ways. Analogous to genes (and gene products) that either increase or decrease neoplastic transformation, there are genes/products that enhance or suppress metastatic efficiency. Nguyen et al. categorize them in a slightly different way. They categorize metastasis genes by when they are involved in metastasis – initiation (invasion, angiogenesis, bone marrow mobilization, and circulation), progression (extravasation, survival, and reinitiation), and virulence (organ-specific colonization) (Nguyen et al., Reference Nguyen2009). Either way, the categorizations are arbitrary since most metastasis-associated genes function in multiple processes involved in the continuum of the metastatic cascade.
Unfortunately, the nature of the metastatic cascade makes definitive identification (and classification) of metastasis-promoting molecules more technically challenging. Successful metastatic cells are likened to decathletes who must succeed in all events, though not necessarily the winner of every event. If a decathlete cannot complete one of the events, (s)he cannot win the decathlon. By analogy, if a metastatic cell cannot complete any step of the metastatic cascade, it cannot proceed to the next event and is therefore nonmetastatic. Thus, to test prometastatic effect, one must know that the cell in which that gene (product) is being tested is capable of completing the other steps of the metastatic cascade. Otherwise, the experimentalist will receive a false-negative result. In contrast, a metastasis suppressor needs to inhibit only one step to render a cell nonmetastatic. As a result, discovery of metastasis suppressors has outpaced discovery of promoters.
Identification of metastasis-associated genes
Identification of metastasis-associated genes has been accomplished using several different approaches, some functional in nature, while others are purely correlative in nature. Some methods used to identify metastasis regulatory genes include subtractive hybridization, microcell-mediated chromosome transfer, genetic selections, comparison of genetic polymorphisms (reviewed in Shevde and Welch, Reference Shevde and Welch2003; Hurst and Welch, Reference Hurst and Welch2011a; Bohl et al., Reference Bohl2014; Gelman, Reference Gelman2023; Khajehdehi, Reference Khajehdehi and Xu2025). New tools have built datasets of genes whose expression (mostly RNA) is correlated with metastatic efficiency (Ghandi et al., Reference Ghandi2019; Jin et al., Reference Jin2020). The approaches which have demonstrated function (i.e., a positive or negative effect on metastasis) are prioritized herein, while the correlations await functional validation. That said, a theme of this review is the fact that functional characterization is highly dependent on the context in which the molecule(s) or pathway(s) is tested. The tissue origin of the cancer cell, the genetic background of the animal (or human) from which the cancer cell is derived, and the immune status of the animal in which metastatic potential is measured are all parameters that impact results.
Those contexts determine how metastasis-associated genes are regulated. One can think of that regulation in terms of epigenetics. At a 30,000-foot view, epigenetics integrates individual genes with how they respond to different microenvironmental queues requiring coordinated expression of genes at every step (Fidler et al., Reference Fidler2007; Langley and Fidler, Reference Langley and Fidler2011; Sleeman et al., Reference Sleeman2011; Hurst and Welch, Reference Hurst and Welch2011b; Bragado et al., Reference Bragado2013; Obenauf and Massague, Reference Obenauf and Massague2015). The importance of a metastatic cell’s response to external signals is highlighted by the context-specific functionality of metastasis-associated genes. Likewise, responsiveness to different microenvironments helps explain one of the hallmarks of metastasis, plasticity (Welch and Hurst, Reference Welch and Hurst2019).
The epigenetic landscape was first characterized by Conrad Waddington in 1942 (Waddington, Reference Waddington1942). Epigenetic regulation is accomplished by chemical modifications to DNA and/or chromatin-associated histones (Rodriguez-Paredes and Esteller, Reference Rodriguez-Paredes and Esteller2011). Gene transcription is regulated by manipulation of the three-dimensional structure of DNA. Histone acetyltransferases (HAT) add acetyl moieties to lysine side chains of histones, while (de)acetylation is accomplished through histone deacetylases (HDAC). The former generally results in an open conformation of DNA (euchromatin), while the latter compacts DNA (heterochromatin) and represses transcription. HAT and HDAC complexes are large and are often linked with DNA methyltransferases and other protein or DNA-modifying enzymes. Over time the epigenetic landscape has been expanded to include ≥17 DNA modifications (Lowe et al., Reference Lowe2021), >150 RNA modifications (Chen et al., Reference Chen2016a; Shi et al., Reference Shi2019), >100 histone modifications (Zhao and Garcia, Reference Zhao and Garcia2015) (commonly called the ‘histone code’ (Jenuwein and Allis, Reference Jenuwein and Allis2001; Strahl and Allis, Reference Strahl and Allis2000)), >20 histone variants (Buschbeck and Hake, Reference Buschbeck and Hake2017; Martire and Banaszynski, Reference Martire and Banaszynski2020), a seemingly ever-growing number of noncoding RNA (Consortium, Reference Consortium2004; Anastasiadou et al., Reference Anastasiadou2018), and families of regulatory proteins categorized as writers, erasers, readers, chromatin remodelers, and histone chaperones (Huether et al., Reference Huether2014; Lawrence et al., Reference Lawrence2014; Leiserson et al., Reference Leiserson2015; Feinberg et al., Reference Feinberg2016).
Nm23/NME1
The first metastasis suppressor, nm23 (NME1, NDPK, nucleoside diphosphate kinase), was discovered by Patricia Steeg who used differential expression to isolate it from poorly metastatic K1735 melanoma cells (Steeg et al., Reference Steeg1988). When re-expressed in variants of those melanoma cells, NME1 suppressed metastasis. She and others identified similar correlations between NME1 expression and reduced metastasis and improved patient survival (Bevilacqua et al., Reference Bevilacqua1989; Florenes et al., Reference Florenes1992; Royds et al., Reference Royds1993; Tokunaga et al., Reference Tokunaga1993; Nakopoulou et al., Reference Nakopoulou1999; Goncharuk et al., Reference Goncharuk2004; Chen et al., Reference Chen2020b). High expression of NME1, however, is reported as a prognostic factor for unfavorable outcome in liver, lung, and renal TCGA (The Cancer Genome Atlas Program) data accessed via Human Protein Atlas (Uhlen et al., Reference Uhlen2010). Elevated expression of NME1 was observed in advanced thyroid carcinoma by stage (Zou et al., Reference Zou1993) and STAD lymph node metastases (Muta et al., Reference Muta1994). As with other metastasis suppressors, the effects are histotype specific (Hailat et al., Reference Hailat1991; Haut et al., Reference Haut1991; Niitsu et al., Reference Niitsu2001; Andolfo et al., Reference Andolfo2011).
NME1 was the first of a family of 10 molecules possessing NDPK catalytic activity. NDPK enzymes synthesize phospho-histidines using ATP as a donor (Hartsough et al., Reference Hartsough2002; Klumpp and Krieglstein, Reference Klumpp and Krieglstein2009; Khan and Steeg, Reference Khan and Steeg2018). The isoforms are found in multiple cellular pathways, vary in size and cellular localization. These pleiotropic properties have contributed to difficulties definitively determining the antimetastatic mechanism(s) of action.
Genetically engineered mouse models have been developed for NDPK family members (Arnaud-Dabernat et al., Reference Arnaud-Dabernat2003; Postel et al., Reference Postel2009; Di et al., Reference Di2010; Vogel et al., Reference Vogel2010). Whole-body knockout and mutant mice display isotype-specific different developmental defects, including mammary gland and neuronal development and maturation, immune system dysfunction, cytokine production, and perinatal lethality. Boissan et al. (Reference Boissan2005) crossed NME1-knockout mice with transgenic mice that develop hepatocellular carcinoma and observed increased lung metastases. Relatedly, orthologs of NME1 in Drosophila and Dictyostelium have illuminated the existence of subgroups of NDPK and differentiated the ability of human genes to complement genetic defects (reviewed in Matyasi et al., Reference Matyasi2020). Collectively, findings in those models have helped define NDPK family clusters and differential activities but have contributed relatively less to determining the mechanism of action responsible for NME1 metastasis suppression. Identification of binding partners has, however, helped refine roles for NME1 in various steps in the metastatic cascade.
Silencing NME1 increases intercellular adhesion, motility, and invasion through extracellular matrices concomitant with increased MMP secretion, RAC, MAPK, and PI3K/AKT signaling (Boissan et al., Reference Boissan2010). NME1 can bind Dbl-1 which, in turn, inactivates Cdc42 to inhibit motility (Murakami et al., Reference Murakami2008). NME1 binding to gelsolin, thereby disrupting its actin-severing capacity, also disrupts motility and invasion (Garzia et al., Reference Garzia2006; Marino et al., Reference Marino2013). NME1 can also inhibit invasion by disrupting TGFβ-induced EMT and invasion (Welch et al., Reference Welch1990a, Reference Welch1990b; Welch and Hurst, Reference Welch and Hurst2013; Zhao et al., Reference Zhao2013). And finally, NME1 binding to Dynamin (an atypical GTPase) was identified by binding of the Drosophila ortholog of NME1, AWD, to Shibire, the Dynamin ortholog. Dynamin is required for endocytic vesicle generation, and disruption of its function is thought to impede cellular responses to chemotactic factors (Boissan et al., Reference Boissan2014; Khan et al., Reference Khan2019; Prunier et al., Reference Prunier2023). The latter functions also imply that NME1 can regulate other functions associated with membrane engulfment and phagocytosis, like apoptosis.
Among the most intriguing interactions for NME1 is with kinase suppressor of Ras (KSR), a family of scaffolds which promote assembly of Ras/Raf/Mek/Erk complexes (Downward, Reference Downward1995; Kornfeld et al., Reference Kornfeld1995; Raabe and Rapp, Reference Raabe and Rapp2002). By those interactions, NME1 inhibits MAPK activity. Since the Ras/Raf/Mek/Erk pathway is a significant proliferation signal, the KSR and NME1 interactions are suspected to play roles in proliferative aspects of the metastatic cascade, such as colonization. Further evidence for this suspicion is the negative correlation between NME1 expression and lysophosphatidic acid receptor 1 expression, the latter of which shifts the p38:ERK ratio toward dormancy (Aguirre-Ghiso et al., Reference Aguirre-Ghiso2003).
Although mostly cytoplasmic, NME1 and NME2 are also found in the nucleus. Those findings suggest additional mechanisms of action. The Drosophila ortholog, Awd, exhibits exonuclease activity to supercoiled DNA, but not double-stranded or single-stranded DNA (Qian and Liu, Reference Qian and Liu2014). Both NME1 and NME2 (also known as PuF) can bind to single-stranded promoter regions to regulate transcription as coregulators. Both NME1 and NME2 interact with other transcription factors (Roymans et al., Reference Roymans2002). Both NME1 and NME2 are associated with estrogen receptor alpha (ERα) to differentially regulate estrogen-responsive genes (Curtis et al., Reference Curtis2007; Rayner et al., Reference Rayner2007, Reference Rayner2008). Similarly, interactions between NME1 and NME2 are implicated in the regulation of other metastasis-associated genes, such as COX2 through interactions with NFκB and CREB (Subramanian and Robertson, Reference Subramanian and Robertson2002). NME1 also binds GATA-1 and EBNA3C to bind SP1 complexes to regulate alpha V integrin (Choudhuri et al., Reference Choudhuri2006). Kaetzel and colleagues elaborate in more detail the transcriptional properties of NME1 and NME2 as well as their potential roles in DNA repair (Puts et al., Reference Puts2018).
Just as with the other metastasis suppressors, the numbers of mutations found in cancer cells or human cancers are vanishingly small. The diminished expression of metastasis suppressors appears to be mostly via epigenetic mechanisms, most of which are still not fully characterized but indeed occur by multiple mechanisms of regulation (Sethi and Kang, Reference Sethi and Kang2011; Bohl et al., Reference Bohl2014; Liu et al., Reference Liu2014c; Vivian et al., Reference Vivian2017, Reference Vivian2018). Such epigenetic regulation is key to the plasticity hallmark of metastasis (Welch and Hurst, Reference Welch and Hurst2019).
KISS1, CRSP3, and TXNIP
Discovery of the KISS1 metastasis suppressor began with the recognition that metastatic human melanomas frequently lost copies of the long arm of chromosome 6 (Trent et al., Reference Trent1989; Fountain et al., Reference Fountain1990; Trent, Reference Trent1991). Using microcell-mediated chromosome transfer, Welch et al. (Reference Welch1994) introduced a complete chromosome 6 into metastatic C8161 melanoma cells resulting in the hybrid cells being completely suppressed for metastasis. Then, by comparing parental C8161 and chromosome 6 cells using differential display, Lee identified several mRNA more highly expressed in the metastasis-suppressed hybrids (Lee et al., Reference Lee1996, Reference Lee1997). The first characterized gene was designated KISS1 in honor of its discovery in Hershey, Pennsylvania. When transfected into metastatic melanoma (Lee et al., Reference Lee1996; Nash et al., Reference Nash2007) and breast carcinoma cells (Lee and Welch, Reference Lee and Welch1997), KISS1 suppressed metastasis without blocking primary tumor formation. Subsequently, other laboratories transfected KISS1 into PRAD (Wang et al., Reference Wang2012a), HNSC (Jiffar et al., Reference Jiffar2011), PAAD (McNally et al., Reference McNally2010), and OVCA (Hori et al., Reference Hori2001) cancer cell lines with similar result, firmly establishing KISS1 as a bona fide metastasis suppressor. [Note: for space reasons, we will use the TCGA abbreviations to refer to specific tumor types for the remainder of this review. However, readers are cautioned that some cancer subtypes are not denoted in all cases.]
Correlative clinical studies have similarly demonstrated that KISS1 expression is inversely correlated with neoplastic aggressiveness, invasion, and/or metastasis (Yan and Boyd, Reference Yan and Boyd2000; Yan et al., Reference Yan2001; Zheng et al., Reference Zheng2010, Teng et al., Reference Teng2011, Reference Teng2013; Zhang et al., Reference Zhang2014a; Li et al., Reference Li2020). In other histotypes, however, higher KISS1 expression is correlated with enhanced aggressiveness and metastasis (Savvidis et al., Reference Savvidis2015; Guzman et al., Reference Guzman2018; Tian et al., Reference Tian2018; Kim et al., Reference Kim2022; Pupaki et al., Reference Pupaki2022; Shah et al., Reference Shah2025a). The reasons behind this discrepancy are not understood; yet, they highlight a key theme of genetic complexity and context dependency.
Defining how KISS1 suppresses metastasis has been challenging for a multitude of reasons. Unexpectedly, KISS1 maps to chromosome 1q32 (West et al., Reference West1998). Reasoning that the losses of genes on chromosome 6 were regulators of KISS1, Miele et al. used the microcell-mediated transfer of chromosome 6 structural mutants to identify putative regulatory loci (Goldberg et al., Reference Goldberg2003). Eventually, they identified a 40-cM region between 6q16.3-q23 as the principle regulatory region of KISS1 (Miele et al., Reference Miele2000). Those results were subsequently confirmed by (Shirasaki et al., Reference Shirasaki2001). To identify upstream regulator(s) of KISS1, microarrays comparing C8161 and the chromosome 6 hybrid variants were performed (Goldberg et al., Reference Goldberg2003). Those arrays identified another molecule encoded on chromosome 1, TXNIP/VDUP1 (thioredoxin binding protein 2 or vitamin D upregulated protein 1), that was found to also be more highly expressed when the region between 6q16.3-q23 was present. Further refinement of the region on chromosome 6 identified a transcription coactivator, MED23 (also known as ARC130, CRSP130, CRSP133, CRSP3, DRIP130, MRT18, SUR-2, mediator complex subunit 23), which increased expression of both KISS1 and TXNIP. Re-expression of TXNIP alone upregulated KISS1 expression and suppressed metastasis. These studies identified a complex, apparently coordinated pathway that regulates cancer metastasis. Still, however, the mechanism by which this pathway suppresses metastasis has yet to be worked out despite corroboration of roles of TXNIP in tumor/metastasis suppression in other tumor types (Ohta et al., Reference Ohta2005; Masaki et al., Reference Masaki2012; Morrison et al., Reference Morrison2014; Singh et al., Reference Singh2025).
Early experiments showed that KISS1 re-expression blocked metastasis in vivo but caused modest or no effects on metastasis-associated phenotypes in vitro (Lee et al., Reference Lee1996; Lee and Welch, Reference Lee and Welch1997). Adding to the difficulty was the inability to detect KISS1 protein. The latter issue was resolved when Ohtaki et al. (Reference Ohtaki2001) identified a C-terminal peptide derived from KISS1 as the ligand for an orphan G-protein-coupled receptor. The fragment was originally named metastin, but a more standardized nomenclature has been subsequently adopted.
Another emerging complication related to the assessment of KISS1 function in cancer metastasis is the existence of SNP (single-nucleotide polymorphism) that might impact function (Malik et al., Reference Malik2008; Pentheroudakis et al., Reference Pentheroudakis2010; Nazir et al., Reference Nazir2011; Ruiz et al., Reference Ruiz2012; Cruz Quevedo et al., Reference Cruz Quevedo2015; Quevedo et al., Reference Quevedo2015; Roberts et al., Reference Roberts2017; Antar et al., Reference Antar2020). Similar SNP are present in KISS1R (Teles et al., Reference Teles2010; Zhao et al., Reference Zhao2022; Toutoudaki et al., Reference Toutoudaki2023; Zhang et al., Reference Zhang2023b; Ruiz and Ramos, Reference Ruiz and Ramos2024; Zouaghi et al., Reference Zouaghi2024). Both polymorphisms are better characterized in noncancer contexts but need to be thoroughly assessed in cancer contexts as well.
Nascent KISS1 is a 145-amino acid secreted polypeptide which is processed extracellularly by the prohormone convertase furin (Harihar et al., Reference Harihar2014). The resulting fragments are referred to as kisspeptins (KP). Metastin, the predominant fragment, is a 54-amino acid polypeptide (aa68–aa121) now designated KP54 or KP-54. KP54 can be further cleaved into smaller (13, 14, or 10 amino acids) KP from the (typically amidated) C terminus (Kotani et al., Reference Kotani2001). Whenever the smaller KP retain the terminal RF–NH2 sequence, they can bind to and activate the KISS1 receptor (KISS1R, also known as AXOR12, GPR54, or hOT7T175) (Kotani et al., Reference Kotani2001; Muir et al., Reference Muir2001; Navarro and Tena-Sempere, Reference Navarro and Tena-Sempere2011). In several publications, the smallest KP, KP-10, has been shown to be sufficient for full KISS1R activation. Due to the ease of manufacturing of smaller peptides, KP10 has become the predominant reagent used to study KISS1/KISS1R functions (reviewed in Tsoutsouki et al., Reference Tsoutsouki2022; Shah et al., Reference Shah2025b). Some of those studies will be summarized next.
A critical characteristic of KISS1 is that it appears to function in a paracrine manner. If the signal peptide is removed, KISS1 is no longer able to suppress metastasis (Nash et al., Reference Nash2007). However, that observation is paradoxical since none of the cell lines in which KISS1 re-expression led to metastasis suppression express the KISS1R. As a result, the existence of another KISS1 receptor is predicted to exist (Beck and Welch, Reference Beck and Welch2010). Although such a receptor is possible since there are other KISS1 and KISS1R family members in mammals and other species (Kim et al., Reference Kim2012; Salmeri et al., Reference Salmeri2024; Stoynev and Kumanov, Reference Stoynev and Kumanov2025), no orthologs in humans have been described. The roles of those molecular siblings have not been well explored in the context of cancer but have been more extensively studied in relation to KISS1’s functions in the hypothalamic–pituitary–gonadal axis (reviewed in Millar and Babwah, Reference Millar and Babwah2015; Ruohonen et al., Reference Ruohonen2020; Tsoutsouki et al., Reference Tsoutsouki2022; Greenhill, Reference Greenhill2023; Stoynev and Kumanov, Reference Stoynev and Kumanov2025).
KISS1/KP54 activates a variety of signals, including phospholipase C (PLC), protein kinase C, intracellular Ca2+ mobilization, and mitogen-activated protein kinase (MAPK) and phosphatidylinositol 3-kinase (PI3K)/AKT pathways (Beck and Welch, Reference Beck and Welch2010). All of these signaling pathways have been implicated in multiple hallmarks of cancer and metastasis, making it challenging to dissect the specific roles for KISS1 in suppressing metastasis. Nonetheless, some nuggets of information have emerged from an unexpected finding in which KISS1-expressing cells appear to reverse a process termed aerobic glycolysis (Liu et al., Reference Liu2014b).
Otto Warburg was among the first to recognize the contributions of metabolic reprogramming in cancer (Warburg et al., Reference Warburg1927; Warburg, Reference Warburg1956a, Reference Warburg1956b). That property of cancer cells has been repeatedly observed and is now recognized among the so-called hallmarks of cancer (Hanahan and Weinberg, Reference Hanahan and Weinberg2000, Reference Hanahan and Weinberg2011). The mechanisms underlying Warburg’s observations of aerobic glycolysis have been the subject of countless studies (reviewed in Thompson, Reference Thompson2009; Vander Heiden et al., Reference Vander Heiden2009; Ward and Thompson, Reference Ward and Thompson2012; Vander Heiden and DeBerardinis, Reference Vander Heiden and DeBerardinis2017; Pavlova et al., Reference Pavlova2022; Altieri, Reference Altieri2023). Collectively, the data suggest that cancer cells are remarkably plastic with regard to their utilization of metabolic pathways. Efficiency of the generation of energy (i.e., ATP) is sometimes subjected to prioritized generation of macromolecules necessary for cell division. Likewise, neoplastic cells shift energy sources (Thompson, Reference Thompson2009; Vander Heiden et al., Reference Vander Heiden2009; Sullivan et al., Reference Sullivan2016).
Cells expressing KISS1 increased extracellular pH in vitro by decreasing aerobic glycolysis. Liu et al. (Reference Liu2014b) eventually showed that KISS1 alters mitochondrial respiration and biogenesis by regulating PPARγ coactivator-1 (PGC1α). PGC1α regulates metabolism by increasing mitochondrial oxidative phosphorylation by inducing expression of genes in the citric acid cycle and electron transport chain (Ventura-Clapier et al., Reference Ventura-Clapier2008) via induction of the transcription factors NRFs and mtTFA (Girnun, Reference Girnun2012). Multiple other studies show that PGC1α is less expressed in neoplastic cells compared to matching normal tissues (Lehman et al., Reference Lehman2000; Feilchenfeldt et al., Reference Feilchenfeldt2004; Watkins et al., Reference Watkins2004; Zhang et al., Reference Zhang2007; D’Errico et al., Reference D’Errico2011; Zuo et al., Reference Zuo2021; Zhao et al., Reference Zhao2023). However, there are also studies showing the opposite correlation (LeBleu et al., Reference LeBleu2014; Ganesan et al., Reference Ganesan2023), raising questions about the precise role(s) of PGC1α in cancer (Mastropasqua et al., Reference Mastropasqua2018). Notably, PGC1α also regulates anabolic metabolism. KISS1 re-expression also changed expression of genes involved in β oxidation (PPARα downregulation) and lipogenesis (FASN, ACC1 upregulation). KISS1-expressing cells also have lower V-ATPase expression, resulting in an attenuated v-ATPase activity (which is required for autophagy) (Manley et al., Reference Manley2017). KISS1-expressing cells exhibit reduced autophagy, but the context for autophagic differential regulation was not studied. Nonetheless and collectively, multiple findings establish links between KISS1, mitochondrial signaling, metabolism, and metastasis. However, those links are confused by the findings in cells not expressing the KISS1R.
A key clue regarding KISS1 mechanism of action was when Harms and Goldberg observed that KISS1-expressing cells were found to complete the entire metastatic cascade, except growth at secondary sites (Goldberg et al., Reference Goldberg1999). This in vivo result was consistent with previous in vitro experiments showing essentially no inhibition of growth, adhesion, invasion, etc. Interestingly, viable KISS1-expressing cells could be isolated from the lungs of mice weeks (and months) following the timeframe of when nonexpressing cells killed the mice. Imaging the lungs showed that KISS1-expressing cells had remained dormant at ectopic sites but would grow when implanted at an orthotopic site. So, from a functional perspective, a mechanism of action for KISS1 has been reported. However, the molecular basis for location specific growth regulation remains a mystery.
Although a bit tangential from the theme of this review, we note that KISS1 has been implicated in other diseases, most notably hypogonadism (Seminara et al., Reference Seminara2003; Sam and Dhillo, Reference Sam and Dhillo2010; Babwah et al., Reference Babwah2015; Roa et al., Reference Roa2022). In that context, KISS1 is a neurotransmitter in the hypothalamic–pituitary–gonadal axis via the KISS1R. KISS1/KISS1R are also implicated in studies of polycystic ovary disease (Chen et al., Reference Chen2010; Lee et al., Reference Lee2010; Tang et al., Reference Tang2019; Araujo et al., Reference Araujo2020; Daghestani et al., Reference Daghestani2020; Aasif et al., Reference Aasif2023; Zheng et al., Reference Zheng2026), atherosclerosis (Watanabe and Sato, Reference Watanabe and Sato2020), myasthenia gravis (Lu et al., Reference Lu2025a), diabetes (Sliwowska et al., Reference Sliwowska2024), obesity (Stephen et al., Reference Stephen2024), and rheumatic arthritis (Wang et al., Reference Wang2021a). Recent data suggest that KISS1 may help distinguish responders versus nonresponders to immunotherapies (Wu et al., Reference Wu2026). Perhaps insights from those diseases will provide additional clues regarding KISS1 function in cancer. Nonetheless, aptamers and related treatments targeting KISS1 and KISS1R have been introduced into the clinic and are showing efficacy (MacLean et al., Reference MacLean2014; Singh et al., Reference Singh2022; Tsoutsouki et al., Reference Tsoutsouki2022; Shah et al., Reference Shah2025b; Velmurugan et al., Reference Velmurugan2025; Kong et al., Reference Kong2026). While they have not been used in the context of cancer to the best of our knowledge, those treatments support the potential for KISS1-based therapies to be safely introduced in the future. Furthermore, they support the notion that treatments based on metastasis suppressors are possible (Gelman, Reference Gelman2023).
The implication that KISS1 could be used in cancer treatment is supported by recent observations that its expression is an immunotherapy biomarker (Wu et al., Reference Wu2026). Likewise, the observation that KISS1 could induce dormancy of tumor cells at ectopic sites suggests that a dormancy-based treatment, in which cancer is not necessarily cured, but is controlled, has become increasingly possible. In fact, recently reported results from Chodosh et al. demonstrate that it may be possible to identify dormant disseminated tumor cells and regulate their growth status (Dalla et al., Reference Dalla2023; Sreekumar et al., Reference Sreekumar2024; DeMichele et al., Reference DeMichele2025).
Epigenetic regulation of metastasis
BRMS1
BRMS1 (BReast cancer Metastasis Suppressor 1) was discovered using differential display by Seraj et al. (Reference Seraj2000c) by comparing metastatic MDA-MB-435 breast carcinoma cells with metastasis-suppressed microcell hybrids containing an introduced chromosome 11 (Phillips et al., Reference Phillips1996). BRMS1 maps to chromosome 11q13.1-13.2 (Samant et al., Reference Samant2000; Seraj et al., Reference Seraj2000b; Samant and Welch, Reference Samant, Welch and Schwab2002; Zimmermann and Welch, Reference Zimmermann and Welch2020), a region often lost in late-stage breast cancers (Welch and Wei, Reference Welch and Wei1998). When BRMS1 was transfected into MDA-MB-435 cells, metastasis was suppressed without significant changes in orthotopic tumor incidence. Subsequently, multiple laboratories have demonstrated BRMS1-mediated metastasis suppression in a variety of tumor types, including SKCM, BRCA, OV, READ, CHOL, STAD, and nonsmall cell lung carcinomas (NSCLC) (Seraj et al., Reference Seraj2000a; Shevde et al., Reference Shevde2002; Zhang et al., Reference Zhang2006b, Reference Zhang2014b; Hedley et al., Reference Hedley2008a; Smith et al., Reference Smith2009; Nagji et al., Reference Nagji2010; Ponnusamy et al., Reference Ponnusamy2012; Guo et al., Reference Guo2015; Kong et al., Reference Kong2015). Similarly, genetic mapping in mice shows that metastatic potential is linked to allelic variations of syntenic regions encoding Brms1 (Devilee et al., Reference Devilee1991; Hampton et al., Reference Hampton1994a, Reference Hampton1994b, Reference Hampton1996), but Brms1 does not fulfill genetic criteria as a metastasis modifier locus in the latter studies. Nonetheless, ubiquitous transgenic overexpression of Brms1 in F1 generation MMTV-PyMT crosses significantly reduced lung metastases while not affecting primary tumor development (Cook et al., Reference Cook2012). Surprisingly, selective expression of Brms1 in mammary tissue under control of MMTV did not block lung metastasis. Knockout of Brms1 was embryonically lethal.
Higher BRMS1 expression is correlated with decreased metastasis, motility, invasion, resistance to anoikis, ultrastructure, and cytoskeletal organization (reviewed in Welch, Reference Welch2016). Collectively, all those data suggest that lower BRMS1 expression may have clinical prognostic utility. Studies in histologic samples are limited, but some recent data suggest that BRMS1 expression may predict higher survival in patients with osteosarcoma (Li et al., Reference Li2018b). More extensive studies will be required to establish whether BRMS1 is a useful biomarker. While most clinical data corroborate its functional role as a metastasis suppressor, some studies show that BRMS1 expression does not change (Kelly et al., Reference Kelly2005) or expression directly correlates with malignancy (Hicks et al., Reference Hicks2006; Lombardi et al., Reference Lombardi2006; Cui et al., Reference Cui2012). Lack of correlation could be for several reasons, including that RNA and protein levels for BRMS1 do not directly correlate (Hurst et al., Reference Hurst2008, Reference Hurst2009c, Reference Hurst2013). Also, most of the transcriptomic studies do not adequately account for contributions of stromal cells present within the samples. Unfortunately, the quality of reagents, particularly antibodies, has slowed work to understand BRMS1 expression and function. Of note, some commercial antibodies sold as recognizing BRMS1 actually recognize BRMS1L, a related molecule. We, in collaboration with MaryAnn Accavitti-Loper, generated and validated two monoclonal antibodies (IgG isotype (3a1.21) that recognizes the N-terminal region of BRMS1 and IgM isotype (1a5.7) that recognizes the C-terminal region) detect and immunoprecipitate BRMS1 (Hurst et al., Reference Hurst2006, Reference Hurst2008, Reference Hurst2009c, Reference Hurst2009d, Reference Hurst2013; Welch, Reference Welch2016). Using PCR-based methods, Lianidou et al. have shown that lower BRMS1 in circulating tumor cells or cell-free DNA in liquid biopsy specimens are associated with improved outcomes (Ntzifa et al., Reference Ntzifa2021, Reference Ntzifa2024). In related studies, they have shown that methylation status of BRMS1 DNA is also a clinically useful biomarker (Chimonidou et al., Reference Chimonidou2011, Reference Chimonidou2013a, Reference Chimonidou2013b, Reference Chimonidou2017; Ntzifa et al., Reference Ntzifa2021, Reference Ntzifa2024). Therefore, BRMS1 expression and regulation have potential to be prognostic biomarkers, but the realization of clinical utility will require fully validated reagents and a deeper understanding of BRMS1 mechanism of action.
Aside from confusion related to reagents, ascribing a particular mechanism of action for BRMS1 has been challenging because of its ability to partially inhibit multiple steps in the metastatic cascade (Welch et al. Reference Welch2016). Depending on the assay and cell lines used, BRMS1 can inhibit invasion (Shevde et al., Reference Shevde2002; Zhang et al., Reference Zhang2006a; Smith et al., Reference Smith2009), migration (Zhang et al., Reference Zhang2006a; Smith et al., Reference Smith2009), adhesion (Zhang et al., Reference Zhang2006a; Phadke et al., Reference Phadke2008; Hedley et al., Reference Hedley2008a; Khotskaya et al., Reference Khotskaya2014), colonization (Phadke et al., Reference Phadke2008; Hedley et al., Reference Hedley2008a, Reference Hedley2008b), and promote apoptosis (Phadke et al., Reference Phadke2008; Hedley et al., Reference Hedley2008a, Reference Hedley2008b; You et al., Reference You2015). All of these steps involve interactions with the environment, suggesting that a common mechanism would involve response(s) to external signals. The first reported phenotype associated with tumor–microenvironment interaction by BRMS1 was restoration of homotypic GJIC (gap junctional intercellular communication) (Saunders et al., Reference Saunders2000). Similarly, BRMS1 was shown to restore heterotypic GJIC between breast carcinoma cells and osteoblasts (Kapoor et al., Reference Kapoor2004).
Other signaling pathways have been implicated and demonstrate a much more complex relationship with BRMS1 expression. Harihar and colleagues were the first to show that phosphoinositide signaling pathways are downregulated by BRMS1. It does so by selectively downregulating phosphoinositol 4-phosphate 5-kinase expression. This downregulation reduces phosphatidylinositol-4,5-bisphosphate (PtdIns(4,5)P2) without changing levels of PtdIns(4)P and PtdIns(3)P (DeWald et al., Reference DeWald2005; Vaidya et al., Reference Vaidya2008). PI3K signaling is a key molecule associated with neoplastic transformation and metastasis (Thorpe et al., Reference Thorpe2015; Hoxhaj and Manning, Reference Hoxhaj and Manning2020; Llorente et al., Reference Llorente2025). However, other molecules implicated in these studies play key roles in lipid raft and primary cilia formation as well as signaling through these structures.
Vaidya et al. extended those data, demonstrating that BRMS1 selectively altered signaling in response to different growth stimulatory or inhibitory molecules that can be found in different tissues. Briefly, cells expressing BRMS1 respond differently to epidermal growth factor (EGF), hepatocyte growth factor (HGF), or platelet-derived growth factor (PDGF). The responses varied by whether BRMS1 changed phosphoinositide signaling, whether receptor expression was reduced, or whether other signaling was altered (Vaidya et al., Reference Vaidya2008). Of note, Bodenstine et al. (Reference Bodenstine2010) showed that the GJIC changes were more closely associated with changes in protein kinase A (PKA) activity.
The variety of mechanisms involved led to a deeper analysis of BRMS1 functions through interacting proteins. BRMS1 is the founding member of a family molecules associated with transcriptional regulation and epigenetics. The family is defined by a conserved region known as the Sds3-like domain, but whether the Sds3 domain is required for BRMS1 function is still uncertain. Critically, BRMS1 itself does not function as a transcription factor. The BRMS1 family includes BRMS1, BRMS1-like (BRMS1L), and SUDS3 (suppressor of defective silencing 3, also known as SAP45 or mSds3) and all three molecules interact with HDAC1. BRMS1 amino acid sequence is 23% identical and 49% similar to SUDS3 and is 57% identical and 79% similar to BRMS1L. BRMS1L (p40) is a component of SIN3–HDAC (switch-independent 3-histone deacetylase) complexes and has been associated with other epigenetic interactomes.
Most of the understanding BRMS1 mechanism of action comes from studies of homologous molecules in other species. Co-immunoprecipitation shows that SUDS3 is integral to formation of orthologous SIN3–HDAC chromatin remodeling complexes in multiple species (yeast, murine, human). The yeast ortholog of SUDS3 promotes Sin3 complex integrity and is essential for histone deacetylase (HDAC) activity. In mammalian cells, SUDS3 is essential for embryonic development and has been implicated in some cancers. However, expression of SUDS3 in metastatic breast cancer cell lines does not suppress metastasis (Silveira et al., Reference Silveira2009), indicating that family members have distinct functions and are not functionally complementary. To elucidate BRMS1’s function, it is also important to understand SIN3 complex components and some of their functions. SIN3A and SIN3B are not functionally redundant. SIN3A suppresses metastasis, while SIN3B promotes metastasis (Lewis et al., Reference Lewis2016). SIN3A maintains cellular pluripotency, while SIN3B does not (Saunders et al., Reference Saunders2017). Knockout of SIN3A is early embryonic lethal, while SIN3B lethality is later (Cowley et al., Reference Cowley2005; David et al., Reference David2008). BRMS1 appears to interact with SIN3A (Zimmermann et al., Reference Zimmermann2021) and SIN3B (Le Guezennec et al., Reference Le Guezennec2006) and has an E3 ubiquitin ligase function on the histone acetyl transferase p300 (Liu et al., Reference Liu2013).
BRMS1 protein is a 246 amino acid polypeptide and is predicted to be 28.5 kDa, though BRMS1 migrates closer to 35 kDa on SDS-PAGE. This may be due to charges in the glutamic acid-rich N-terminal region (aa1–50). BRMS1 encodes two coiled-coil regions (aa51–81 and aa147–180) and two predicted nuclear localization sequences (NLS, aa198–205 and aa239–245). The proximal NLS, but not the distal NLS, is required for localization to the nucleus (Hurst et al., Reference Hurst2013). However, the so-called second NLS is required for metastasis suppression (Hurst et al., Reference Hurst2013).
The N terminus of BRMS1 has been crystalized (Rivera et al., Reference Rivera2010; Spinola-Amilibia et al., Reference Spinola-Amilibia2011) and its three-dimensional structure determined. However, aside from aa51–98, the structure of full-length BRMS1 has not yet been solved nor has it been crystallized. But a more informative observation was made during those studies – the C terminus of the BRMS1 protein is critical for metastatic suppression (Hurst et al., Reference Hurst2013). Of note, a serine residue immediately upstream of the critical metastasis suppressor domain was shown to be phosphorylated by cyclin-dependent kinase 2 (CDK2) (Roesley et al., Reference Roesley2016). Mutational analysis of S237 (BRMS1S237D (phosphorylation-mimic); BRMS1S237A (unable to be phosphorylated); BRMS11–229 (deletes critical C-terminal domain); BRMS1230–246 (C-terminal domain with S237 in the center)) altered BRMS1 interactions with approximately 1200 proteins (Zimmermann et al., Reference Zimmermann2021). Regardless of whether S237 was mutated to aspartic acid or alanine, BRMS1 protein stability was uncompromised. Likewise, the phosphorylation state (or phospho-mimic state) of BRMS1 did cause altered expression of presumptive downstream mediators of BRMS1 (Zimmermann et al., Reference Zimmermann2021). Paradoxically, impact on in vitro assay results were not consistent with metastasis inhibitory effects of BRMS1. Experimental metastasis assays with MDA-MB-231 cells expressing BRMS1WT, S237A, or S237D showed that BRMS1WT and S237D were significantly lower compared to vector control cells. S237A metastasis was not. In fact, S237D had significantly fewer lung metastases than BRMS1WT or S237A. Thus, the inability of BRMS1 to be phosphorylated at S237 does impact metastasis suppressor function. Moreover, the greater ability of S237D to suppress metastasis suggests that BRMS1 phosphorylation status is critically important.
The story of BRMS1 functionality and interaction is further complicated by differential associations with other members of the SIN3–HDAC complexes, when comparing SIN3A complexes in untransformed MCF10A versus metastatic MDA-MB-231 breast carcinoma cells. Of all the interactions, only BRMS1 did not interact with SIN3A in metastatic cells while still interacting with BRMS1L, suggesting that interactions with BRMS1 and BRMS1L differ depending on the transformation state of the cells (Zimmermann et al., Reference Zimmermann2021). Deeper analysis suggests a complex relationship between BRMS1, BRMS1L, SIN3A, and SIN3B interactions; however, how those interactions lead to different epigenetic regulatory pathways remains to be determined. BRMS1 direct interactions with ARID4A or SUDS3 are not essential for metastasis suppression (Hurst et al., Reference Hurst2008). BRMS1 has two coiled-coil regions (Hurst and Welch, Reference Hurst and Welch2011b) and other protein domains that appear to be responsible for individual protein interactions (Seraj et al., Reference Seraj2000c; Hurst et al., Reference Hurst2008, Reference Hurst2009d, Reference Hurst2013). Mutational analysis has unraveled BRMS1 interactions that presumptively regulate metastasis.
BRMS1-interacting proteins have been identified by yeast two-hybrid (Y2H), co-immunoprecipitation (coIP), fluorescence resonance energy transfer (FRET), and mass spectroscopy. In addition to SIN3–HDAC complexes, BRMS1 interactors include chaperone proteins HSP90, HSP70, and MRJ (Hurst et al., Reference Hurst2006), subcellular localization/protein transport by sorting nexin 6 (SNX6) (Rivera et al., Reference Rivera2010) and karyopherin α5 (KPNA5) (Hurst et al., Reference Hurst2006), transcription factors N-myc interactor (NMI) and TAFII250 (Hurst et al., Reference Hurst2006), stress fiber smoothelin (SMTN) (Hurst et al., Reference Hurst2006), chromatin complex SWI/SNF member BAF57 (Hurst et al., Reference Hurst2006), class II HDACs, HDAC4, 5, and 6 (Hurst et al., Reference Hurst2006), AT-rich interacting domain 4A (ARID4A, previously known as retinoblastoma binding protein 1, RBP1 or RBBP1) and SUDS3 (Meehan et al., Reference Meehan2004), ING1 (Nikolaev et al., Reference Nikolaev2004; Doyon et al., Reference Doyon2006), ING2 (Doyon et al., Reference Doyon2006; Smith et al., Reference Smith2010), and SAP25 (Shiio et al., Reference Shiio2006).
As with other metastasis suppressors, BRMS1 point mutations are not commonly found in metastatic cells. Diminished expression can occur by loss of heterozygosity, as described earlier. But differential regulation has been demonstrated by multiple mechanisms including promoter methylation (Metge et al., Reference Metge2008, Reference Metge2010; Nagji et al., Reference Nagji2010; Chimonidou et al., Reference Chimonidou2011, Reference Chimonidou2013a, Reference Chimonidou2013b, Reference Chimonidou2017; Yang et al., Reference Yang2011; Balgkouranidou et al., Reference Balgkouranidou2014; Kong et al., Reference Kong2015; Wang et al., Reference Wang2015; Xing et al., Reference Xing2015; Panagopoulou et al., Reference Panagopoulou2017; Xia et al., Reference Xia2017; Ntzifa et al., Reference Ntzifa2021, Reference Ntzifa2024), noncoding RNA regulation of transcription or translation (Sun et al., Reference Sun2017; Cao et al., Reference Cao2018; Li et al., Reference Li2018b; Farokhimanesh et al., Reference Farokhimanesh2021; Gao et al., Reference Gao2022), protein stability (Liu et al., Reference Liu2013; Dou et al., Reference Dou2019; Zhou et al., Reference Zhou2020), and alternative splicing (Chakrabarti et al., Reference Chakrabarti2003; Hurst et al., Reference Hurst2009c; Wu et al., Reference Wu2013).
The complex saga of BRMS1 highlights difficulties associated with understanding the regulation of metastasis. Even relatively well-characterized epigenetic complexes and pathways, like SIN3–HDAC, are not robustly understood. The megadalton size and mix-and-match composition of the complexes in different cells (and probably under different contexts of those same cells) means that dissecting mechanisms of action will require more cell models, more in vitro models mimicking steps of the metastatic cascade which incorporate all of the relevant cell types and matrices of various tumor microenvironments, and more in vivo assays that recapitulate all of (or most of) the metastatic cascade. Even those considerations do not yet take into account identifying the kinases (if there are others besides cdk2) and phosphatases regulating BRMS1 phosphorylation status or the post-translational modifications of BRMS1 interactors.
LSD1/KDM1A
Histone lysine demethylase 1 (LSD1), encoded by the KDM1A gene, was first discovered in 2004 and its discovery contributed to demonstrating histone methylation as a dynamic, not static, process (Shi et al., Reference Shi2004, Reference Shi2005). LSD1 is a positive regulator of EMT in gastric and breast cancers (Feng et al., Reference Feng2016; Zhang et al., Reference Zhang2019). It was first shown that LSD1 regulates the E-cadherin promoter and represses expression by demethylating H3K4me2 in gastric cancer (Zhang et al., Reference Zhang2019). The mechanism of regulation was defined by demonstrating that LSD1 phosphorylation at S112 by PKC is imperative for its ability to demethylate the E-cadherin promoter as a contributor to EMT (Feng et al., Reference Feng2016). Mutation to a phosphomimetic S112D enhanced metastasis of MDA-MB-231 cells, while phosphodead S112A exerted no effect. This observation was further demonstrated in an ovarian cancer model, where LSD1 overexpression induced expression of EMT markers N-cadherin, vimentin, and MMP2 to enhance migratory phenotypes (Feng et al., Reference Feng2016; Li et al., Reference Li2016d, Reference Li2025b). LSD1 enhanced transcription of RNF135 which promoted lung cancer metastasis to the brain in vivo by permitting cancer stem cell self-renewal (Qu et al., Reference Qu2024). Another target of LSD1 is SEPT6, which promotes the SMAD pathway in NSCLC cells to drive invasion in vitro (Hong et al., Reference Hong2022). LSD1 can coregulate ERα in gastric cancers to promote gene expression of the migratory proteins TSPAN4 and NDST1 (Kang et al., Reference Kang2025). LSD1 also interacts with RBBP7 to promote expression of genes involved with stemness in breast cancer: SOX9, SOX2, OCT4, and CCND1 (Xi et al., Reference Xi2025). Recently, it was shown that LSD1 regulates immune evasion in metastatic lung cancer via upregulating expression of PD-L1 (He et al., Reference He2023a).
While LSD1 promotes tumorigenicity and metastasis, there is also evidence of it acting as a metastasis suppressor. LSD1 expression negatively correlates with TGFβ expression and inhibits invasion and metastasis of breast cancer (Wang et al., Reference Wang2009). LSD1 suppresses migration and invasion of androgen-independent prostate cancer via reduced expression of the focal adhesion adaptor protein, paxillin, and G-protein-coupled receptor, LPAR6 (Ketscher et al., Reference Ketscher2014). In turn, LPAR6 overexpression enhances spontaneous metastases from orthotopically implanted tumors. Another study showed that LSD1 loss enhances MMTV-PyMT spontaneous lung metastases due to the enhanced E3-ubiquitin ligase, TRIM37, and transcription factor, ELF3 expression (Hu et al., Reference Hu2019). The metastasis suppressive effects are not all cancer cell autonomous. LSD1 regulates exosome contents from tumor cells that travel to premetastatic niches through molecular alterations (Liu et al., Reference Liu2024b; Yao et al., Reference Yao2024). Exosomes from wild-type and LSD1-knockdown MCF7 breast cancer cells were introduced to mice prior to tail vein injection of wild-type cells which developed more bone metastases (Liu et al., Reference Liu2024a). The authors found that LSD1 abrogation reduced expression of hnRNPA2B1 via reduced H3K9me2 demethylation to alter microRNA secretion and premetastatic niche remodeling. Similarly, exosomes from MCF7 cells which had lower LSD1 expression impaired endothelial barriers at lung, liver, and brain (Yao et al., Reference Yao2024).
An additional signaling component downregulated by LSD1 is PIK3IP1, an inhibitor of PI3K/AKT. As a result, downregulation or inhibition of LSD1 enhances expression of PIK3IP1 with concomitant reduction in PI3K/AKT activation in TNBC cells and a corresponding inhibition of metastasis (Li et al., Reference Li2025b). Multiple LSD1 inhibitors have been enrolled in a variety of clinical trials (Noce et al., Reference Noce2023). Domatinostat® is a dual inhibitor of HDAC and LSD1 and has been tested in clinical trials of melanoma and Merkel cell carcinoma (NCT04133948, NCT04393753, NCT03278665). Domatinostat® was effective at reducing expression of multiple genes associated with migration and reduced outgrowth of 4T1 breast cancer cells in lungs of syngeneic mice (Zylla et al., Reference Zylla2022).
LSD1 also interacts with BRMS1 to form a complex regulating expression of multiple genes associated with cancer metastasis (Qiu et al., Reference Qiu2018). Perhaps this provides evidence of a context that may be required to demonstrate tumor suppressive actions of LSD1, where BRMS1 may be necessary to push it in the antimetastatic direction. Since both molecules regulate epigenetics, their respective activities may be determined by site-specific or context-specific complex formation.
Heterochromatin-associated protein 1 (HP1)
HP1 is another example of epigenetics as key to tumor and metastasis regulation. Readers are referred to several excellent reviews (Dialynas et al., Reference Dialynas2008; Vad-Nielsen and Nielsen, Reference Vad-Nielsen and Nielsen2015; Jeon et al., Reference Jeon2022). HP1 was first discovered in Drosophila as a nonhistone chromosomal protein, but several paralogs have been identified in multiple species. In humans, HP1 proteins exist in multiple isoforms and splice variants (HP1α/HP1β/sHP1γ) which vary in size from 173 to 240 amino acids. HP1α (Norwood et al., Reference Norwood2004; Lieberthal et al., Reference Lieberthal2009; Lomberk et al., Reference Lomberk2012; Chen et al., Reference Chen2015; Pongas et al., Reference Pongas2017; Dutta et al., Reference Dutta2020) and HP1β (Nishimura et al., Reference Nishimura2006; Tell et al., Reference Tell2011; Yi et al., Reference Yi2014; Yang et al., Reference Yang2015) predominantly, but not always, act as metastasis suppressors by maintaining heterochromatin and repressing invasion-associated genes such as various MMP in several cancers; HP1γ more frequently supports tumor progression, proliferation, and migration in several solid tumors (Takanashi et al., Reference Takanashi2009; Slezak et al., Reference Slezak2013; Yi et al., Reference Yi2014; Alam et al., Reference Alam2018; Chen et al., Reference Chen2018b; Eriksson et al., Reference Eriksson2018; Okamoto et al., Reference Okamoto2019; Zhao et al., Reference Zhao2019b). However, HP1 effects are not limited to solid tumors. Terminally differentiated leukocytes exhibit greatly reduced HP1α/β/γ levels and increased MNEI, whereas ‘blast-crisis’ leukemia cells show elevated HP1 levels, reflecting distinct heterochromatin states. Elevated HP1 in less differentiated leukemia cells likely supports survival and proliferation, while its repression is associated with terminal differentiation and loss of malignant potential (Popova et al., Reference Popova2006). There are context-dependent roles where HP1 depletion can not only increase genomic instability and apoptosis but also derepress proinvasive transcriptional programs, emphasizing isoform- and tissue-specific effects on apoptotic evasion and metastasis (Dialynas et al., Reference Dialynas2008; Vad-Nielsen and Nielsen, Reference Vad-Nielsen and Nielsen2015).
As highlighted by other molecules, HP1 effects are tissue and interactor specific. Some of the effects are mediated through metabolism (Okamoto et al., Reference Okamoto2019), DNA damage, and/or other stress responses (Lee et al., Reference Lee2013). One mechanism of regulation of HP1α is via the epigenetic regulator BRD4. BRD4 mediates DNA damage response while repressing HP1α expression (Pongas et al., Reference Pongas2017). siRNA treatment against BRD4 increased HP1α levels and sensitized cells to CHK1 inhibition.
Importantly, as with most or all epigenetic mechanisms, the effects are specific in which transcriptional control is affected (i.e., not genome-wide). However, the epigenetic modifiers can regulate cassettes of genes or operons. These effects are determined by interacting protein complexes analogous to what was described for BRMS1. Some examples include: CRL4B, a ubiquitin ligase, forms a complex with SUV39H1, HP1 (all isoforms), and DNMT3A to establish H3K9 and DNA methylation at tumor suppressor loci, leading to stable silencing. This epigenetic repression is suspected to support cancer cell survival, proliferation, and potentially EMT/invasion, as multiple silenced targets involved in cell adhesion and apoptosis pathways (Yang et al., Reference Yang2015). HP1γ is required for Myc to regulate miR-451a, an inhibitor of migration in PRAD (Babapoor et al., Reference Babapoor2014), thereby promoting cell proliferation and progression. Inhibition of Myc-induced apoptosis was rescued by HP1γ introduction, indicating a protumor, potentially prometastatic role for HP1γ (Chang et al., Reference Chang2018). All HP1 isoforms were shown to modulate androgen receptor (AR) transcriptional activity, thereby affecting proliferation and survival. Differential regulation of AR by HP1α/β/γ may influence progression to more aggressive, potentially metastatic disease states by altering expression of AR target genes (Itsumi et al., Reference Itsumi2013).
Metastasis-associated protein 1 (MTA-1)
MTA-1 was first identified in a panel of rat mammary adenocarcinomas by comparing expression in subclones of low and high metastatic potential (Toh et al., Reference Toh1994; Toh and Nicolson, Reference Toh and Nicolson2009). Transfection resulted in increased metastasis in multiple cell lines of different origin. Silencing MTA-1 in prostate cancer cells reduced bone metastasis formation in intracardiac xenografts and impaired tumor growth, indicating its role in supporting metastatic colonization and invasiveness (Kumar et al., Reference Kumar2003). Moreover, CRISPR/Cas9-mediated knockout of MTA-1 in human NSCLC cells significantly reduced lung metastatic nodules in nude mice, indicating that MTA-1 promotes colonization and outgrowth at distant sites (Wang et al., Reference Wang2022). The proposed mechanism by which MTA-1 promotes metastasis depends on the contexts of which pathway is engaged, tropisms for different tissues, and which step in the metastatic cascade is affected (Steeg and Zhou, Reference Steeg and Zhou1998; Cao et al., Reference Cao2017a, Reference Cao2017b; Zhang et al., Reference Zhang2018, Reference Zhang2021b, Reference Zhang2024; Zhou et al., Reference Zhou2026a).
MTA-1 was the founding member of a family of metastasis-associated molecules (Harris and Best, Reference Harris and Best1988; Li et al., Reference Li2009, Reference Li2010, Reference Li2012a) which frequently function as prometastatic transcriptional coregulators and chromatin modifiers with numerous downstream interactors (Matsuoka et al., Reference Matsuoka1995, Reference Matsuoka1996, Reference Matsuoka2001; Moseley and Nurse, Reference Moseley and Nurse2010; Yan et al., Reference Yan2012a, Reference Yan2023; Sen et al., Reference Sen2014). Cellular localization is critical to MTA-1 function (Nawa et al., Reference Nawa2000; Talukder et al., Reference Talukder2000; Talukder et al., Reference Talukder2003). Taken together, the prometastatic functions MTA-1 and related molecules are the result of complex epigenetic regulation of multiple steps in the metastatic cascade. Nonetheless, some investigators are exploring MTA-1 as a therapeutic target (Pulaganti et al., Reference Pulaganti2025).
Formin-binding protein 1 (FNBP1)
Formin-binding protein 1 (FNBP1, also known as FBP17) was first described in an acute myelogenous leukemia yeast two-hybrid screen as altered due to fusion with MLL (Kmt2a, a histone methyltransferase) which interacts with the endosomal transport protein SNX2 (Fuchs et al., Reference Fuchs2001). FNBP1 also bound tankyrase, which plays roles in both telomere maintenance and cytoskeletal structure in its mutated fusion form and endogenous, wild-type form (Fuchs et al., Reference Fuchs2003). FNBP1 is also involved in tubule formation through an interaction with dynamin (Kamioka et al., Reference Kamioka2004). Collectively, FNBP1 is involved in multiple processes that could alter metastatic actions of cells by affecting membrane tension and motility (Zegers and Friedl, Reference Zegers and Friedl2015).
Invasive BRCA exhibits high expression of FNBP1 which drives poor differentiation and invadopodia structural maintenance and generation (Suman et al., Reference Suman2018). Overexpression of FNBP1 in STAD cells induced actin movement, and silencing of FNBP1 inhibited invasiveness in vitro (Yoon et al., Reference Yoon2021). Likewise, FNBP1 is correlated with invasiveness of bladder cancer (Alessandri et al., Reference Alessandri1999).
The mechanism of FNBP1 as a metastasis promoter was largely undefined until recently. FNBP1 is post-transcriptionally regulated by insulin-like growth factor 2 mRNA-binding protein 2 (IGF2BP2) to stabilize the transcript in GBM (Zhang et al., Reference Zhang2025a). Translated FNBP1 then interacts with LASP1 to promote SMAD3-driven glycolysis, providing ATP for motility. FNBP1 also interacts with FAK to promote cell adhesion, migration, and AKT-mediated cell survival in HeLa cells (Zhang et al., Reference Zhang2023a).
LINC00987 can inhibit the interaction of miR-376a-5p with FNBP1 mRNA, enabling its expression to drive invasion and migration in osteosarcoma cells (Cao et al., Reference Cao2021a). Wild-type p53 is a potential suppressor of FNBP1 transcription, inhibiting invasion that is lost in p53 double knockout (Suman et al., Reference Suman2022). Although p53 regulates a plethora of genes, attributing its effects on the invasive phenotype to p53-FNBP1 interactions will require further investigation.
RNA and protein translational control
Another level of epigenetic modification is related to protein translation. Shevde-Samant recently showed that a ribosomal RNA-modifying protein could alter post-transcriptional modifications influencing translation efficiency (Elhamamsy et al., Reference Elhamamsy2026). A multi-omic screen of multiple datasets revealed transcriptional dysregulation in TNBC. The tRNA methyltransferase activator subunit 11-2 (TRMT112) knockdown in TNBC cells significantly reduced proliferation, migration, invasion, and metastasis, while overexpression enhanced tumorigenicity. Analysis of translation revealed increases of prometastatic and stromal remodeling pathways and suppression of immune-related processes.
Their findings are more recent evidence complementing previously reported translational elongation association with metastatic progression (Bjornsti and Houghton, Reference Bjornsti and Houghton2004; Mamane et al., Reference Mamane2004). Specifically, higher expression of elongation initiation factor 4e (eIF4E) appears to selectively regulate translation of highly structured and capped mRNA (Zimmer and Graff, Reference Zimmer, Graff and Welch2002; DeBenedetti and Graff, Reference DeBenedetti and Graff2004; Mahe et al., Reference Mahe2024; Dang et al., Reference Dang2025; Fang et al., Reference Fang2025). Ultimately, eIF4E expression is directly correlated with progression in multiple tumor types.
CEBPδ and NFκB
CEBPδ is a transcription factor implicated in numerous biological processes (e.g., cell differentiation, motility, proliferation, cell death). As with most transcription factors, function is determined by cell type and cellular context, some of which have opposing outcomes (Balamurugan and Sterneck, Reference Balamurugan and Sterneck2013). For purposes of this review, we will focus on the roles of CEBPδ in metastasis-associated phenotypes. Of note, Esta Sterneck et al. have demonstrated a prometastatic function of CEBPδ (Balamurugan et al., Reference Balamurugan2023). Their results highlighted a critical aspect of interpreting expression data - mRNA and protein expression of E-cadherin do not correlate in the metastases. Using inflammatory BRCA in a three-dimensional culture system, protein stability of E-cadherin, β-catenin, and p120 catenin are promoted through a CEBPδ–COX2–PGE2–GSK3β pathway, in which GSK3β is inhibited. Key to these observations is a mechanism in which CEBPδ contributes to maintenance of E-cadherin expression throughout the metastatic cascade as opposed to the canonical EMT-MET plasticity mechanism (Dongre et al., Reference Dongre2017; Dongre and Weinberg, Reference Dongre and Weinberg2019; Allgayer et al., Reference Allgayer2025).
Nuclear factor kappa B (NFκB) was discovered because of its interaction with a sequence in the immunoglobulin light-chain enhancer of B cells. It is widely expressed and is responsible for numerous cellular responses to stress and plays key roles in regulating immune responses. NFκB regulates a number of molecules at the intersection migration, inflammation, and autophagy (Bharti and Aggarwal, Reference Bharti and Aggarwal2002; Sun and Xiao, Reference Sun and Xiao2003; Wu and Zhou, Reference Wu and Zhou2009, Reference Wu and Zhou2010), all metastasis-associated phenotypes. NFκ activation generally increases metastasis, largely by promoting EMT, invasion, and survival of tumor cells (Xia et al., Reference Xia2014; Mirzaei et al., Reference Mirzaei2022). However, its expression is associated with regulation of other metastasis-associated genes as well (Teng et al., Reference Teng2014; Cho et al., Reference Cho2015b; Soror et al., Reference Soror2024). Recent evidence shows that mtDNA in the extracellular space could be transferred to subsets of myeloid-derived suppressor cells via cGAS-STING-NFκB signaling to promote tumor progression (Lai et al., Reference Lai2025).
RRM1
Ribonucleotide reductase M1 is an essential component of DNA synthesis and repair by catalyzing production of deoxyribonucleotides and is implicated in NSCLC and PDAC (Brissenden et al., Reference Brissenden1988; Wright et al., Reference Wright1990; Han et al., Reference Han2018; Zhu et al., Reference Zhu2018). RRM1 was first investigated in cancer due to its chromosomal location (11p15.5) near multiple metastasis suppressor genes (Bepler et al., Reference Bepler1999, Reference Bepler2005; Pitterle et al., Reference Pitterle1999). However, RRM1 displays both tumor suppressor and promoting functions (Jordheim et al., Reference Jordheim2011).
In LUAD (Gautam et al., Reference Gautam2003) and COAD (Qi et al., Reference Qi2015), RRM1 drives expression of the tumor suppressor PTEN (Phosphatase and Tensin Homolog) to suppress migration, invasion, and metastasis via regulation of FAK. In papillary versus undifferentiated THCA subtypes, differential migratory and invasive phenotypes were observed (Fang et al., Reference Fang2016). Overexpression enhanced proliferative capacity of both subtypes, but RRM1 enhanced migration and invasion in differentiated cells while inhibiting undifferentiated cells.
Because of its role in DNA repair, RRM1 can be a driver of treatment resistance that induces DNA damage. Overexpression of RRM1 was associated with shorter survival in patients with metastatic BLCA who received gemcitabine as part of their treatment regimen (Matsumura et al., Reference Matsumura2017). NSCLC patients with lower levels of other DNA repair genes (ERCC1, BRCA1, GSTP1, but not RRM1) exhibited higher metastasis-free survival rates (Tsyganov et al., Reference Tsyganov2020).
A clinical trial assessing efficacy of a tailored, personalized treatment of NSCLC based on expression of DNA repair/synthesis proteins (RRM1, ERCC1, TUBB3, TYMS, TOP1, TOP2a, BRCA1, and GSTP1) found that classical chemotherapy (vinorelbine/carboplatin) increased the risk of fatality but not metastasis (Tsyganov et al., Reference Tsyganov2020). In a profiling study, RRM1 was upregulated in SKCM brain metastases as well as other DNA repair genes (Ferguson et al., Reference Ferguson2018). RRM1 also appears to drive radioresistance due to its role in DNA repair and through promoting expression of the DNA repair protein RAD51AP1 (Yang et al., Reference Yang2024). Expectedly, inhibition of RRM1 and RRM2 enhanced radiosensitivity of metastatic neuroendocrine pancreatic cancer (Chow et al., Reference Chow2024). In contrast, patients with malignant mesothelioma having high RRM1 expression had extended progression-free survival (PFS) in response to combination gemcitabine and cisplatin (Munoz-Montano et al., Reference Munoz-Montano2021). Whether this is a cancer intrinsic feature or due to resistance of the immune compartment (or other aspect of the TME) to cytotoxic stress that drives this phenotype would be an appropriate future investigation.
The importance of RRM1 as a prognostic factor in cancer progression remains murky. But it is still logical to hypothesize that increased expression of DNA repair proteins would promote cell survival in response to DNA damaging agents and potentially metastases. There is a relative void in basic research of RRM1 in metastatic progression, and whether it is a critical component or bystander to cancer evasion of cell death.
Noncoding RNA (ncRNA)
Throughout this review, several ncRNA have been mentioned as regulators of metastasis-promoting or metastasis-inhibiting genes. We termed microRNA that regulate metastasis metastamiR (Hurst et al., Reference Hurst2009a,Reference Hurstb). The number of metastamiR has been growing (nearly 20,000 publications currently found in PubMed searching the terms ‘microRNA AND metastasis’) and the mechanisms of action vary greatly (Kim et al., Reference Kim2018b; Sell et al., Reference Sell2023). Rather than detailing a list of proposed mechanisms for each, a curated list of metastamiR are listed in Table 1.
Select microRNA with functional data regulating invasion and/or metastasis

Table 1. Long description
Fallback
Cautions related to ascribing mechanisms to metastamiR include frequent clustering of miRNA which sometimes function like operons, being coordinately regulated and sometimes cross-regulating. Likewise, Rigoutsos et al. have demonstrated several miRNA isomers, termed isomiR (Loher et al., Reference Loher2021; Cherlin et al., Reference Cherlin2024). Many studies of miRNA assume that the ends are precisely defined, but they can vary by 2–5 nucleotides, which would change interactions and corresponding mechanisms of action.
Additional classes of ncRNA have since been identified: long ncRNA (lncRNA (Liu et al., Reference Liu2021)), circular RNA (circRNA), yRNA, arcRNA, and PIWI interacting RNA (piRNA). Each has been implicated in regulating different steps of the metastatic cascade. Multiple mechanisms of action have been associated with various lncRNA: altering EMT, changing immune polarization, TGFβ signaling, NFκB signaling, epigenetic complex expression and formation, and competing endogenous RNA (ceRNA). ceRNA is a recently described hypothesis, whereby RNA transcripts compete with shared pool(s) of miRNA for post-transcriptional control (Kartha and Subramanian, Reference Kartha and Subramanian2014; Tan and Marques, Reference Tan and Marques2014; Tay et al., Reference Tay2014). An increasing number of lncRNA regulate metastasis-associated phenotypes by regulating miRNA. A curated list is shown in Table 2.
Select lncRNA with functional data regulating invasion and/or metastasis
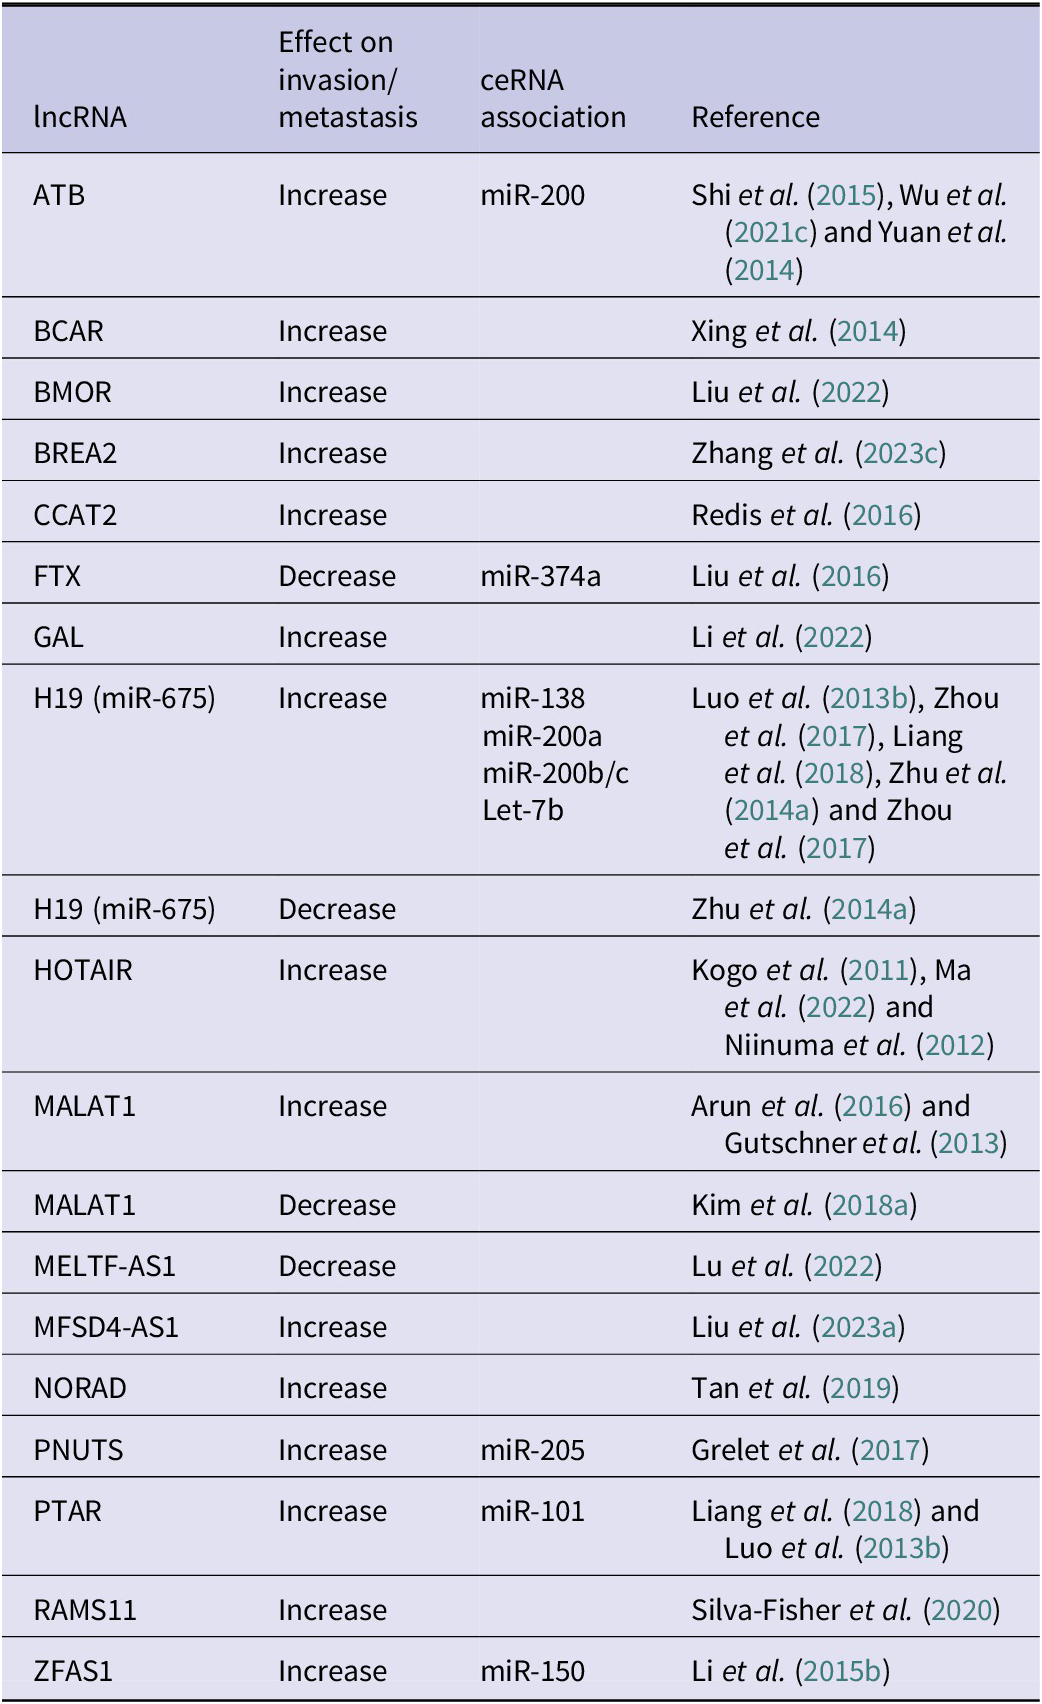
Table 2. Long description
The table contains four columns: l n c R N A, Effect on invasion/metastasis, c e R N A association, and Reference.
* A T B: Increase, m i R minus 200, Shi et al. 2015, Wu et al. 2021c, Yuan et al. 2014.
* B C A R: Increase, none listed, Xing et al. 2014.
* B M O R: Increase, none listed, Liu et al. 2022.
* B R E A 2: Increase, none listed, Zhang et al. 2023c.
* C C A T 2: Increase, none listed, Redis et al. 2016.
* F T X: Decrease, m i R minus 374a, Liu et al. 2016.
* G A L: Increase, none listed, Li et al. 2022.
* H 19 (m i R minus 675): Increase, m i R minus 138, m i R minus 200a, m i R minus 200b/c, Let minus 7b, Luo et al. 2013b, Zhou et al. 2017, Liang et al. 2018, Zhu et al. 2014a.
* H 19 (m i R minus 675): Decrease, none listed, Zhu et al. 2014a.
* H O T A I R: Increase, none listed, Kogo et al. 2011, Ma et al. 2022, Niinuma et al. 2012.
* M A L A T 1: Increase, none listed, Arun et al. 2016, Gutschner et al. 2013.
* M A L A T 1: Decrease, none listed, Kim et al. 2018a.
* M E L T F minus A S 1: Decrease, none listed, Lu et al. 2022.
* M F S D 4 minus A S 1: Increase, none listed, Liu et al. 2023a.
* N O R A D: Increase, none listed, Tan et al. 2019.
* P N U T S: Increase, m i R minus 205, Grelet et al. 2017.
* P T A R: Increase, m i R minus 101, Liang et al. 2018, Luo et al. 2013b.
* R A M S 11: Increase, none listed, Silva-Fisher et al. 2020.
* Z F A S 1: Increase, m i R minus 150, Li et al. 2015b.
Additionally, other ncRNA are emerging as critical regulators of tumor formation, progression, and metastasis. These include tRNA fragments and rRNA fragments, which are nonrandom cleavage products of the parent molecules that have both intra- and extracellular mechanisms of action (Schimmel, Reference Schimmel2018; Cherlin et al., Reference Cherlin2020; Panstruga and Spanu, Reference Panstruga and Spanu2024; Pliatsika et al., Reference Pliatsika2024; Bakowska-Zywicka et al., Reference Bakowska-Zywicka2025; Dong et al., Reference Dong2025; Guan et al., Reference Guan2025). Even mRNA fragments have been isolated and confirmed to encode microproteins or micropeptides (Aoyama and Storz, Reference Aoyama and Storz2023; Hofman et al., Reference Hofman2025; Zhang et al., Reference Zhang2025b, Reference Zhang2025c). Perhaps, even the prespliced or intron components are more biologically active than currently acknowledged. Regardless, there is a rapidly expanding role for noncoding RNA in the regulation of cancer and metastasis.
Genetic background and metastasis
Kent Hunter and colleagues used meiotic screens involving genetically engineered mice that develop aggressive mammary cancers to identify metastasis efficiency genes (Lifsted et al., Reference Lifsted1998; Winter and Hunter, Reference Winter and Hunter2008; Ross et al., Reference Ross2025). Thus far, they have identified more than 20 polymorphic factors that alter metastasis and have validated them functionally in metastasis assays (Table 3). Analogous studies in prostate cancer models have also identified candidate metastasis susceptibility genes (Ono et al., Reference Ono2013; Patel et al., Reference Patel2013; Lee et al., Reference Lee2015), further supporting the idea that inherited susceptibility to metastasis is a general phenomenon.
Polymorphic genes that alter metastatic efficiency
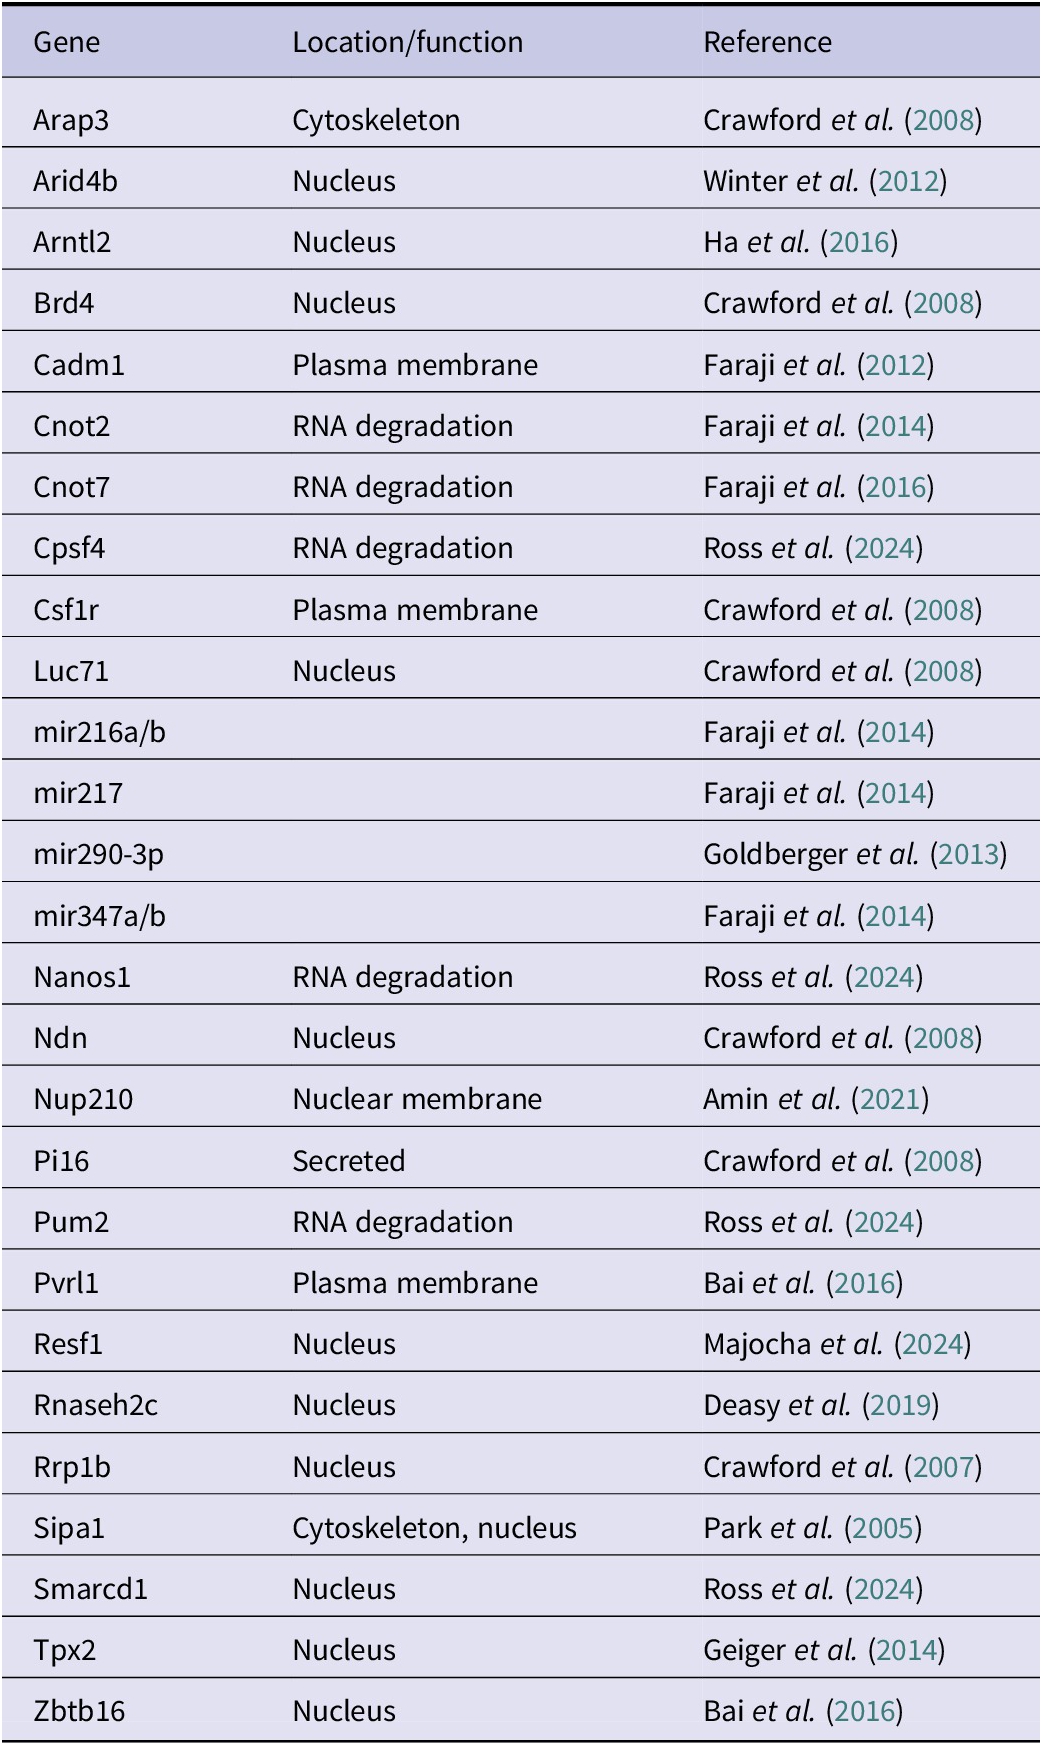
Table 3. Long description
The table consists of three columns: Gene, Location/function, and Reference.
* Arap3: Cytoskeleton. Crawford et al. 2008.
* Arid4b: Nucleus. Winter et al. 2012.
* Arntl2: Nucleus. Ha et al. 2016.
* Brd4: Nucleus. Crawford et al. 2008.
* Cadm1: Plasma membrane. Faraji et al. 2012.
* Cnot2: R N A degradation. Faraji et al. 2014.
* Cnot7: R N A degradation. Faraji et al. 2016.
* Cpsf4: R N A degradation. Ross et al. 2024.
* Csf1r: Plasma membrane. Crawford et al. 2008.
* Luc71: Nucleus. Crawford et al. 2008.
* mir216a/b: Location not specified. Faraji et al. 2014.
* mir217: Location not specified. Faraji et al. 2014.
* mir290-3p: Location not specified. Goldberger et al. 2013.
* mir347a/b: Location not specified. Faraji et al. 2014.
* Nanos1: R N A degradation. Ross et al. 2024.
* Ndn: Nucleus. Crawford et al. 2008.
* Nup210: Nuclear membrane. Amin et al. 2021.
* Pi16: Secreted. Crawford et al. 2008.
* Pum2: R N A degradation. Ross et al. 2024.
* Pvrl1: Plasma membrane. Bai et al. 2016.
* Resf1: Nucleus. Majocha et al. 2024.
* Rnaseh2c: Nucleus. Deasy et al. 2019.
* Rrp1b: Nucleus. Crawford et al. 2007.
* Sipa1: Cytoskeleton, nucleus. Park et al. 2005.
* Smarcd1: Nucleus. Ross et al. 2024.
* Tpx2: Nucleus. Geiger et al. 2014.
* Zbtb16: Nucleus. Bai et al. 2016.
Interestingly, many of these molecules can be colocalized in complexes or associated with shared pathways (Kent Hunter, personal communication). Furthermore, many of the pathways and complexes are involved in transcriptional regulation, protein translation and/or stability, or other epigenetic processes. This finding supports the assertion that plasticity is a hallmark of cancer metastasis (Welch and Hurst, Reference Welch and Hurst2019). Coupled with accumulating evidence that most of the metastasis-associated genes are not mutated in cancer but have altered expression (Welch et al., Reference Welch2000; Sleeman and Steeg, Reference Sleeman and Steeg2010; Hunter et al., Reference Hunter2018), strongly suggests that epigenetic plasticity, rather than constitutive (in)activation of genes and pathways, is the primary mechanism for metastatic progression.
Another reason for highlighting the studies of the Hunter lab is their broad applicability. There are literally millions of SNP that have segregated in the human population. Those polymorphisms are responsible for multiple traits, including disease susceptibility. As a result, every human is unique (Durbin et al., Reference Durbin2010). The same mutations on different genetic backgrounds result in distinct phenotypes (Threadgill et al., Reference Threadgill1995; Antoniou et al., Reference Antoniou2010; Ono et al., Reference Ono2013; Fontaine and Davis, Reference Fontaine and Davis2016). Similar observations are found in both mice and humans. Some noncancer examples include cystic fibrosis in which many patients homozygous for the CFTRdF508 mutation exhibit a spectrum of lung disease from near-normal to respiratory failure (Boyle, Reference Boyle2007). Similarly, mutations in SOD1 contribute to amyotrophic lateral sclerosis, but the age of onset and severity varies widely in humans (Kammenga, Reference Kammenga2017) and mice (The Jackson Laboratory, 2014).
Cancer’s genetic origin is clearly understood and accepted. In addition to the nuclear SNP, there are analogous SNP in mtDNA that define mouse strains (Bussard and Siracusa, Reference Bussard and Siracusa2017; Beadnell et al., Reference Beadnell2018; Scheid et al., Reference Scheid2021) just as they can identify clades in humans (Wallace and Torroni, Reference Wallace and Torroni1992; Wallace, Reference Wallace2018). While there has been increasing appreciation for the roles of mitochondria in cancer (Beadnell et al., Reference Beadnell2018; Scheid et al., Reference Scheid2019, Reference Scheid2021; Welch et al., Reference Welch2022; Tang and Yang, Reference Tang and Yang2025; Wei et al., Reference Wei2025; Balamurugan et al., Reference Balamurugan2026; Berridge et al., Reference Berridge2026; Bostan et al., Reference Bostan2026; Liang et al., Reference Liang2026), most efforts to investigate the genetics of cellular functions study only the nuclear genome.
We hypothesized that similar SNP in the mitochondrial genome could play a role in cancer metastasis. This hypothesis was supported by the design of Hunter’s experiments in which male MMTV-PyMT mice were crossed with females of the other strains. Since one inherits mitochondrial DNA (mtDNA) maternally, there existed the possibility of mitochondrial QTL.
To test this hypothesis, we generated a panel of mitochondrial-nuclear exchange (MNX) mice in which nuclear DNA (nDNA) is paired with mtDNA from other mouse strains, thereby allowing isolation of mitochondrial genetics as an experimental variable (Fetterman et al., Reference Fetterman2013; Welch et al., Reference Welch2023). Paralleling the Hunter experiment, we crossed nDNA-matched MNX with MMTV-PyMT mice and observed nearly identical results with regard to primary tumor latency, number, and size of metastases (Feeley et al., Reference Feeley2015). Extending those experiments using HER2 as a genetic driver, Brinker et al. (Reference Brinker2017) observed changes in the same phenotypes, but in a driver-dependent manner. Spontaneous tumor formation and metastasis were also altered in aged mice (Vivian et al., Reference Vivian2018). Effects on metastasis were not solely tumor cell intrinsic, as injection of syngeneic melanoma and mammary carcinoma cells into MNX mice resulted in 50%–90% inhibition of metastasis when mtDNA were derived from C57BL/6J mice and a 300%–500% enhancement of metastasis if mtDNA was C3H/HeN-derived (Brinker et al., Reference Brinker2020).
Since mtDNA does not encode any of the adhesion or invasion genes (as well as other tumorigenicity- or metastasis-associated genes), it was questioned whether mtDNA SNP were associated with nDNA methylation patterns and expression patterns (Vivian et al., Reference Vivian2017). Nonetheless, the hypothesis proved correct and the epigenetic methylation patterns were localized. Subsequent studies show similarly specific alterations of baseline populations (Beadnell et al., Reference Beadnell2020), microbiota (Welch Lab, manuscript Reference Labin preparation), and reactive oxygen species production (Brinker et al., Reference Brinker2020). Somewhat surprisingly, metabolomic analyses did not identify a metabolite correlating with the observed phenotypes (Lab). MNX mice show differences in atherosclerosis, adiposity, and diabetes (Fetterman et al., Reference Fetterman2013; Betancourt et al., Reference Betancourt2014; Bray and Ballinger, Reference Bray and Ballinger2017; Dunham-Snary et al., Reference Dunham-Snary2018; Kandasamy et al., Reference Kandasamy2019).
Collectively, these data show four things. First, genetic background is critically important for controlling susceptibility to tumor formation and metastasis efficiency. Second, involvement of many QTL in metastasis, both nuclear and mitochondrial, will complicate studies in cancer and metastasis (Swanton et al., Reference Swanton2024). Third, germline mtDNA SNP contribute to many phenotypes and should not be ignored in the study of metastasis. And fourth, the germline backgrounds represent a context which has been understudied in the context of cancer biology.
Cell surface and adhesion
The plasma membrane is the interface between neoplastic cells and the tumor microenvironment. Cells respond to the numerous soluble molecules in plasma and interstitial fluids, and tension exerted by the ECM via receptors and adhesion molecules. Binding of molecules to the cells initiates a cascade of signals that influence epigenetics, transcription, translation, and organelle modification that determine cell functions. Responses vary by which molecule(s) is bound, the strength of the molecular affinity, presence or absence of cofactors that amplify or mitigate signaling, and the length of interactions. This section focuses on surface molecules that have been implicated in metastasis regulation.
Integrins
Integrins make up a family of divalent-cation-dependent, heterodimeric, transmembrane proteins that comprise both normal and pathological functions regulating cell adhesion and signaling. Integrins are a specific subset of cell adhesion molecules that bind to ECM, separate from immunoglobins, cadherins, and selectins (Kadry and Calderwood, Reference Kadry and Calderwood2020). However, the link between cell–cell adhesion and the metastasis hallmarks of motility and invasion is exemplified here by integrins and later by other adhesion molecules (Welch and Hurst, Reference Welch and Hurst2019). Twenty-four known αβ dimers are formed from combinations of 18 α and 8 β subunits; the most promiscuous subunit is β1, dimerizing with 12 different α subunits (α1–11, αV). β2 dimerizes with four different α subunits, while β3 and β7 bind two α subunits – β4, β5, β6, and β8 only operate with one distinct α subunit each (Kadry and Calderwood, Reference Kadry and Calderwood2020).
Extracellular ligands for integrin binding are canonically reported as ECM constituents, such as laminin or collagen, among other dimer-specific ECM entities. These drive ‘outside-in’ signaling canonically via FAK/SRC, ERK and AKT pathways, while other mechanisms of signaling can occur independent of ligand binding (Hamidi and Ivaska, Reference Hamidi and Ivaska2018). Heterodimers exist in three conformational states: bent-closed (inactive), extended-closed (intermediately active), and extended-open (active). These states are dictated by divalent cation availability (Ca2+, Mn2+), dimerization partners, or intracellular binding/signaling mechanisms. Canonically, integrins bind ECM to initiate signaling through FAK/SRC, ERK, or AKT. A key signaling activity of most integrins is via association with focal adhesion kinase (FAK), which is commonly linked to invasion, angiogenesis and metastatic spread (Owens et al., Reference Owens1995; Zhao and Guan, Reference Zhao and Guan2011; Cooper and Giancotti, Reference Cooper and Giancotti2019).
During tumorigenesis and cancer progression, integrin subunit expression and abundance can become altered – ratios of integrins inhibitory to cancer progression versus those permitting progression become disproportionate compared to physiologically normal levels of integrin expression (Hamidi and Ivaska, Reference Hamidi and Ivaska2018). In primary tumors, a TCGA study assessed integrin regulation across 32 cancers finding an average of 33.5% of tumors harbored alterations (mutation, amplification, deletion, or a structural variant) of at least one integrin gene (Zou et al., Reference Zou2024).
Assessment of integrin expression using the Pan-cancer Integrin Explorer (PIExplorer) revealed two downregulated (ITGA8, ITGA9) or upregulated (ITGAX, ITGB4) integrins in at least 10 out of 15 cancers with matched normal tissue. ITGA8 was reduced across all cancer except for LIHC (upregulated in tumor) and HNSC (no significant difference, NSD). ITGA9 was reduced across all cancer types except for HNSC, KIRC, STAD, THCA (NSD) Alternatively, ITGAX and ITGB4 were upregulated in 10 out of 15 cancer types (down in two each).
Unsupervised clustering of expression (transcripts per million, TPM) for each integrin across cancer types grouped ITGA8, ITGA7, ITGA10, ITGB3, ITGA1, and ITGA9 as mostly downregulated integrins across cancers tested. Meanwhile, one cluster of integrins (ITGAD, ITGA5, ITGB7 ITGAM, ITGB2, ITGA4, ITGAL) was upregulated in a subset of cancers (KIRC, KIRP, KICH, BRCA, PRAD, UCEC) and upregulation of a second cluster (ITGA2B, ITGA3, ITGB4, ITGB8, ITGA2, ITGA6) was specific to other cancers (LIHC, THCA, LUAD, LUSC, COAD/READ, STAD, BLCA, ESCA). Interestingly, head and neck squamous cell carcinoma (HNSC) samples displayed upregulation across both clusters.
Differential clustering was predictive of overall survival, and specific to each cluster, suggesting a role for a coordinated integrin dysregulation in patient outcome. By specifically assessing survival within cancer groups, high ITGB8 status was associated with improved patient outcome KIRC, however, the high expression group was associated with worsened patient outcome in low-grade glioma groups. This further emphasizes the nuance of context specific roles of integrins across different cancer types. Moreover, integrin function is dependent upon each heterodimer, which varies by tumor cell origin and the matrices with which the tumor cells interact (reviewed in Hamidi and Ivaska, Reference Hamidi and Ivaska2018; Chastney et al., Reference Chastney2025; Maltseva et al., Reference Maltseva2025).
It must be noted that, while transcript levels are changed for many integrins, protein abundance may not be properly reflected by mRNA measurements; for example, ITGB8 is downregulated at the transcriptional level in TCGA BRCA data, but at higher abundance in Clinical Proteomic Tumor Analysis Consortium (CPTAC) proteomics datasets, though the number of samples in CPTAC is drastically reduced compared to TCGA (Maltseva et al., Reference Maltseva2025).
More specifically, subsets of integrins are associated with metastasis as recently reviewed by Hamidi and Ivaska (Reference Hamidi and Ivaska2018). Table 4 summarizes their findings as well as those associated with some large-scale comparisons of metastatic versus nonmetastatic cells (Ghandi et al., Reference Ghandi2019; Jin et al., Reference Jin2020; Zou et al., Reference Zou2024).
Integrin association with metastasis (Ghandi et al., Reference Ghandi2019; Jin et al., Reference Jin2020)
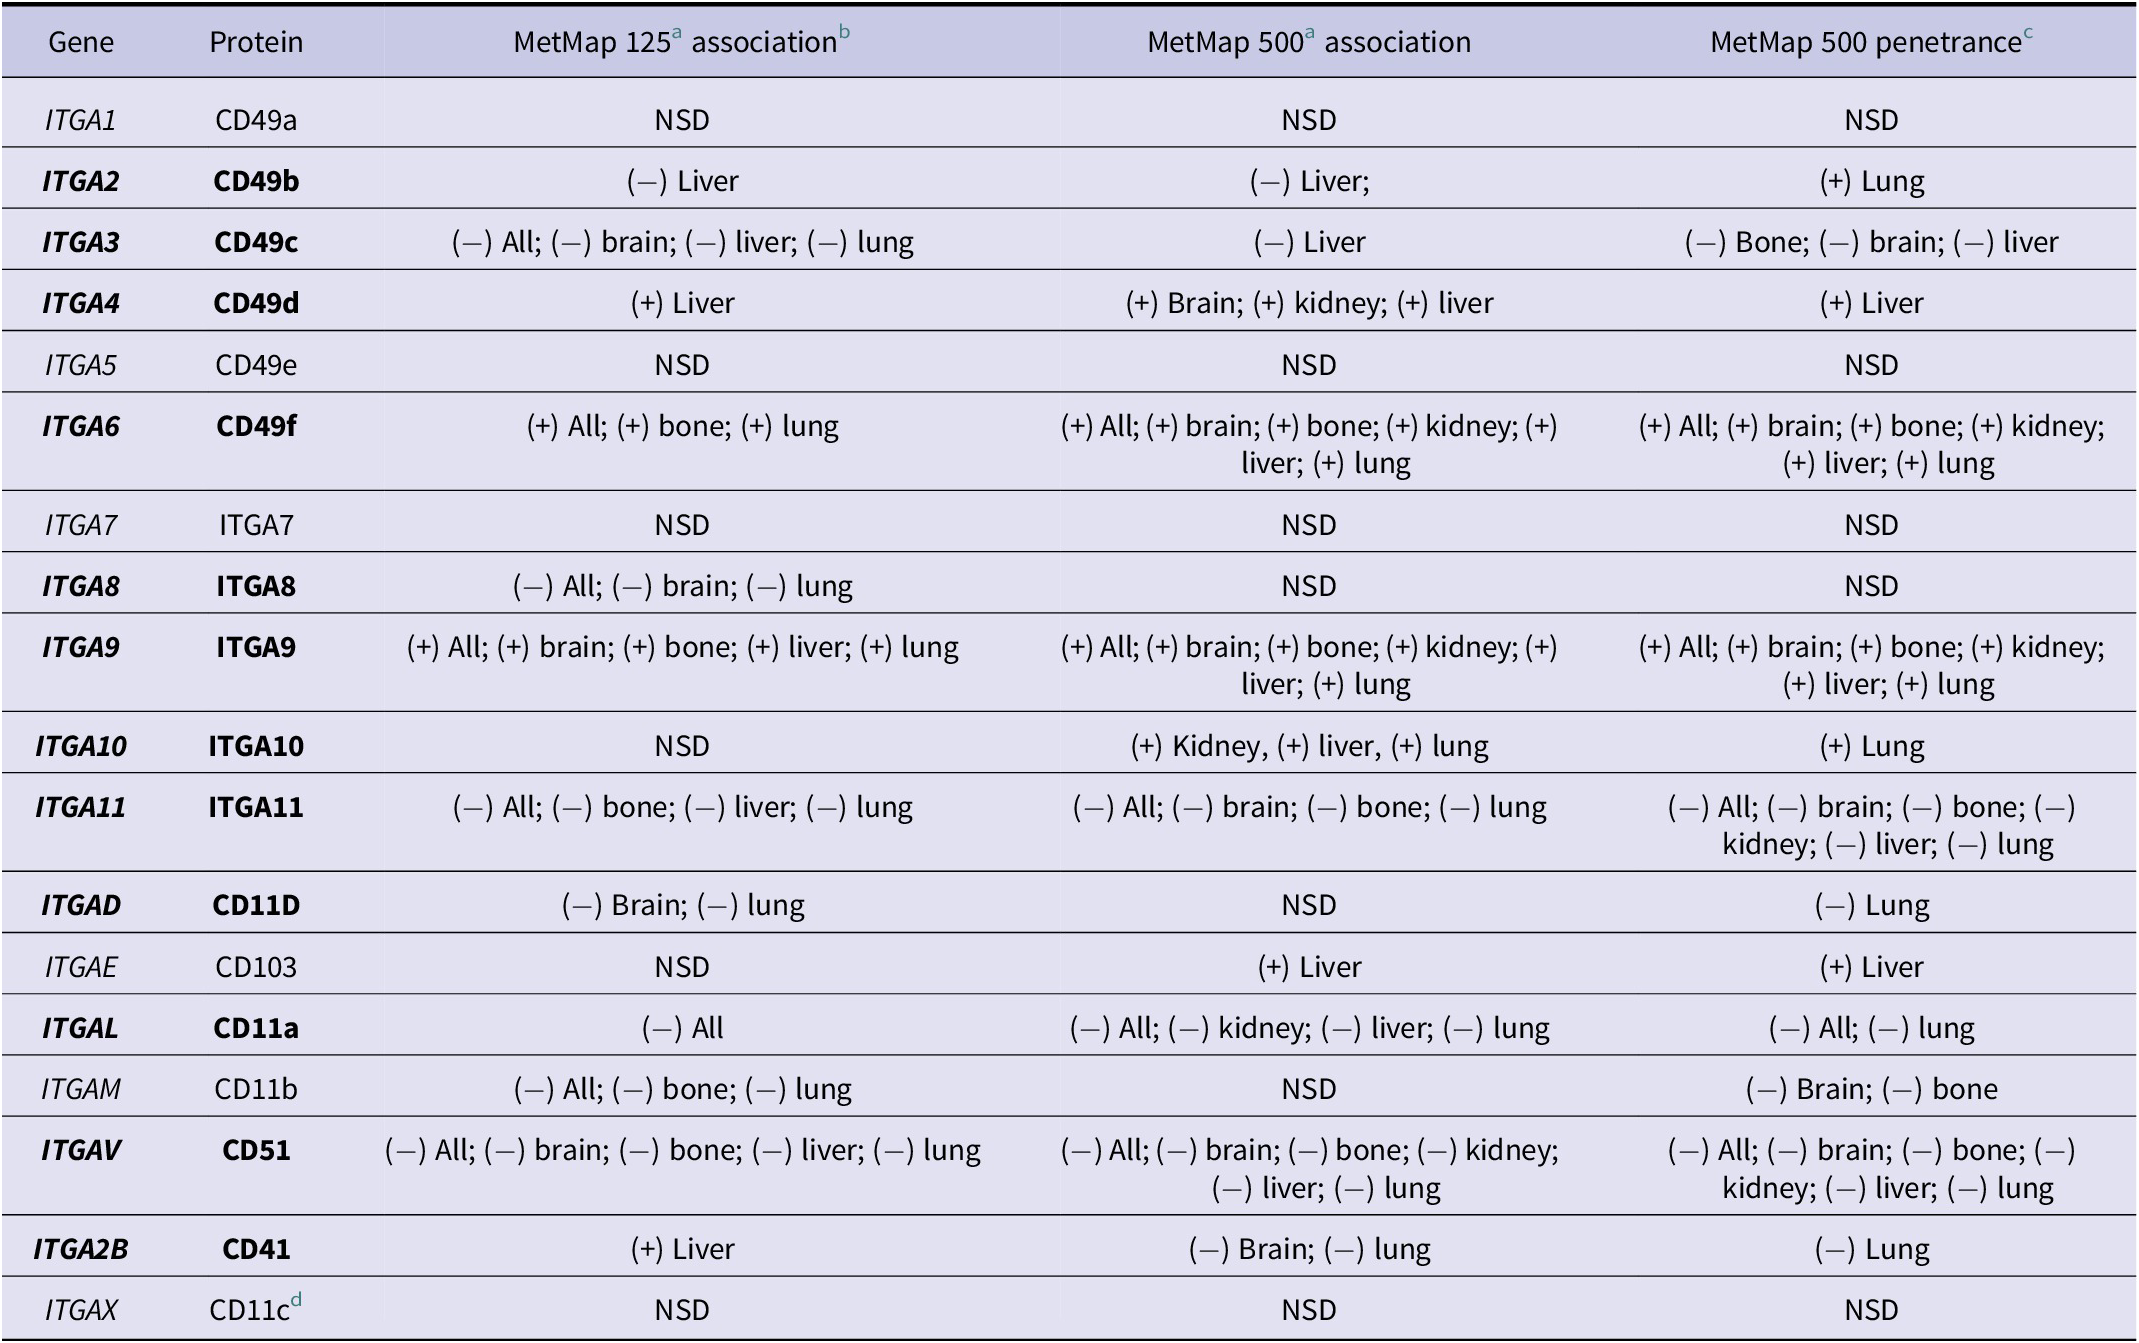
Table 4. Long description
The table consists of 18 rows of data under five column headers. Plus or minus symbols indicate significant positive or negative linear regression correlations (p < 0.05) between metastatic potential and gene expression. N S D indicates no significant difference.
* I T G A 1 (CD49a): N S D across all columns.
* I T G A 2 (CD49b): (-) Liver in MetMap 1 2 5 and 5 0 0; (+) Lung in penetrance.
* I T G A 3 (CD49c): (-) All, brain, liver, and lung in MetMap 1 2 5; (-) Liver in MetMap 5 0 0; (-) Bone, brain, and liver in penetrance.
* I T G A 4 (CD49d): (+) Liver in MetMap 1 2 5 and penetrance; (+) Brain, kidney, and liver in MetMap 5 0 0.
* I T G A 5 (CD49e): N S D across all columns.
* I T G A 6 (CD49f): (+) All, bone, and lung in MetMap 1 2 5; (+) All, brain, bone, kidney, liver, and lung in MetMap 5 0 0 and penetrance.
* I T G A 7 (I T G A 7): N S D across all columns.
* I T G A 8 (I T G A 8): (-) All, brain, and lung in MetMap 1 2 5; N S D in others.
* I T G A 9 (I T G A 9): (+) All, brain, bone, liver, and lung in MetMap 1 2 5; (+) All, brain, bone, kidney, liver, and lung in MetMap 5 0 0 and penetrance.
* I T G A 10 (I T G A 10): N S D in MetMap 1 2 5; (+) Kidney, liver, and lung in MetMap 5 0 0; (+) Lung in penetrance.
* I T G A 11 (I T G A 11): (-) All, bone, liver, and lung in MetMap 1 2 5; (-) All, brain, bone, and lung in MetMap 5 0 0; (-) All, brain, bone, kidney, liver, and lung in penetrance.
* I T G A D (CD11D): (-) Brain and lung in MetMap 1 2 5; N S D in MetMap 5 0 0; (-) Lung in penetrance.
* I T G A E (CD103): N S D in MetMap 1 2 5; (+) Liver in MetMap 5 0 0 and penetrance.
* I T G A L (CD11a): (-) All in MetMap 1 2 5; (-) All, kidney, liver, and lung in MetMap 5 0 0; (-) All and lung in penetrance.
* I T G A M (CD11b): (-) All, bone, and lung in MetMap 1 2 5; N S D in MetMap 5 0 0; (-) Brain and bone in penetrance.
* I T G A V (CD51): (-) All, brain, bone, liver, and lung in MetMap 1 2 5; (-) All, brain, bone, kidney, liver, and lung in MetMap 5 0 0 and penetrance.
* I T G A 2 B (CD41): (+) Liver in MetMap 1 2 5; (-) Brain and lung in MetMap 5 0 0 and penetrance.
* I T G A X (CD11c): N S D across all columns.
+/− indicates a significant (p < 0.05) positive or negative linear regression correlation between metastatic potential and gene expression of each integrin α gene in those cells at a specific organ, or ‘All’ which is a compilation of scores across all organs. NSD indicates no significant correlation described across all individual organs assessed, or collectively. Gene names with at least one significant correlation are highlighted in bold.
Some genes assessed by this method display consistency as potential prometastatic genes regardless of tissue (ITGA6, ITGA9). Some display potential antimetastatic gene expression correlation (ITGA11, ITGAV). Others have differing observations based on tissue (ITGA2, ITGA2B).
Note, that in some cases, it requires the aggregation of all metastatic sites (‘All’) to achieve significance, but correlation to cell arrest in single organs is unachieved, or can differ from MetMap125 to MetMap500.
MetMap125 organs assessed: Bone, brain, liver, lung.
MetMap500 organs assessed: Bone, brain, kidney, liver, lung.
Additional experimental information is listed in the primary manuscript, and the data were accessed and assessed via DepMap Portal. Statistics for significant correlations are included in Supplementary Table 1.
a Briefly, the original experiment was to simultaneously inject 125 (MetMap125) or 500 (MetMap500) cell lines intracardially followed by examination of single cells arrested in an organ (caution: presumed to be metastases, but not necessarily the case).
b Association is the correlation of cancer cell gene expression (CCLE – cancer cell line encyclopedia) with metastatic potential (calculated proportion of metastatic cells at each metastatic site in referenced experimental models).
c Penetrance is the percentage of biological replicates in which the cell line was found in each metastatic site.
E-cadherin, N-cadherin, and cadherin-11
Groundbreaking efforts by the lab of Masatoshi Takeichi using monoclonal antibodies to disrupt cell–cell connections led to the identification of cadherins, named to reflect their calcium-dependent adhesive function (Takeichi, Reference Takeichi1988). E-cadherin, encoded by CDH1 on chromosome 16 in humans or Cdh1 on chromosome 8 in mice, was the first to be discovered and cloned (Yoshida-Noro et al., Reference Yoshida-Noro1984) and is classically considered a suppressor of invasion in primary tumors (Rodriguez et al., Reference Rodriguez2012; Bruner and Derksen, Reference Bruner and Derksen2018; Kaszak et al., Reference Kaszak2020). N-cadherin was the next to be discovered (Hatta and Takeichi, Reference Hatta and Takeichi1986) among Type I classical cadherins, including E-cadherin (denoting expression in epithelial cells), N-cadherin (expression initially observed in neuronal cells), and P-cadherin (placental). Type I classical cadherins share the traits of having five repeated extracellular domains and a single transmembrane domain. N-cadherin is encoded by CDH2 or Cdh2 on chromosome 18 in both humans and mice, respectively. In contrast with E-cadherin, considered a facilitator of stable epithelial cohesion, N-cadherin enacts dynamic cell–cell adhesion underpinned by its localization in cellular regions that enable motility such as leading edges or heterotypic junctions (Qi et al., Reference Qi2005). Together, E-cadherin and N-cadherin are used as defining markers of EMT and its antithesis, MET.
E-cadherin sequesters oncogenic effectors such as β-catenin to the cell membrane, thereby preventing their nuclear translocation and subsequent WNT target gene activation (i.e., oncogenic transcription of Snail, Zeb, TWIST, etc.) while also maintaining Hippo-YAP/TAZ activity for contact inhibition (Lin et al. Reference Lin2023). N-cadherin also interacts with β-catenin, as well as p120-catenin, to stabilize Rac1/Cdc42-driven actin dynamics and enhance FGFR signaling, ultimately activating MAPK/ERK and PI3K/AKT oncogenic signaling (Mrozik et al., Reference Mrozik2018). Few cancer types (perhaps hematological malignancies) are unaffected by either E-cadherin or N-cadherin as their switch in expression denotes reprogramming of both cellular adhesion and signaling. During EMT, epithelial cells lose junctional integrity (and E-cadherin expression) and acquire mesenchymal traits (and N-cadherin expression). Both are useful, but not necessarily required, for intravasation, extravasation, and ultimately colonization (Fischer et al., Reference Fischer2015; Jolly et al., Reference Jolly2015, Reference Jolly2017, Reference Jolly2019; Zheng et al., Reference Zheng2015; Zhang and Weinberg, Reference Zhang and Weinberg2018; Dongre and Weinberg, Reference Dongre and Weinberg2019; Brabletz et al., Reference Brabletz2021). Multiple layers of regulatory mechanisms including epigenetic and promoter methylation, noncoding RNA, and chromatin remodeling impact expression of E- and N-cadherins throughout the metastatic cascade, and consequently their contributions to the process vary with temporal and microenvironmental context.
Complete, constitutive loss of either CDH1 or CDH2 is embryonic lethal, reflecting their critical importance as mediators of cell adhesion and signaling hubs (Larue et al., Reference Larue1994; Radice et al., Reference Radice1997a, Reference Radice1997b). Germline heterozygous loss of E-cadherin is associated with invasive lobular carcinoma in a classic two-hit model of oncogenesis that is screened for more diagnostic than prognostic value (Grabenstetter et al., Reference Grabenstetter2020; Bullock and Brunton, Reference Bullock and Brunton2025). Germline CDH1 loss-of-function mutation is also associated with autosomal dominant hereditary diffuse gastric cancer (Guilford et al., Reference Guilford1998, Reference Guilford1999; Blair et al., Reference Blair2020). Having global physiological relevance in cell adhesion outside the topic of neoplasia, CDH1 variants or risk-modifying SNP also contribute to nonsyndromic cleft lip and/or palate (Frebourg et al., Reference Frebourg2006; Vogelaar et al., Reference Vogelaar2013), a craniofacial development disorder called blepharocheilodontic syndrome (Ghoumid et al., Reference Ghoumid2017), and inflammatory and barrier-related disorders (Schneider and Kolligs, Reference Schneider and Kolligs2015). Pathogenic variants of CDH2 have been associated with ACOG syndrome (agenesis of corpus callosum, axon pathfinding, cardiac, ocular, and genital defects) (Accogli et al., Reference Accogli2019), neurodevelopmental and neuropsychiatric disorders (Moya et al., Reference Moya2013; Halperin et al., Reference Halperin2021), as well as cardiac structural disease (Mayosi et al., Reference Mayosi2017; Turkowski et al., Reference Turkowski2017), reflecting N-cadherin’s crucial roles in neural development.
In keeping with its loss during EMT, E-cadherin initially demonstrated functional roles as a metastasis suppressor. In the absence of Trp53, epithelial-specific deletion of CDH1 permitted mammary tumor development in transgenic mice and metastasis to regional lymph nodes occurred more frequently in mice with homozygous loss of E-cadherin than in heterozygous animals (Derksen et al., Reference Derksen2006). Consistent with this, tumor cells isolated from primary mammary tumors with homozygous floxed CDH1 and orthotopically transplanted into immunocompromised mice formed metastases at multiple distant sites at significantly higher frequency than cells derived from heterozygous tumors (Derksen et al., Reference Derksen2006). In the MMTV-PyMT mouse mammary cancer model, monoclonal antibodies targeting E-cadherin reduced lung metastasis without affecting primary tumor growth and similar reduction of lung metastases was observed using these antibodies with intravenously injected 4T1 mammary cancer cells (Na et al., Reference Na2020). Outside the context of breast cancer, conditional E-cadherin deletion also accelerated tumor progression and metastasis in the ‘KP’ Kras mutant and p53 null mouse model of lung cancer (Sinkevicius et al., Reference Sinkevicius2018).
On the contrary, E-cadherin may support survival and collective migration in other contexts, thereby acting as a promoter of metastasis (Padmanaban et al., Reference Padmanaban2019; Rubtsova et al., Reference Rubtsova2022). shRNA knockdown of E-cadherin in 4T1 cells significantly reduced lung metastasis when introduced intravenously into syngeneic mice (Elisha et al., Reference Elisha2018). It is possible that E-cadherin promotes colonization in the lungs at the MET stage (see also CEBP/δ section). Mammary tumor cells derived from MMTV/neu transgenic mice and sorted based on epithelial versus mesenchymal phenotypes lost E-cadherin expression at the site of orthotopic injection of epithelial-sorted cells but became re-expressed later in metastatic lesions (supposedly a requirement of MET) (Palen et al., Reference Palen2016). Comparison of E-cadherin-negative cells versus E-cadherin-positive 4T1 mouse mammary cancer cell lines, rates of distant metastasis were not significantly different despite more frequent observation of cell individualization in MMT cells via intravital imaging (Ilina et al., Reference Ilina2018). Similarly, liver metastatic burden following intrasplenic injection was equivalent between CDH1 null and CDH1-intact PAAD cells from KPC transgenic mice (Kaneta et al., Reference Kaneta2020).
While functional evidence suggests that E-cadherin’s roles (if any, depending on cancer type) in suppressing metastasis by restricting EMT or promoting metastasis during MET may depend on the timing of its expression, most initial in vitro evidence supports the paradigm of E-cadherin as a classic metastasis suppressor. Transfection of E-cadherin into highly invasive cancer cell lines results in loss of invasive and migratory capacity (Vleminckx et al., Reference Vleminckx1991; Chen et al., Reference Chen1997; Wong and Gumbiner, Reference Wong and Gumbiner2003). Carcinoma cell lines with reduced E-cadherin at baseline correlated with increased invasiveness (Kinsella et al., Reference Kinsella1994). However, the observations of E-cadherin as a metastasis promoter are not without support from in vitro mechanistic studies (Lee et al. Reference Lee2024). Clinically, loss or reduced expression of E-cadherin is indicative of poor prognoses in BRCA (Li et al., Reference Li2017b), STAD (Lu et al., Reference Lu2024), COAD (Chang et al., Reference Chang2022a), PRAD (Umbas et al., Reference Umbas1994, Reference Umbas1997), BLCA, PAAD (Xie et al., Reference Xie2017), CESC (Peng et al., Reference Peng2016), OV (Yu et al., Reference Yu2017), LUAD (Sulzer et al., Reference Sulzer1998), and HNSC (Ren et al., Reference Ren2016).
N-cadherin, on the other hand, can be a clinical indicator of poor prognosis when highly expressed in BLCA (Abufaraj et al., Reference Abufaraj2017), OV (Assidi, Reference Assidi2022), and HNSC (Luo et al., Reference Luo2012). With some exceptions, preclinical evidence indicates that N-cadherin expression actively promotes metastatic dissemination across multiple epithelial tumor models by enhancing promigratory and proinvasive signaling pathways; however, its functional impact is context dependent and may differ in tumors of mesenchymal origin. Transfection of N-cadherin into nonmetastatic MCF7 human BRCA cells conferred invasive phenotypes in vitro and the ability to metastasize in immunocompromised mice (Hazan et al., Reference Hazan2000). PyMT mice bred to coexpress N-cadherin in the mammary epithelium generated more than threefold more metastatic foci in the lungs (Hulit et al., Reference Hulit2007). Similar increases in metastatic lesions were observed when expressing N-cadherin in the MMTV-Neu mammary cancer model (Qian et al., Reference Qian2014). Lineage tracing experiments in immunocompetent mice supported the importance of N-cadherin expression prior to colonization as a promoter of metastasis and noted reduced metastatic lesions following N-cadherin deletion (Li et al., Reference Li2001). Similarly, expression of N-cadherin in nonmetastatic PRAD models induced invasion and metastasis that was reversed via monoclonal antibody targeting in xenograft models (Tanaka et al., Reference Tanaka2010). N-cadherin expression correlates with enhanced invasion and migration in cell culture assays using mammary cancer cells (Nieman et al., Reference Nieman1999; Chung et al., Reference Chung2013) and other cancer cell types (Li et al., Reference Li2001; Maret et al., Reference Maret2010; Bremmer et al., Reference Bremmer2015). However, in certain contexts, N-cadherin may act as a suppressor of tumor growth. In the KPC model of PAAD, loss of N-cadherin promoted precursor lesion and primary tumor development (Su et al., Reference Su2016). As with E-cadherin, the timing of expression and switching of N-cadherin may dictate its roles in cancer.
Categorized as a Type II classical cadherin, cadherin-11 is a transmembrane cell adhesion molecule expressed in mesenchymal cells such as bone marrow stromal cells and osteoblasts, for which it was originally named, ‘OB-cadherin’ (Okazaki et al., Reference Okazaki1994; Kimura et al., Reference Kimura1995). Located on human chromosome 16 (CDH11) or mouse chromosome 8 (Cdh11), Cdh11−/− mice demonstrate osteopenia and skeletal bone abnormalities (Kawaguchi et al., Reference Kawaguchi2001). Mutations in CDH11 are associated with craniofacial disorders such as branchio-skeleto-genital syndrome, also known as Elsahy–Waters syndrome (Castori et al., Reference Castori2018), or Teebi hypertelorism syndrome (Li et al., Reference Li2021). Aberrancies of expression or function of cadherin-11 associate with fibrotic and chronic inflammatory conditions (Johnson et al., Reference Johnson1997; Schneider et al., Reference Schneider2012; Noss et al., Reference Noss2015; Chang et al., Reference Chang2017; Sfikakis et al., Reference Sfikakis2017; Bowler et al., Reference Bowler2018; Schroer et al., Reference Schroer2019; Franze et al., Reference Franze2020; Cao et al., Reference Cao2021b).
Similar to and somewhat overlapping functionality with N-cadherin, cadherin-11 localizes to the cell membrane at points of cell–cell contact and to focal adhesions where it stabilizes p120 or β-catenin, among others (Langhe et al., Reference Langhe2016). In this way, cadherin-11 and its catenin binding partners relocate to the nucleus to promote cancer cell proliferation and invasion through Wnt signaling (Satriyo et al., Reference Satriyo2019; Liu et al., Reference Liu2023b; Shirai et al., Reference Shirai2024) and perhaps immune cell polarization (Li et al., Reference Li2012b). In cultured cancer cells, higher expression of cadherin-11 can correlate with increased invasiveness and migration (Chu et al., Reference Chu2008; Huang et al., Reference Huang2010; Berghoff et al., Reference Berghoff2015). In immunocompromised mice, PC3 PRAD cells expressing cadherin-11 metastasized to bone following intracardiac injection and metastatic burden was reduced following cadherin-11 knockdown using shRNA (Chu et al., Reference Chu2008). Similarly, shRNA knockdown if cadherin-11 in human glioma cells decreased migration and inhibited tumor growth in nude mice (Kaur et al., Reference Kaur2012). Human MDA-MB-231 BRCA cells with bone tropism had higher expression of cadherin-11 and increased incidence of bone metastases in nude mice than MDA-MB-231 cells with tropism to brain (Tamura et al., Reference Tamura2008). Unmodified MDA-MB-231 cells introduced subcutaneously grew more slowly in immunocompromised mice when cadherin-11 was silenced via siRNA (Satriyo et al., Reference Satriyo2019). Targeting cadherin-11 with monoclonal antibodies similarly reduced metastasis of BRCA cells (Chen et al., Reference Chen2019). In KPC mice, constitutive knockout of Cdh11 slowed primary PRAD growth, prolonged survival, and modulated the immunologic tumor microenvironment (Peran et al., Reference Peran2021; Sebastian et al., Reference Sebastian2023). Clinically, higher cadherin-11 expression is typically associated with more invasive disease and lower survival in BRCA (Chen et al.), oral squamous cell carcinoma (Ma et al., Reference Ma2018a), or STAD (Mita et al., Reference Mita2023). However, some contradictory findings have been reported in some cancer types. In HNSCC cell lines transfected with shRNA targeting cadherin-11, knockdown tumors grew faster than their control tumors located on contralateral flanks of the same SCID mice (Carmona et al., Reference Carmona2012). CDH11 demethylation and ectopic cadherin-11 expression in ESCA, STAD, and COAD cancer cell lines decreased cell proliferation, increased apoptosis, slowed migration (Li et al., Reference Li2012b). Similar epigenetic downregulation of cadherin-11 was noted to suppress proliferation, promote apoptosis, and limit colony formation, migration, and invasion of COAD cancer cells (Yuan et al., Reference Yuan2019). Correlating with clinical outcomes, high expression of cadherin-11 in newly established human osteosarcoma cell lines increased survival (Nakajima et al., Reference Nakajima2008), but no significant impact of cadherin-11 expression on survival was observed in OV (von Bulow et al., Reference von Bulow2015).
Cell–cell adhesion, while clearly involved in many steps of the metastatic cascade, involves multiple different molecules that operate in concert. The strength of those interactions and the associated outside-in signaling is reminiscent of the types of signaling described for integrins. Differential expression is dependent on the embryonic origins of cells as well as what the cells become as differentiated tissues. Since cancer cells can sometimes revert to an incompletely differentiated phenotype (Pierce and Cox, Reference Pierce, Cox and Saunders1978; Pierce and Speers, Reference Pierce and Speers1988) or exhibit different degrees of stemness (Mani et al., Reference Mani2008; Brabletz, Reference Brabletz2012; Allgayer et al., Reference Allgayer2025), it is perhaps not surprising that the effects on metastasis are context dependent.
KAI1/CD82
KAI1 (Kangai1) was initially identified as a metastasis suppressor using microcell-mediated chromosome transfer and mapped to human chromosome 11p11.2 in rat AT6.1 PRAD (Ichikawa et al., Reference Ichikawa1992). Re-expression of KAI1 suppresses metastasis in multiple cancer types (reviewed in Liu and Zhang, Reference Liu and Zhang2006; Tang et al., Reference Tang2014b, Reference Tang2015; Prabhu and Devaraj, Reference Prabhu and Devaraj2017; Yan et al., Reference Yan2021; Du et al., Reference Du2022) and its expression in multiple cancer types is associated with improved prognosis and/or metastasis-free survival (Ilhan et al., Reference Ilhan2009; Malik et al., Reference Malik2009; Yan et al., Reference Yan2021). It is a member of the tetraspanin family of four-pass transmembrane glycoproteins which are involved in organizing membrane microdomains. KAI1 is closely associated with cholesterol and lipid rafts and is ubiquitously expressed in normal tissues. As a result, KAI1 plays important roles in regulating cellular signal transduction and adhesion by associating with multiple integrins (Zheng et al. Reference Zhong2025). However, its mechanism of inhibiting metastasis involves modulation of adhesion (Guo et al., Reference Guo2017b), motility (Dong et al., Reference Dong1995; Takaoka et al., Reference Takaoka1998; Uchida et al., Reference Uchida1999; Jackson et al., Reference Jackson2000; Ruseva et al., Reference Ruseva2009; Tsai and Weissman, Reference Tsai and Weissman2011), EMT (Lee et al., Reference Lee2017, Reference Lee2019), autophagy (Wu et al., Reference Wu2011), angiogenesis (Park et al., Reference Park2012; Tang et al., Reference Tang2015), and responses to hypoxia and/or growth factors (Park et al., Reference Park2012).
Two aspects of KAI1 which are noteworthy are its regulation by NME1 (You et al., Reference You2016), hypoxia/HIF1α (Kim et al., Reference Kim2010a; Park et al., Reference Park2012), and the existence of alternative splice forms (Wei et al., Reference Wei2024). Although reported in the literature, differential regulation of metastasis and metastasis-associated phenotypes via these changes has not been extensively studied.
CD44
CD44 was first identified as an 80–95 kDa heavily glycosylated cell surface protein that constituted the antigen for InA and InB blood groups (Spring et al., Reference Spring1988; Jacobs and Sackstein, Reference Jacobs and Sackstein2011). It was later shown that CD44 was expressed in hematopoietic cells as a glycoprotein/L-selectin ligand that allowed cell adherence (Oxley and Sackstein, Reference Oxley and Sackstein1994). CD44 binds to other selectins, mediating adhesion of cancer cells to P-selectin (Alves et al., Reference Alves2008), L/E selectin (Hanley et al., Reference Hanley2006), but dependence varies with isoform and post-translational modification. Additionally, CD44’s extracellular interactions include binding to hyaluronan (Aruffo et al., Reference Aruffo1990), fibronectin (Ishii et al., Reference Ishii1993), laminin (Ishii et al., Reference Ishii1993), collagen (Ishii et al., Reference Ishii1993), and fibrin (Alves et al., Reference Alves2008).
CD44 has been identified as a metastasis promoter across various isoforms with differing functions in the regulation of EMT plasticity, extracellular binding functions, and downstream intracellular signaling (Jacobs and Sackstein, Reference Jacobs and Sackstein2011; Hassn Mesrati et al., Reference Hassn Mesrati2021; Primeaux et al., Reference Primeaux2022; Mehner et al., Reference Mehner2024; Shen et al., Reference Shen2024). It is often thought of as a stem cell marker (Morath et al., Reference Morath2016) as well. Signaling pathways activated by CD44 ligand binding, or CD44 acting as a cofactor for other receptors include promoting receptor function for ligands HGF, VEGF, FGF, NGF, TGFB, CXCL12, and WNT (Orian-Rousseau et al., Reference Orian-Rousseau2002; Khan et al., Reference Khan2005, Reference Khan2021; Orian-Rousseau and Sleeman, Reference Orian-Rousseau and Sleeman2014; Morath et al., Reference Morath2016, Reference Morath2018; Karamanos et al., Reference Karamanos2021; Mehner et al., Reference Mehner2024), all involved in protumorigenic signaling that can be speculated as contributors to metastatic potential.
Overall, CD44 displays high expression in many malignancies and is associated with significantly reduced survival probability in TCGA datasets (GBM, HNSC, LIHC, PAAD, KIRC, KIRP, BLCA) accessed via the Human Protein Atlas (Uhlen et al., Reference Uhlen2015). CD44 exists in many isoforms and the contributions of various isoforms in metastatic functions are specific: CD44s affects cell differentiation, adhesion, and intracellular actin signaling (Ponta et al., Reference Ponta1994; Zoller, Reference Zoller1995, Reference Zoller2011; Chen et al., Reference Chen2018a); CD44v3 is involved in tyrosine kinase signaling (Grimme et al., Reference Grimme1999; Wang et al., Reference Wang2007; Banky et al., Reference Banky2012); CD44v6 activates cMET or EGFR driving chemotaxis and invasion (Orian-Rousseau et al., Reference Orian-Rousseau2002; Bellerby et al., Reference Bellerby2016; Matzke-Ogi et al., Reference Matzke-Ogi2016; Ma et al., Reference Ma2019); CD44v8-10 is involved in modulating redox states of cells in colonization (Yae et al., Reference Yae2012). All of these isoforms promote metastasis in multiple cancers. Examples include CD44 knockdown reducing COAD cell migration in a transwell system via Lyn kinase/AKT signaling (Subramaniam et al., Reference Subramaniam2007) and CD44 negatively regulating mitochondria-mediated apoptosis which, in turn, promotes cell survival (Lakshman et al., Reference Lakshman2004).
CD44−/−APC+/min or trp53 +/tm1 mice have no change in tumor burden but exhibit a lack of osteosarcoma metastases (Weber et al., Reference Weber2002). Similarly, in a Nf2–/– LIHC model, CD44 is essential for integrin B2 upregulation and transendothelial migration but did not affect primary tumor growth (Gerardo-Ramirez et al., Reference Gerardo-Ramirez2023). However, in MMTV-PyMT spontaneously metastatic mouse models of breast cancer, there was enhanced susceptibility to lung metastases when crossed with CD44 knockout mice (Lopez et al., Reference Lopez2005), suggesting an antimetastatic role under specific conditions.
As with many metastasis-associated genes, expression of RNA and protein do not always correlate. Regulation of the gene products can change metastatic efficiency. For example, CD44 can be endocytosed and degraded. The chaperone protein PEAR1 can bind CD44 to inhibit degradation. Degradation can promote CD44-mediated metastatic functions by facilitating invasive and migratory processes. Blocking PEAR:CD44 interaction conversely reduces migration and invasion in TNBC (Shen et al., Reference Shen2024).
ITIH5 and HMP19
Pancreatic ductal adenocarcinoma (PDAC) is among the most lethal cancer types due to its aggressive nature and difficulty in early diagnosis (Siegel et al., Reference Siegel2017). Kurahara and colleagues performed in vivo siRNA screen to identify suppressors of PDAC metastasis and identified HMP19 (Kurahara et al., Reference Kurahara2016) and inter-alpha-trypsin-inhibitor-5 (ITIH5) (Sasaki et al., Reference Sasaki2017) as suppressors of PDAC metastasis. In both studies, expressions were anticorrelated with PDAC. We will briefly discuss the functions of both and use them as illustrations regarding challenges associated with ascribing metastasis regulatory functions to them.
HMP19 (also known as NSG2, neuronal vesicle trafficking associated 2) suppressed metastasis but also partially inhibited orthotopic tumor growth in vivo. It also inhibited cellular proliferation, migration, and anchorage-independent growth of PDAC cells in vitro. Some of those changes correlated with inhibition of G1/S transition and nuclear translocation of phospho-ERK1/2. These latter properties are consistent with previously reported vesicular trafficking in Golgi. The only other known function for HMP19 is that it encodes a receptor involved in neurotransmission (Chander et al., Reference Chander2019). Unfortunately, quality reagents have limited studies into its precise mechanism of action.
ITIH5 (inter-alpha-trypsin-inhibitor-5) is a secreted protein whose loss of expression has been described in many different cancers (Peng et al., Reference Peng2023b; Kosinski et al., Reference Kosinski2024; Subramaniyam and Harihar, Reference Subramaniyam and Harihar2024; Zhong et al., Reference Zhong2025). It is one of the larger family of ECM molecules with multiple reported functions (Zhong et al., Reference Zhong2025). ITIH5 functions as a tumor suppressor in multiple cancer types (Dotsch et al., Reference Dotsch2015; Rose et al., Reference Rose2017; Daum et al., Reference Daum2021; Zou et al., Reference Zou2021; Kosinski et al., Reference Kosinski2024; Chen et al., Reference Chen2024a). Reduced expression is apparently due to promoter hypermethylation (Veeck et al., Reference Veeck2008; Rose et al., Reference Rose2020). As in PDAC, expression of ITIH5 in BRCA is associated with decreased metastatic efficacy (Rose et al., Reference Rose2017). In contrast to HMP19, intrasplenic injection of PDAC cells reduced the number and size of liver metastases without a similar reduction of lung metastases (Young et al., Reference Young2021). This finding highlights the organotropism of metastasis and how metastasis suppression could be organ selective. This conclusion is somewhat analogous to orthotopic growth of KISS1-expressing cells without growth of the same cells at ectopic sites. The basis for the differences can be due to context, though the precise signals are not yet defined.
Another aspect of ITIH5 studies of note is that prior data of ITIH5 (and family members) indicated that it is a secreted molecule and that it would function by interactions with the ECM (Sanders et al., Reference Sanders1992; Bost et al., Reference Bost1998; Swiatly et al., Reference Swiatly2017; Li et al., Reference Li2018c; Zhou et al., Reference Zhou2026b). However, Young et al. found that ITIH5 does not appear to be secreted in extracellular vesicles (Young et al., Reference Young2021). Furthermore, expression of secretion-defective ITIH5 could also arrest PDAC migration and metastasis. Curiously, ITIH5 expression appears to be lost early in PDAC progression with no further loss in metastases. Nonetheless, higher ITIH5 expression appeared to be associated with improved survival in PDAC patients.
The findings of HMP19 and ITIH5 highlight a few important points. First, the differential effects on metastases in different organs suggest that, as we learn more about the underlying (epi)genetics of metastasis, insights related to organotropism will emerge. Those insights may help future physicians cater treatments to likely sites of metastases rather than subjecting the whole person to toxic agents. Second, the functions of proteins are context specific. Secretion may be required to exert a phenotype in some cell types, while it may not be required in another tissue. This conclusion also highlights dangers in extrapolating findings from one tumor type to another. Third, as with other molecules discussed in this review, the quality of reagents and their validation will prove essential to unambiguous advancement of the field.
Cell adhesion molecule 1 (CADM1)
CADM1 was initially identified as a tumor suppressor in NSCLC cells (Kuramochi et al., Reference Kuramochi2001) and expression suppressed metastasis to the liver (Yageta et al., Reference Yageta2002). However, loss of CADM1 expression is correlated with lymph node metastasis in nasopharyngeal carcinoma in patient samples (Lung et al., Reference Lung2006) and loss in primary BRCA tumors is associated with metastatic progression and invasion (Takahashi et al., Reference Takahashi2012). CADM1’s mixed roles in different cancer types are reviewed in Li et al. (Reference Li2021b). In experimental models where CADM1 expression suppresses metastasis, CADM1 interacts with class-I restricted T-cell adhesion molecule, suggesting a potential mechanism of suppression through increasing immune surveillance (Galibert et al., Reference Galibert2005). This interaction increases IFN-γ resulting in rejection in vivo (Boles et al., Reference Boles2005; Giangreco et al., Reference Giangreco2012). Suppressive effects were lost in nude mice which lack T-cell-mediated immunity (Faraji et al., Reference Faraji2012). Functions are associated with inhibition of Ras-Raf-MEK1/2-ERK1/2 signaling and promotion of cell death, STAT3 signaling (Vallath et al., Reference Vallath2016; Wu et al., Reference Wu2021b), and JAK/STAT signaling (Vallath et al., Reference Vallath2016).
CADM1 expression is methylation dependent (Kuramochi et al., Reference Kuramochi1997, Reference Kuramochi2001; Fukami et al., Reference Fukami2003; Kikuchi et al., Reference Kikuchi2006; Reamon-Buettner and Borlak, Reference Reamon-Buettner and Borlak2008; Takahashi et al., Reference Takahashi2012; Wikman et al., Reference Wikman2014) and is regulated by TWIST1 (Hartsough et al., Reference Hartsough2019). In SKCM, TWIST1 and EMT are inversely correlated with expression of CADM1 (Hartsough et al., Reference Hartsough2019; Li et al., Reference Li2021b). These complex patterns of expression, signaling, and regulation are likely explanations for the reported tissue-specific effects.
Keratins
Keratins are a diverse family of intermediate filament proteins in epithelial cells. Heteropolymeric filaments which pair type I and type II molecules are expressed in specific patterns and are associated with stages of cellular differentiation. Therefore, they have been useful in categorizing many cancers. In humans there are 54 different keratin genes. The keratin proteins are important for mechanical stability, motility, and cellular integrity and are also involved in intracellular signaling, stress responses, wound healing and apoptosis (reviewed in Moll et al., Reference Moll2008). While typically located in the cytoplasm, emerging data suggest that some are located on cell surfaces, and the location suggests alternative functions (Ogunnigbagbe et al., Reference Ogunnigbagbe2022). Of note, keratin intermediate filaments are critical intermediaries in cell motility (Yoon and Leube, Reference Yoon and Leube2019). In recent publications, keratins have been associated with acquisition of metastatic capabilities (Huang et al., Reference Huang2026; Li et al., Reference Li2025c). Using a COAD model, Huang et al. (Reference Huang2026) found that knockdown of KRT81 using shRNA inhibited proliferation, invasion, and migration via regulation of ezrin/radixin/moesin protein complexes. Although the keratins have long been implicated in motility and invasion, a prometastatic role is only a recent observation. As with other metastasis-associated molecules, the effects are likely to be cellular context dependent.
Claudin-1 and claudin-4
Claudins are a multigene family of integral membrane proteins that regulate ion permeability and barrier function while anchored at tight junctions via four alpha-helical transmembrane domains. Early work characterizing claudin-1 and claudin-4 was accomplished by Shoichiro Tsukita’s lab via biochemical fractionation of tight junction-enriched membrane preparations followed by protein sequencing of prominent bands not corresponding to known components such as occludin (Furuse et al., Reference Furuse1998; Reference Furuse2002; Morita et al., Reference Morita1999; Morohashi et al., Reference Morohashi2007). Claudin-1 knockout mice display congenital skin defects and die within one day of birth, while claudin-4 knockout mice are viable to adulthood but have increased susceptibility to epithelial injury, inflammation, or infection in some contexts (Furuse et al., Reference Furuse1998, Reference Furuse2002; Kage et al., Reference Kage2014). Mutations in claudin-1 are linked to ichthyosis and neonatal sclerosing cholangitis (NISCH syndrome), while mutations in claudin-4 are not associated with classic heritable disease (Baala et al., Reference Baala2002). The differences are tied directly to the nonredundant, foundational barrier-forming functions of claudin-1 versus the redundant, barrier-modulating and signaling functions of claudin-4. While both are embedded in the plasma membrane at tight junctions, differential roles as structural versus regulatory molecules contribute to their roles in metastasis, in which claudin-1 often behaves as a metastasis suppressor but claudin-4 is frequently protumorigenic; however, numerous exceptions have been demonstrated.
In a retrospective study of 83 BRCA cases, decreased CLDN1 expression correlated with recurrence, shorter disease-free interval, and lymph node metastasis, suggesting that loss of CLDN1 expression is linked to a more aggressive, metastatic phenotype (Morohashi et al., Reference Morohashi2007). Lack of membrane claudin-1 expression was associated with lymph node metastasis and significantly worse survival in TNBC (Ma et al., Reference Ma2014a). High expression of claudin-1 in tumor samples correlated with improved overall survival in LUAD patients and when claudin-1 was overexpressed in the human CL1-5 LUAD cell line, the cells demonstrated reduced migration, invasion, and fewer pulmonary lesions when introduced intravenously into SCID mice (Chao et al., Reference Chao2009). Human SKCM cells that metastasize to brain in xenograft models had lower expression of claudin-1 than a related cell line with preferential tropism to skin; additional experiments determined that overexpression of claudin-1 in brain-colonizing SKCM cells reduced migration in vitro and improved survival in vivo (Izraely et al., Reference Izraely2015). Using MDA-MB-231 TNBC cells, stable overexpression of claudin-1 reduced migration and aggregation (Geoffroy et al., Reference Geoffroy2020). However, in different hands reduced migration was observed in MDA-MB-231 cells, as well as in MCF7 cells, following siRNA knockdown of claudin-1 (Zhao et al., Reference Zhao2015; Zhou et al., Reference Zhou2015a).
Further contradictory observations were made in STAD cancers. In patient samples of COAD, claudin-1 expression increased with progressive disease and metastasis (Dhawan et al., Reference Dhawan2005). Overexpression of claudin-1 in SW480 human COAD cells derived from a primary tumor and having low endogenous claudin-1 expression resulted in increased growth in soft agar, faster developing subcutaneous tumors in nude mice, and the development of liver metastases following intrasplenic injection and splenectomy when the parental SW480 cells failed to metastasize. Conversely, siRNA knockdown of claudin-1 in the SW620 cell line, which was derived from a metastatic lesion from the same patient as SW480 cells, eliminated migration, decreased invasion, slowed primary tumor growth, and reduced liver metastases by half or more after injection into the spleen.
Taken together, claudin-1 appears to serve more as a contextual modifier of metastasis than a universal metastasis suppressor. shRNA-mediated knockdown of CLDN1 in human STAD suppressed migration and invasion in vitro while also delaying primary tumor growth and reducing pulmonary metastasis in immunocompromised mice; overexpression of CLDN1 promoted STAD cell migration and invasion (Huang et al., Reference Huang2015). It is possible that the resulting effects of high versus low claudin-1 expression on metastasis are specific to the type of cancer involved. Based on expression of CLDN1, impact on survival appears to be specific to the type of cancer in which some tumors correlate with improved survival when claudin-1 gene expression is low (such as READ, or ACC), but others fare better when it is high (CESC, THCA) (Bhat et al., Reference Bhat2020). Mechanistically, claudin-1 is capable of suppressing cell migration via interactions with ZO scaffold proteins, occludin, and stabilize E-cadherin to ultimately preserve epithelial cell–cell adhesion (Li, Reference Li2021). Conversely, it may also interact with Src family kinases, PI3K, FAK, and β-catenin to delocalize claudin-1 from the plasma membrane to the nucleus, promote focal adhesion turnover, and permit actin remodeling of migrating cells (Singh et al., Reference Singh2012). The divergent effects of CLDN1 elevation or suppression in the clinical context or opposing results from experimental overexpression or knockdown in vitro may reflect differences in cellular context, junctional organization, and claudin-1 subcellular localization. In poorly differentiated, junction-deficient cells, overexpression of claudin-1 may restore epithelial cohesion and suppresses motility, whereas in cells retaining partial junctional architecture or hybrid epithelial–mesenchymal states, claudin-1 would support motility such that its knockdown reduces migration.
Similar to claudin-1, claudin-4 may suppress or promote metastasis in cancer-dependent contexts. Overexpression of claudin-4 in the SUIT-2 human PAAD cell line reduced metastasis in nude mice following intravenous injection (Michl et al., Reference Michl2003). Supporting a role in metastasis suppression in OVCA, shRNA-mediated knockdown of claudin-4 in 2008 cells promoted experimental metastasis and accelerated migration in vitro (Shang et al., Reference Shang2012). On the other hand, CRISPR/Cas9-mediated knockout of claudin-4 in BRCA lines T47D and MCF7 slowed migration and invasion (Murakami-Nishimagi et al., Reference Murakami-Nishimagi2023). Similarly, shRNA knockdown of claudin-4 in MCF7 cells inhibited migration, while overexpression promoted scratch/wound closure (Ma et al., Reference Ma2015). Clinical outcomes associated with claudin-4 expression also differ by cancer type, where high expression is associated with poorer survival in BRCA, STAD, OVCA, and endometrial cancers but longer survival in PAAD (Konecny et al., Reference Konecny2008; Lanigan et al., Reference Lanigan2009; Tsutsumi et al., Reference Tsutsumi2012; Liu et al., Reference Liu2015; Martin de la Fuente et al., Reference Martin de la Fuente2018). As with cadherin-1, loss or gain of cadherin-4 does not simply weaken tight junctions; it reprograms how epithelial cells interpret adhesion, polarity, and mechanical cues.
Other claudins may also impact cancer progression, but additional data are needed to elucidate the functional roles of each and determine what dictates whether they function as suppressors or promoters (Tabaries and Siegel, Reference Tabaries and Siegel2017).
Caspase 8
Encoding caspase 8, a cysteine–aspartate protease that initiates extrinsic apoptotic signaling, human CASP8 is located on chromosome 2, while mouse Casp8 is on chromosome 1. Caspase 8 was discovered through convergent efforts of apoptosis researchers via cloning or mass spectrometry analysis of molecules that bind FADD (Fas-associated death domain) (Boldin et al., Reference Boldin1996; Muzio et al., Reference Muzio1996). Caspase 8 is the cleaved product of procaspase 8, which exists as an inactive zymogen prior to activation and recruitment to DISC (death-inducing signaling complex), enabling it to cleave downstream executioner caspases and other substrates such as Bid. Germline mutations in CASP8 cause immunodeficiency with the hallmarks of defective apoptosis and immune activation (Chun et al., Reference Chun2002; Niemela et al., Reference Niemela2015). Complete knockout of caspase 8 is embryonic lethal but mouse models with lineage-specific loss of caspase 8 replicate aspects of human immune pathology, underscoring its key roles outside of cancer (Salmena and Hakem, Reference Salmena and Hakem2005). Loss or silencing of caspase 8 in tumor cells allows them to evade death receptor-mediated apoptosis, particularly during anoikis, immune surveillance, and vascular transit (Hopkins-Donaldson et al., Reference Hopkins-Donaldson2000, Reference Hopkins-Donaldson2003).
By maintaining death receptor-mediated apoptotic competence, caspase 8 suppresses metastasis and opposes the cancer hallmark of resistance to cell death. Restoration of caspase 8 in neuroblastoma cells with low endogenous expression led to suppression of metastasis to bone marrow and lungs of chick embryos (Stupack et al., Reference Stupack2001, Reference Stupack2006). Neural crest lineage-specific knockout of caspase 8 in the Th-MYCN mouse model of neuroblastoma increased metastasis to bone marrow without affecting primary tumor growth (Teitz et al., Reference Teitz2000, Reference Teitz2013). Also, lack of caspase 8 in the RP mouse model of LUSC led to increased liver metastases (Androulidaki et al., Reference Androulidaki2025). The impact of maintaining extrinsic apoptosis as a suppressive mechanism in metastasis is supported by evidence that TRAIL, which functions upstream of caspase 8 to initiate apoptosis, also demonstrates tumor suppressive and metastasis suppressive roles (Grosse-Wilde and Kemp, Reference Grosse-Wilde and Kemp2008; Grosse-Wilde et al., Reference Grosse-Wilde2008; Johnstone et al., Reference Johnstone2008). This was further demonstrated by caspase 8 mutations in HNSC which potentially influenced TRAIL-mediated apoptosis and cytokine activity (Cui et al., Reference Cui2021). Inactivation by mutation or silencing of caspase 8 is indicative of decreased survival in HNSC (Uzunparmak et al., Reference Uzunparmak2020; Lu et al., Reference Lu2025b) and LIHC (Peng et al., Reference Peng2023a).
However, under some contexts such as when apoptosis is defective, caspase-8 paradoxically promotes migration via noncatalytic interactions. Aside from its roles cleaving other caspases, caspase-8 interacts with focal adhesion and early endosome proteins, resulting in integrin and adhesion recycling at the cell surface (Graf et al., Reference Graf2014). Such nonapoptotic functions of caspase 8 may explain contradictory findings in which caspase 8 appears to instead support metastasis (Mandal et al., Reference Mandal2020). Caspase 8 promoted cell migration in vitro and metastasis in chick embryos when NB7 neuroblastoma cells lacked caspase 3 and were therefore considered nonapoptotic (Barbero et al., Reference Barbero2009). siRNA knockdown of caspase 8 in MDA-MB-231 BRCA cells increased migration and invasion (De Blasio et al., Reference De Blasio2016). Finally, elevated expression of caspase 8 correlated with worse survival in ESCA (Chai et al., Reference Chai2023). Whether canonical apoptotic or noncanonical roles predominate during metastasis in specific types of cancer remains to be elucidated.
Deleted in colorectal cancer (DCC)
DCC is a transmembrane receptor for netrin (an axon guidance molecule) that was initially identified as a common loss of heterozygosity event in COAD (Fearon et al., Reference Fearon1990). DCC is a receptor that maintains survival when ligand is bound but promotes apoptosis when in the absence of ligand (Mehlen et al., Reference Mehlen1998; Rodrigues et al., Reference Rodrigues2007; Krimpenfort et al., Reference Krimpenfort2012). Netrin-bound DCC interacts with UNC5 (another netrin receptor) allowing activation of multiple pathways involved in regulating migration and cell death via Src, FAK, Rho/Rac, MAPK, and AKT via several crosstalk mechanisms (reviewed in Gespach, Reference Gespach2012).
DCC shows little to no mRNA expression across most cancers (Bartha and Gyorffy, Reference Bartha and Gyorffy2021), though low expression is speculated to not be entirely due to mutation as it is in COAD (Fazeli et al., Reference Fazeli1997). Data from DepMap (Ghandi et al., Reference Ghandi2019, which characterizes cell lines by RNAseq, suggest that cell lines retaining DCC expression are predominantly Ewing’s sarcoma, lung neuroendocrine tumors, and mature B-cell neoplasms.
Genetically engineered mice with both alleles of DCC knocked out were generated by Robert Weinberg’s group (Fazeli et al., Reference Fazeli1997). They found that, while the pups appeared normal, they would die within 24 hours due to inability to nurse. Heterozygous mice failed to develop tumors and exhibited no effect on polyp formation when crossed with APCmin mice. Conditional knockout of DCC in K14-Cre; Trp53flox mice did not affect primary tumor development or survival, but metastases were observed at significantly higher frequency among mice lacking K14-restricted DCC (Krimpenfort et al., Reference Krimpenfort2001, Reference Krimpenfort2012).
Overexpression induced apoptosis in cells in vitro by inducing caspase cleavage (Mehlen et al., Reference Mehlen1998; Krimpenfort et al., Reference Krimpenfort2001, Reference Krimpenfort2012; Mehlen and Furne, Reference Mehlen and Furne2005; Rodrigues et al., Reference Rodrigues2007). Functionally, mutating the caspase cleavage site leads to inactivation of DCC and inhibition of DCC-mediated apoptosis, which enhanced cancer progression in APC +/1638mut mice (Castets et al., Reference Castets2011). Protease inhibitor subtilisin treatment in neuroblastoma SHSY5Y was sufficient to reduce protein levels of DCC following transient transfection, as the cells did not express detectable levels of DCC endogenously (Forrest et al., Reference Forrest2016).
Netrin-1, a ligand for DCC, expression has been implicated to be regulated by NFκB signaling, which then inhibits the proapoptotic action of DCC (Paradisi et al., Reference Paradisi2008). Recently, a Netrin-targeted antibody completed a Phase I clinical trial (NCT02977195, no results posted) with the hopes of promoting the tumor suppressive effects of DCC. Targeting of Netrin has shown promising preclinical results, inhibiting EMT and metastases in in vivo cutaneous squamous cell carcinoma mouse models (Lengrand et al., Reference Lengrand2023). However, bulk RNAseq data from this study show that DCC was not expressed in the cells assessed, and therefore, the antimetastatic effects of targeting Netrin appear to occur via a mechanism independent of DCC. Additionally, knockdown of either Netrin-1 or UNC5B was sufficient to inhibit EMT phenotypes.
The results with DCC highlight not only tissue specificity but also may implicate other aspects of metastasis, such as interactions with neurons. Those aspects of DCC function in metastasis have not been measured to the best of our knowledge. Another aspect of DCC function in tumorigenicity and metastasis relates to its chromosomal location near SMAD4 on chromosome 18q. Detailed analysis of loss has not always excluded loss of nearby loci, limiting definitive ascription of DCC as the critical molecule.
Signal transduction in metastasis
Upon stimulation from extracellular moieties, cells initiate signals that interpret that stimulus. Those signals, like the receptors themselves, are regulated by protein–protein interactions and the strength and length of those interactions (Lin et al., Reference Lin2022). Likewise, signals are transduced between organelles to the cell surface and extracellular space. Cellular signaling is frequently depicted as a line or wire when, in fact, it is a web of interconnecting wires. The three-dimensional matrix of signals determines cell behavior. Several different signaling molecules are correlated with metastasis efficiency. But, as with all of the molecules described in this review, their impacts depend on cell context and the presence or absence of cofactors.
Stress-activated pathways (p38, MKK4, MKK6, MKK7)
The class of p38 mitogen-activated protein kinases (MAPK) mediate cellular responses to stress, cell proliferation, differentiation, motility, and survival, akin to Jun N-terminal kinase (JNK) signaling (Wagner and Nebreda, Reference Wagner and Nebreda2009). In cancer, p38 and its upstream kinases act primarily as signal integrators that restrain survival and outgrowth at secondary sites. p38-α (MAPK14) is the predominant isoform in most epithelial cancers but three other isoforms, p38-β (MAPK11), p38-γ (MAPK12), and p38-δ (MAPK13) may play related roles (Wagner and Nebreda, Reference Wagner and Nebreda2009). In some cancers, p38 and its upstream activators, the mitogen-activated protein kinase kinases (MKKs), suppress metastasis; however, partial attenuation, rather than complete loss, of these pathways can promote metastatic progression. This reflects their dual roles in tumor suppression and stress tolerance. Intact p38 signaling enforces dormancy of disseminated cells, promotes anoikis and stress-induced apoptosis, limits plasticity, and antagonizes ERK-driven proliferation at secondary sites (del Barco Barrantes and Nebreda, Reference del Barco Barrantes and Nebreda2012). shRNA knockdown of p38 in 4T1 murine mammary cancer cells increased invasion and migration in vitro and promoted spontaneous metastasis in syngeneic mice (Hong et al., Reference Hong2011, Reference Hong2015). Using an intraperitoneal mouse model of OVCA metastasis, inactivation of kinase activity in either MKK4 or MKK6, but not MKK7, increased peritoneal metastases via impaired downstream phosphorylation of p38 (Hickson et al., Reference Hickson2006). Other experiments demonstrated that MKK4, MKK6, or MKK7 function as metastasis suppressors supporting p38 or possibly JNK as having influence over metastasis. Identification of MKK4 and MKK7 as metastasis suppressors via microcell-mediated chromosome transfer and functional validation was performed by Carrie Rinker–Schaeffer’s lab (Yoshida et al., Reference Yoshida1999; Vander Griend et al., Reference Vander Griend2005). Re-expression of MKK4 or MKK7 suppressed metastasis without affecting primary tumor growth. On the other hand, constitutive heterozygous loss of p38 conferred resistance to metastasis to lung in experimental metastasis mouse models injecting either B16 and LLC syngeneic cell lines (Matsuo et al., Reference Matsuo2006). Other studies demonstrated that p38 knockdown decreased migration and invasion in vitro as well as pulmonary metastasis in vivo (Meng et al., Reference Meng2011). Similarly, deletion of p38 in PyMT mice reduced lung metastatic burden (Wada et al., Reference Wada2017). In other BRCA models, metastasis was reduced by p38 inhibition (Suarez-Cuervo et al., Reference Suarez-Cuervo2004). In the context of BRCA, p38 may promote tumor growth and progression by affecting vasculature (Limoge et al., Reference Limoge2017).
SSeCKS/AKAP12/Gravin
AKAP12 (A kinase anchoring protein 12), SSeCKS (Src suppressed C kinase substrate), or Gravin, was initially identified in a screen investigating potential proteins involved in the autoimmune disease myasthenia gravis (Gordon et al., Reference Gordon1992). AKAP12 (Gravin/SSeCKS) was later reported as a regulator of mitogenic signaling as it was suppressed by Src and Ras signaling (Lin et al., Reference Lin1996). Since then, it has been consistently described as a suppressor of metastasis, primarily in work from the lab of Irwin Gelman (Gelman, Reference Gelman2014).
AKAP12 is a scaffolding protein for protein kinases A and C (PKA/PKC) (Xia et al., Reference Xia2001). Early studies of AKAP12 in cancer first marked it as a hotspot deleted gene in PRAD, while expression is maintained in normal prostatic epithelial cells (Xia et al., Reference Xia2001). To inhibit metastasis, AKAP12 impedes podosome genesis via inhibition of RhoA and Cdc42 in prostate cancer cells (Gelman and Gao, Reference Gelman and Gao2006). AKAP12 overexpression significantly but mildly inhibits primary tumor cell growth in nude mice, and cells that eventually grew showed reduced AKAP12 levels (Xia et al., Reference Xia2001). Lung metastases were dramatically reduced in response to downregulated AKAP12 (using a Tet-on expression system) (Xia et al., Reference Xia2001).
AKAP12 re-expression in prostate cancer cells was sufficient to impede spontaneous metastases to lung from a subcutaneous site, as well as via an experimental metastasis assay (Su et al., Reference Su2006, Reference Su2010). Forced VEGF expression could overcome the suppressive effects of AKAP12 which drove an antiangiogenic transcriptional profile through downregulation of osteopontin, tenascin C, angiopoietin, HIF1α, and PDGFRβ (Su et al., Reference Su2006, Reference Su2010). Gelman and colleagues later developed a genetically engineered AKAP12–/– mouse model that developed severe hyperplasia in the prostate (Akakura et al., Reference Akakura2008). Prostate tissue from AKAP12−/− mice exhibited elevated AKT activity indicated by phosphorylation at S473, without drastic changes in total AKT levels (Akakura et al., Reference Akakura2008).
Furthermore, AKAP12 inhibited activation of the MAPK pathway in a PKC-dependent manner. PKC binding of AKAP12 attenuates its interaction with RAF and reduces downstream MEK/ERK phosphorylation (Su et al., Reference Su2010). Specifically, PKCα and PKCδ were activated in AKAP12−/− fibroblasts to inhibit Lats-mediated senescence by PKCδ. PKC interaction with AKAP12 is increased during cell confluency leading to a reduction in PKC activity as a potential mechanism of contact inhibition (Guo et al., Reference Guo2011). AKAP12−/− mice were crossed with prostate-specific Rb knockout mice to assess alterations in PRAD development (Ko et al., Reference Ko2014). These mice displayed increased incidence of prostatic intraepithelial neoplasia, and high rates of metastasis to draining lymph nodes compared to wild-type or AKAP12−/− mice. In addition to prostate metaplasia, topical skin carcinogen treatment of AKAP12−/− mice drives enhanced induction and progression of squamous cell papillomas (Akakura et al., Reference Akakura2011). The epidermal layers of knockout mice were thicker and displayed a dysplastic phenotype with enhanced abundance of FAK and phosphorylated ERK.
AKAP12 also plays roles in premetastatic niche formation. Wild-type and AKAP12 −/− mice injected orthotopically with B16-F10 or SM1WT1 SKCM cells showed no alterations in primary tumor growth but developed more peritoneal metastases (Muramatsu et al., Reference Muramatsu2017). Peritoneal fibroblasts from the knockout mice exhibited higher levels of CXCL9/10 thought to chemotactically attract cancer cells via the CXCR3 receptor. AKAP12 −/− mice were predisposed to enhanced metastatic colonization via the premetastatic niche (Muramatsu et al., Reference Muramatsu2017, Reference Muramatsu2018). Lung endothelial cells and fibroblasts of AKAP12 −/− mice were altered leading to enhanced adhesion of melanoma cells to endothelium via an upregulation of E-selectin. Correspondingly, AKAP12 −/− fibroblasts drove E-selectin increase by promotion of STAT3 mediated secretion of VEGF.
AKAP12 transcription is regulated by Src (hence, the alias Src suppressed C kinase substrate), where v-Src promotes SP1/SP3 binding to the AKAP12 promoter along with the co-transcription factor USF1. Transcription is inhibited via HDAC recruitment (Bu and Gelman, Reference Bu and Gelman2007; Bu et al., Reference Bu2011). Another contributor to Src-mediated repression of AKAP12 expression, transcription factor II-I (TFII-I), was identified using a ChIP mass spectrometry screen of proteins bound to the AKAP12 proximal promoter sequence (Bu and Gelman, Reference Bu and Gelman2007). Src-transformed NIH-3T3 cells exhibited elevated TFII-I phosphorylation at Y248. Mutation of this site failed to suppress oncogenic transformation but was sufficient to enhance the gene expression of AKAP12 (Bu and Gelman, Reference Bu and Gelman2007).
CRMP (collapsin response mediator) proteins
CRMP are a family of five (CRMP1-5) cytosolic phosphoproteins that are involved in semaphorin3A signaling and cytoskeletal structure maintenance (Charrier et al., Reference Charrier2003; Yamashita and Goshima, Reference Yamashita and Goshima2012; Cai et al., Reference Cai2017). All five are essential for proper neuronal development in mice (Yamashita and Goshima, Reference Yamashita and Goshima2012).
CRMP1 was first suspected of being a suppressor of cancer metastasis when it was found to be downregulated in a screen for gene expression across invasive LUAD cell lines (Shih et al., Reference Shih2001, Reference Shih2003). Overexpression in invasive LUAD cell lines reduced filipodia generation and Matrigel-transwell invasion (Shih et al., Reference Shih2001, Reference Shih2003). The role of CRMP1 in metastatic PRAD was found to be progressively lower in high-grade cancers (Cai et al., Reference Cai2017). Silencing of CRMP1 led enhanced metastatic phenotypes characterized by increased migration, greater proliferation, and expression of mesenchymal markers with corresponding reductions in epithelial marker mRNA. Conversely, overexpressing CRMP1 caused the opposite effects, including reduced orthotopic tumor growth. A long form CRMP1 (LCRMP1) is associated with metastasis and poor survival in NSCLC patients, and enhanced invasion in culture (Pan et al., Reference Pan2011). LCRMP1 opposes the effect of the short, originally identified, form of the protein by stabilizing actin (Pan et al., Reference Pan2011). This was recapitulated in osteosarcoma cells, where a correlation between LCRMP1 expression and N-cadherin/MMP expression was identified (Hou et al., Reference Hou2016). Another mechanism of LCRMP1 was increased expression of SERPINE1 and promotion of lung cancer angiogenesis when LCRMP1 was localized in the nucleus (Hsu et al., Reference Hsu2025). This latter mechanism was dependent on p53, and it is unclear if the mutated form commonly found in LUAD would alter these results. The regulation of CRMP1 occurs, in part, through connective tissue growth factor (CTGF), where overexpression promotes CRMP1 protein abundance and reduces LUAD colonization in lungs following tail vein injection into SCID mice, though nothing was mentioned regarding metastasis to other organs (Chang et al., Reference Chang2004a). Additionally, CRMP1 can be regulated by miR-187 in STAD models, where miR-187 is overexpressed and promotes migration and invasion (Ren et al., Reference Ren2017).
CRMP2 was reported as a metastasis suppressor, though there are questions since it is described as antitumorigenic and whether the effects are due to the short or long form (CRMP2S CRMP2L, respectively) (Yoneda et al., Reference Yoneda2012). CRMP2 was first identified in a secretome proteomic screen of COAD cancer cell line conditioned media. Expression was abundant compared to normal cells at the transcript level (Wu et al., Reference Wu2008).
The mechanism of CRMP2 is complex and uncertain. Phosphorylation of CRMP2L at S522 by GSK3B inhibits migration by binding and sequestering ROCKII (Morgan-Fisher et al., Reference Morgan-Fisher2013). Phosphorylation status S522 also inhibits p53 expression and promotes evasion of apoptosis in A549 NSCLC cells (Oliemuller et al., Reference Oliemuller2013). However, dephosphorylation by PTP4A3 at T514 inhibits migratory speed in UVM cells in vitro (Duciel et al., Reference Duciel2019). Mutation of both sites shows that both are critical for interaction and stabilization of RECK via inhibiting Wnt and NFκB signaling in BRCA cells (Lin et al., Reference Lin2020). Mutation of serine to alanine (i.e., phospho-dead, S522A) enhances migration, invasion, and adhesion in NSCLC cells in vitro, while phospho-mimetic (S522D) inhibits those phenotypes (Morales et al., Reference Morales2021). In another study CRMP2 (DPYSL2) promoted tumor growth of mesenchymal human breast cancers by reducing STAT3-driven migration and metastasis in NOD-SCID mice via interactions with JAK (Abu Rmaileh et al., Reference Abu Rmaileh2022). It is unclear whether the latter dichotomy is dependent on EMT state of the cells. Furthermore, CRMP2 transcriptional stability can be antagonized by miR-93, a microRNA that, when overexpressed, promotes migration in wound healing assays of PDAC cells (Vila-Navarro et al., Reference Vila-Navarro2020). Another explanation relates to the differing functions of CRMP2 in low versus high glucose/oxygenated environments, where EMT is inhibited by CRMP2 upon metabolic stress. Those conclusions are complicated by reductions in HIF1A and increases in Myc reducing CRMP2A levels (Boukouris et al., Reference Boukouris2022). In a related study, inactivation of CRMP2 was observed in hyperglycemic conditions in colorectal cancer in a cell line-dependent manner (Chang et al., Reference Chang2022b).
Like CRMP2, an early proteomic screen associated downregulation of CRMP4 with advancing stage of PRAD (Gao et al., Reference Gao2010). As with the other CRMP family members, there is evidence of tumor promoting or inhibiting function: CRMP4 is associated with worse overall survival in PAAD (Hiroshima et al., Reference Hiroshima2013). In Clinical Proteomic Tumor Analysis Consortium datasets, CRMP4 is significantly upregulated at the protein level compared to normal tissue in PAAD but downregulated in COAD and LUSC (Uhlen et al., Reference Uhlen2015; Li et al., Reference Li2018a). Some activity is thought to be associated with its ability to sequester RhoA activity (Zhou et al., Reference Zhou2015b; Li et al., Reference Li2018a).
The bottom line for CRMP functions is that they are isoform- and splicing dependent (Guo and Xia, Reference Guo and Xia2016), promote methylation that is state dependent (Li et al., Reference Li2015a; Gao et al., Reference Gao2017; Huang et al., Reference Huang2018), interactor dependent, and they are dependent on the cell type from which the cancers originate.
Gelsolin (GSN)
Fujita et al. (Reference Fujita1995) first identified a mutant form of GSN, P321H, as a tumor suppressor in Ras-transformed fibroblasts. GSNP321H bound actin monomers better and altered severing and nucleating activities of this actin-binding molecule. In BRCA, recurrent alterations and reduced expression relative to normal tissue have been observed as have mutations and downregulation corresponding to clinicopathological features (Baig et al., Reference Baig2013). The mechanisms for suppressing tumors are varied. GSN suppresses tumorigenicity in STAD (Yuan et al., Reference Yuan2016) cancer through inhibition of p38 signaling. Other reports show the opposite trend – promotion of growth and invasion through the upregulation of p-AKT and p38 pathways (Huang et al., Reference Huang2016; Ma et al., Reference Ma2016; Zhou and He, Reference Zhou and He2023) or EMT (Zhang et al., Reference Zhang2020e). In LUAD, a TGFβ upregulation of GSN results in a cortical actin-rich dormant state that resists cytotoxic lymphocyte killing (Wang et al., Reference Wang2024b). Perhaps relatedly, upregulation of another stress response transcription factor, ATF3, in BLCA cells decreased metastatic capacity in vivo (Yuan et al., Reference Yuan2013). ATF3 can upregulate CDC42 and other actin-related pathways (Niu et al., Reference Niu2025).
The tumor suppressive function is outnumbered by a larger portion of the literature showing GSN as a regulator of metastasis or metastasis-associated phenotypes. GSN was first described as a metastasis suppressor in B16 melanoma cells (Fujita et al., Reference Fujita2001) without markedly altering primary tumor growth. The C-terminal region was required for the antimetastatic effect, implicating specific structural domains in the regulation of motility and invasion. Higher tumor GSN expression correlates with longer metastasis-free survival in ER-positive BRCA patients (Stock et al., Reference Stock2015). Gelsolin in plasma was reported as elevated in stage IV compared with stage I–III COAD patients (Tsai et al., Reference Tsai2012b). GSN overexpression in COAD cells decreased proliferation and invasive capability in vitro (Li et al., Reference Li2016c). GSN and 2′-5′-oligoadenylate synthetase 2 (OAS2) exert opposing effects on COAD dissemination, with each preferentially associated with perineural versus lymphovascular invasion. These genes define distinct invasive routes and microanatomical patterns of spread, refining metastasis risk stratification in COAD and implicating GSN in regulating how and where cancer cells invade and/or metastasize to (Kim et al., Reference Kim2018c).
In general, the mechanisms of GSN in tumor- and metastasis-suppression appear to be due to interference with actin-mediated cellular processes. However, the effects on invasion and metastasis are histotype dependent. For example, GSN expression in HCC correlates with advanced disease and poor patient survival (Zhang et al., Reference Zhang2020). GSN cooperated with actin-related components to enhance invasive and metastatic capacity via EMT-like changes (Deng et al., Reference Deng2015; Zhou and He, Reference Zhou and He2023). Like HCC, PRAD exhibited a prometastatic phenotype associated with gelsolin (Hashimoto et al., Reference Hashimoto2015). In the latter, neurotensin from neuroendocrine-like cells enhanced invasion.
These examples highlight the importance of GSN-interacting proteins. Villin and GSN mRNA expression in primary breast tumors are associated with nodal metastasis status (Borhan et al., Reference Borhan2021). GSN binds directly with Nm23-H1 to inhibits its actin-severing activity (Marino et al., Reference Marino2013). GSN overexpression in orthotopic and experimental metastasis BRCA models increased liver metastasis which was ablated by co-overexpression of Nm23-H1. In PAAD cells, GSN interacts with podocalyxin-like protein (PODXL) to enhance actin-dependent invasion (Taniuchi et al., Reference Taniuchi2016). Disrupting the PODXL–GSN interaction reduced invasive phenotypes. In a BRCA model, GSN interacts with BCL2 to inhibit cell adhesion, spreading, and motility through increased F-actin polymerization (Ke et al., Reference Ke2010). Those results implicate a noncanonical role of BCL2 in actin dynamics. Also, GSN can interact with Cu+2/Zn+2 superoxide dismutase to alter reactive oxygen species (Tochhawng et al., Reference Tochhawng2016), perhaps another signaling mechanism which needs to be further explored in GSN’s role in metastasis.
Another layer of regulation for GSN in tumorigenicity and metastasis relates to its relative abundance in cells, which is regulated, in part, by ubiquitin–proteasome-mediated degradation (Ni et al., Reference Ni2008). Transcriptional expression appears dependent on Ras-Rac signaling (De Corte et al., Reference De Corte2002). Downstream mediators of GSN, such as miR-654-5p and miR-450b-5p, implicate further layers of GSN function (Zhang et al., Reference Zhang2020b).
SHP2 (PTPN11)
SHP2 (Src homology region 2 domain-containing phosphatase 2; Ptpn11 (Protein-tyrosine phosphatase nonreceptor type 11), Syp) was discovered by the Tony Pawson’s lab in 1993 (Feng et al., Reference Feng1993). SHP2 is a tyrosine phosphatase that catalytically dephosphorylates phospho-tyrosines to alter signaling, structure, or stability of proteins that it interacts with (Chan et al., Reference Chan2008; Zhang et al., Reference Zhang2004). In addition to a phosphatase domain, SHP2 also has two SH2 domains, each which interact with intramural binding partners, while only the N-terminal SH2 domain autoinhibits its own catalytic site. Phosphorylation of SHP2 at Y542 and Y580 sterically promote an open, catalytically active conformation.
In most cancers, SHP2 promotes oncogenesis. SHP2 mutations lead to hyperactivation and ‘RASopothies’ which involve elevated RAS activity (Chan et al., Reference Chan2008). SHP2’s role in cancer is predominantly investigated in the contexts of its role in regulating the activity of mutant KRAS by promoting cycling of GTP by dephosphorylating KRAS at pY32 and pY64 (Dance et al., Reference Dance2008; Bunda et al., Reference Bunda2015). RAS proteins are mutated in ~25% of cancers, with KRAS composing ~85% of these (Hobbs et al., Reference Hobbs2016). Despite the importance of SHP2 in regulating KRAS activity, it is demonstrated that SHP2 has minimal effects on the activity of mutant KRAS, while still exhibiting anticancer effects in mutant KRAS models (Chen et al., Reference Chen2016b; Fedele et al., Reference Fedele2018, Reference Fedele2021; Ruess et al., Reference Ruess2018; Zhang et al., Reference Zhang2016).
SHP2 also regulates JAK/STAT signaling via dephosphorylation of STAT3, PLC signaling through SH2 domain mediated stabilization, PD-L1/PD-1 in immune response, and is recognized as one of the few mitochondrially located phosphatases implicating an alternative role in metabolism (Hansen et al., Reference Hansen2024; Kan et al., Reference Kan2024; Bye et al., Reference Bye2025; Hafner et al., Reference Hafner2026; van Vlimmeren et al., Reference van Vlimmeren2026; Chen et al., Reference Chen2022; Guo et al., Reference Guo2017a; Lin et al., Reference Lin1996; Wang et al., Reference Wang2014a; Wang et al., Reference Wang2005; Wang et al., Reference Wang2006).
SHP2 expression, pharmacological inhibition, or point-mutations also implicate SHP2 as a metastasis promoter. In BRCA models, for example, knockdown of SHP2 with shRNA impairs Myc stability and reduces lung metastasis (Amante et al., Reference Amante2023; Qian et al., Reference Qian2025a). While metastasis reduction alone did not extend survival following surgical resection, combined inhibition of PI3K and SHP2 inhibition extended mouse survival. SHP099 (SHP2 inhibitor) also prevented experimental lung metastases in a syngeneic model (Chen et al., Reference Chen2016b; Chen et al., Reference Chen2020a).
Pharmacologic treatment with SHP2 inhibitors impact signaling pathways, some of which impact immune functions. SHP2 inhibition increased the ratio of M1 (cancer-inhibitory) to M2 (procancer) macrophages in the lung and reduced exhausted T cell phenotypes (TIM3/LAG3 positivity). This was further emphasized as a tumor intrinsic mechanism when doxycycline induced shRNA against SHP2 recapitulated the results of the inhibitor. MHC Class I expression increased in response to TNO155 (a SHP2 inhibitor), permitting T cell mediated killing. SHP2 also promotes prometastatic IL-8 secretion via MAPK pathway facilitation in BRCA (Amante et al., Reference Amante2022).
SHP2 can promote HER2 expression in HER2+ BRCA, while shRNA knockdown ablates lung metastasis (Matalkah et al., Reference Matalkah2016; Zhao et al., Reference Zhao2019a). Another mechanism is that SHP2 promotes FAK-mediated, EGF-stimulated migration in BRCA cells (Hartman et al., Reference Hartman2013) Inhibition of AKT (all isoforms) and mTORC with Omipalisib® or mutant-KRAS mediated AKT activation via SHP2 inhibition (SHP099) alone or in combination reduced wound closure in PAAD cells (Mann et al., Reference Mann2016; Bye et al., Reference Bye2025; Smith et al., Reference Smith2020).
SHP2 biology highlights a theme of this review – context matters. Tissue- or organ-selective knockdown shows remarkably different effects. For example, hepatocyte-specific deletion of SHP2 promotes diethylnitrosamine liver carcinogenesis via upregulation of STAT3 mediated signaling (Bard-Chapeau et al., Reference Bard-Chapeau2011). Despite this role of SHP2, loss of SHP2 in genetic models of LIHC through expression of ctnnb1, PIK3CA, or met inhibited tumor burden (Liu et al., Reference Liu2018). In PARD, SHP2 knockdown impairs primary and metastatic tumor growth in vivo (Zhang et al., Reference Zhang2016). SHP2 knockdown inhibits invasion of oral cancer cells in vitro, and in vivo lung metastasis (Wang et al., Reference Wang2014a). The SHP2 inhibitor hexachlorophene inhibits RAS/MAPK pathway activity and PI3K/AKT pathway activity in LUAD cells, impairing migration and invasion (Fu et al., Reference Fu2022). Mutant, constitutively active/gain of function SHP2 (E76K) enhances GBM migration and invasion in vitro and in vivo through activation of CREB (Yang et al., Reference Yang2019a).
Likewise, macrophage specific SHP2 knockout promotes COAD liver metastasis in vivo (Wu et al., Reference Wu2023). This leads to enhanced, prometastatic VEGF, MMP2, and MMP9 production in the liver preparing a premetastatic niche. SHP2’s SH2 domains also interact directly with PD-1 at pY223 and pY248 to inhibit T-cell receptor signaling, providing a mechanism of tumor-extrinsic immune evasion in T cells (Peled et al., Reference Peled2018).
PI3K, AKT pathways
Phosphoinositide 3-kinase (PI3K) defines a family of kinases (Whitman et al., Reference Whitman1985; Toker, Reference Toker2012) that are activated by multiple mechanism, including integrins, cytokine receptors, receptor tyrosine kinases, G-protein-coupled receptors, and CD19 (Carnero et al., Reference Carnero2008; Liu et al., Reference Liu2009). The PI3K family contains four classes: Classes IA, IB, II, and III, each of which with distinguishing structures and functions.
PI3K proteins phosphorylate PtdIns (phosphatidylinositols), phosphorylated lipids with a carbohydrate compound (inositol) group, and two fatty acid chains that act as second messengers in signal transduction that lead to AKT activation (reviewed in Carnero et al., Reference Carnero2008; Manning and Toker, Reference Manning and Toker2017; Degan and Gelman, Reference Degan and Gelman2021; Liu et al., Reference Liu2009) (Table 5). Phosphate addition of PtdIns(4,5)P2 (also known as PIP2) to PtdIns(3,4,5)P3 (PIP3) recruits PDK1 and AKT to the cell membrane allowing their activation. Phosphatase and tensin homolog (PTEN) is a tumor suppressor commonly mutated or downregulated in cancers; PTEN operates in opposition to PI3K by dephosphorylating PIP3 to PIP2 (Cantley and Neel Reference Cantley and Neel1999). Activating mutations in PIK3CA are oncogenic through constitutive AKT activation, while mutant RAS promotes both AKT and MAPK pathways (Giehl, Reference Giehl2005; Stephens et al., Reference Stephens2005; Tsilimigras et al., Reference Tsilimigras2018).
PI3K signaling molecules
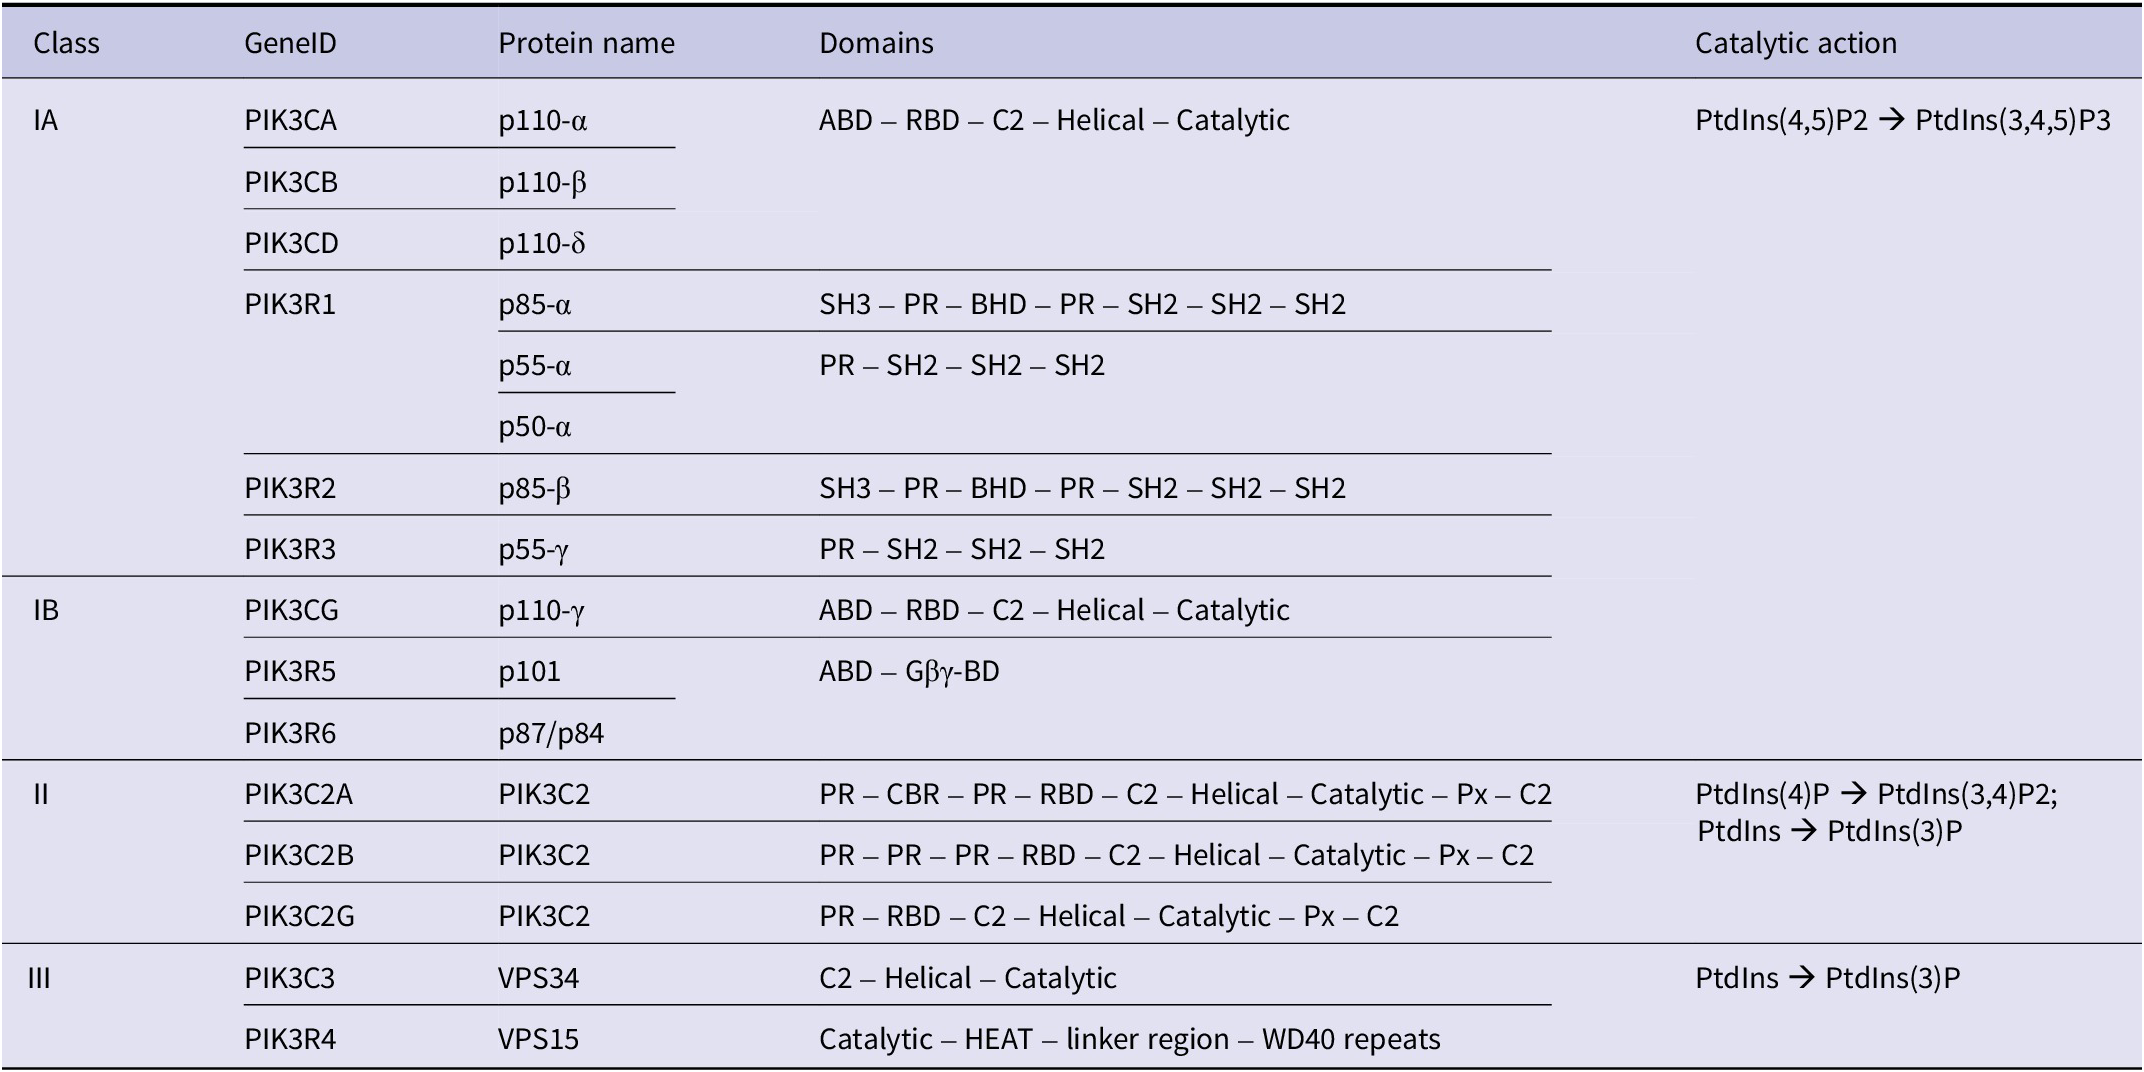
Table 5. Long description
The table is organized into five columns.
Class I A includes:
- P I K 3 C A (p110-alpha), P I K 3 C B (p110-beta), and P I K 3 C D (p110-delta), all containing A B D, R B D, C2, Helical, and Catalytic domains.
- P I K 3 R 1 (p85-alpha, p55-alpha, p50-alpha), P I K 3 R 2 (p85-beta), and P I K 3 R 3 (p55-gamma) with various combinations of S H 3, P R, B H D, and S H 2 domains.
- Catalytic action: PtdIns(4,5)P2 yields PtdIns(3,4,5)P3.
Class I B includes:
- P I K 3 C G (p110-gamma) with A B D, R B D, C2, Helical, and Catalytic domains.
- P I K 3 R 5 (p101) and P I K 3 R 6 (p87/p84) with A B D and G-beta-gamma-B D domains.
- Catalytic action: PtdIns(4,5)P2 yields PtdIns(3,4,5)P3.
Class I I includes:
- P I K 3 C 2 A, P I K 3 C 2 B, and P I K 3 C 2 G (all named P I K 3 C 2) featuring P R, R B D, C2, Helical, Catalytic, and Px domains.
- Catalytic action: PtdIns(4)P yields PtdIns(3,4)P2; PtdIns yields PtdIns(3)P.
Class I I I includes:
- P I K 3 C 3 (V P S 34) with C2, Helical, and Catalytic domains.
- P I K 3 R 4 (V P S 15) with Catalytic, H E A T, linker, and W D 40 domains.
- Catalytic action: PtdIns yields PtdIns(3)P.
Table adapted from Liu et al. (Reference Liu2009) and Safaroghli-Azar et al. (Reference Safaroghli-Azar2023).
Abbreviations: ABD, adaptor binding domain; BH3, Bcl2 homology domain 3; C2, membrane binding domain; CBR, clathrin binding region; Gβγ-BD, G-protein coupled receptor binding domain; PR, proline rich; Px, phosphoinositide binding domain; RBD, Ras binding domain; SH, Src homology domain.
AKT is also a family of three kinases (AKT1, AKT2, AKT3); the term ‘AKT’; originated from a thymoma producing subset of the mouse strain AKR by multiple researchers at the Rockefeller Institute in the 1930s (Xie and Weiskirchen, Reference Xie and Weiskirchen2020). AKT1, 2, and 3 are also known as Protein Kinase B (PKB) α, β, and γ, respectively.
PI3K and AKT are heavily involved in cellular migration through the many pathways it activates in cancer and metastasis. The three AKT isoforms execute their own specific functions and regulatory mechanisms, of which many have been studied in cancer, recently reviewed by Degan and Gelman (Reference Degan and Gelman2021), Agarwal et al., specifically in the context of COAD metastasis (Agarwal et al., Reference Agarwal2017), and Hinz and Jücker in the context of BRCA (Hinz and Jucker Reference Hinz and Jucker2021). Differences in AKT1 acts opposingly, but in accordance with the narrative of this review, as both metastasis suppressor, but as an oncogene as well (Degan and Gelman, Reference Degan and Gelman2021; Hutchinson et al., Reference Hutchinson2001; Hutchinson et al., Reference Hutchinson2004). AKT1 is mostly described as protumorigenic but has roles as an inhibitor of metastasis – while AKT2 is the metastasis promoting isoform (Degan and Gelman, Reference Degan and Gelman2021). The three isoforms were first suspected to have separate, independent functions based on the different phenotypes of knockout mice of each gene (Chin and Toker Reference Chin and Toker2009; Degan and Gelman, Reference Degan and Gelman2021).
Cantley’s group that described PI3K also discovered that AKT activity was regulated by phosphoinositols/PI3K (Franke et al., Reference Franke1997). They specifically found that PtdIns-3,4-P2 could raise the levels of phosphorylated AKT1, promote AKT dimerization activity, and that mutating the pleckstrin homology domain of AKT failed to elicit increases in AKT activity with phosphatidyl inositol treatment.
Activated AKT is phosphorylated at T308 and S473 (Alessi et al., Reference Alessi1997; Manning and Toker, Reference Manning and Toker2017). AKT is phosphorylated and activated by PI3K mediated conversion of PIP2s to PIP3, with PDK1 (PDPK1) as an additional regulating kinase. Although other phosphorylations and post-translational modifications can regulate function, T308 and S473 are attributed as the required and rate-limiting sites for AKT activity (Alessi et al., Reference Alessi1997; Manning and Toker, Reference Manning and Toker2017). The predominant components of the PI3K/AKT pathway are enacted when active AKT phosphorylates FOXO proteins, GSK3, TSC2, NFκB, and MDM2 to impede their inhibitory effects on cell survival, proliferation, migration, and metabolism (Agarwal et al., Reference Agarwal2013a; Amiri and Richmond, Reference Amiri and Richmond2005; Manning and Cantley, Reference Manning and Cantley2007; Manning and Toker, Reference Manning and Toker2017; Hinz and Jucker Reference Hinz and Jucker2019; Islam et al., Reference Islam2023; Qiao et al., Reference Qiao2008). This is not a complete list, as AKT is involved in over 10 major signaling pathways (Qiao et al., Reference Qiao2013) – AKT1 alone was shown to interact with 364 different proteins by an immunoprecipitation–mass spectrometry experiment in Drosophila (Vinayagam et al., Reference Vinayagam2016).
Phosphorylated FOXO transcription factors are sequestered by 14-3-3 proteins in the cytoplasm, preventing the transcription of apoptotic genes (e.g., FASL, TRAIL, BIM, PUMA), and cell cycle regulators (p21, p27) (Brunet et al., Reference Brunet1999; Manning and Toker, Reference Manning and Toker2017). Transcription of glycolysis genes PEPCK and G6PC are initiated, as well as insulin signaling genes (e.g., InsR, IGF1R, IRS2). GSK3 phosphorylation by AKT was discovered in response to insulin-mediated AKT activation (Cross et al., Reference Cross1995). AKT and MAPK coordinate to phosphorylate GSK3 and prevent regulation of c-Myc by marking it for degradation (Saksela et al., Reference Saksela1992; Pulverer et al., Reference Pulverer1994; Cross et al., Reference Cross1995). GSK3 inhibition by AKT also promotes β-catenin mediated Myc transcription. Inhibition of the TSC2 (tuberous sclerosis complex 2) is a mediator of mTORC (mechanistic target of rapamycin) activation (Inoki et al., Reference Inoki2002). Activated mTORC maintains phosphorylated and active AKT in a positive feedback loop (Sarbassov et al., Reference Sarbassov2005). AKT catalytically regulates NFκB activity as well, which further promotes angiogenesis, invasion, and apoptosis evasion (Agarwal et al., Reference Agarwal2017; Amiri and Richmond, Reference Amiri and Richmond2005; Hinz and Jucker Reference Hinz and Jucker2019; Islam et al., Reference Islam2023; Qiao et al., Reference Qiao2008).
PI3K/AKT/mTORC signaling promotes several mechanisms of survival via metabolism, resistance to therapy, survival, or EMT processes (Chin and Toker Reference Chin and Toker2009; Zhou and Huang, Reference Zhou and Huang2011; Degan and Gelman, Reference Degan and Gelman2021; Islam et al., Reference Islam2023; Paskeh et al., Reference Paskeh2023; Leiphrakpam et al., Reference Leiphrakpam2025). PI3K/AKT signaling as a promoter of metastasis has been extensively reviewed in the context of BRCA/PRAD to bone metastasis (Hinz and Jucker Reference Hinz and Jucker2021).
Motility, invasion, and metastasis are enhanced by AKT-mediated phosphorylation of vimentin at S39 (Zhu et al., Reference Zhu2011). Oral squamous cell carcinoma cells display reduced EMT marker protein levels, and increased E-cadherin in response to AKT inhibition (Hong et al., Reference Hong2009). In the absence of Ephrin ligand, AKT promotes migration in glioma and PRAD cells, but Ephrin receptor EphA2 inhibits AKT-mediated migration when stimulated (Miao et al., Reference Miao2009; Lau et al., Reference Lau2023). AKT phosphorylation of EphA2 at S897 occurs in the absence of Ephrin ligand. It was later found that mutation of this site inhibits recruitment of the GEF (guanine nucleotide exchange factor) Ephexin4, and impairs migration and apoptosis resistance in COAD and PRAD cells (Kawai et al., Reference Kawai2013; Lau et al., Reference Lau2023). Coordination of AKT/mTORC and MAPK-interacting proteins 1 and 2 (MNK1/2) leads to phosphorylation eukaryotic of initiation factors (eIFs) that promote gene expression of metastasis and migratory genes in several cancers (reviewed in Lineham et al., Reference Lineham2017).
Many inhibitors of AKT (pan-AKT inhibitors) lack specificity to individual isoforms, but some do show differential inhibitory efficacy between isoforms (Degan and Gelman, Reference Degan and Gelman2021). Studies using AKT/mTORC inhibitors affect metastatic properties, but it is important to consider isoform specificity. Mechanistic studies have elucidated the effects of specific isoforms in metastasis promotion and suppression. AKT1 activation in PAAD increases IGF-IR expression in a positive feedback loop that leads to activation of AKT2, as well, promoting β1-integrin mediated migration (Chin and Toker Reference Chin and Toker2009; Tanno et al., Reference Tanno2001). PyMT mice with constitutively active AKT1 develop mammary tumors with reduced latency, but no differences in metastasis development compared to AKT-wild-type PyMT mice (Hutchinson et al., Reference Hutchinson2001). Note: the authors do not specify which AKT isoform; however, Irie and colleagues implicate AKT1 (Irie et al., Reference Irie2005). Accordingly, overexpression of AKT1 in human BRCA T4-2 cells enhanced in vivo tumor growth, but reduced in vitro migration and invasion (Liu et al., Reference Liu2006). Among isoforms, AKT1 has the unique capacity to regulate the cytoskeletal protein, Palladin – Palladin phosphorylation by AKT1 acts in an antimigratory fashion (Chin and Toker Reference Chin and Toker2010). AKT1 promotes nuclear factor of activated T cells (NFAT) proteasomal degradation via GSK3 inhibition, preventing promigratory transcriptional activity in BRCA cells (Yoeli-Lerner et al., Reference Yoeli-Lerner2005; Yoeli-Lerner et al., Reference Yoeli-Lerner2009). AKT1 and AKT3 shRNA treatment increases BRCA cell migration, while AKT2 shRNA reduces migration, but only in some contexts (Chin et al., Reference Chin2014). Other studies of AKT3 knockdown increase migration, but do not change proliferation (Chung et al., Reference Chung2013). AKT1, but not AKT2/3 phosphorylate the promigratory GTPase αRhoC – inhibition of AKT1 by siRNA actually reduced invasion of BRCA cells with high αRhoC levels, while AKT2/3 had no effect (Lehman et al. Reference Lehman2012). αRhoC high BRCA cell invasion was reduced by AKT2 siRNA but not siAKT1. ShRNA against AKT1 also enhanced matrix invasion in vitro (Brolih et al., Reference Brolih2018). AKT1 null TNBC cells also display enhanced migration through Boyden chambers (Kempska et al., Reference Kempska2023).
In OV studies, however, AKT1 silencing reduces migration and invasion (Meng et al., Reference Meng2006). LIHC studies have demonstrated AKT1 phosphorylation dependent on Leucine-rich repeat-containing 1 (LRCC1) expression promotes VEGF secretion, migration, and invasion (Liu et al., Reference Liu2025). AKT1 activation in osteosarcoma cells promoted migration and invasion in vitro and lung metastasis in vivo through regulation by miR-19a and RhoB (Zou et al., Reference Zou2018). Constitutively active AKT1 induction in a nonmetastatic MSKC mouse model promoted brain and lung metastasis formation in vivo (Cho et al., Reference Cho2015a). Similar results were observed in PAAD KrasG12D/+ mice, where constitutively active AKT1 accelerated in vivo metastasis formation (Albury et al., Reference Albury2015).
Human COAD cells with AKT1 or AKT2 knocked out display reduced clonogenicity and liver metastasis (Ericson et al., Reference Ericson2010). Following up, RNA sequencing revealed specific transcriptional profiles altered by ablation of the separate isoforms (Haggblad Sahlberg et al., Reference Haggblad Sahlberg2017). Another COAD study showed no effect of AKT1 knockdown, but AKT2 shRNA inhibited metastasis to the liver (Agarwal et al., Reference Agarwal2017). The first study utilized splenic injections, while the second used an orthotopic method. Knockdown versus knockout efficacy, or cell lines used could be a contributing factor in this discrepancy as well. In a neuroblastoma model, siRNAs against AKT1 and 3 failed to alter N-myc protein levels, while AKT2 inhibition suppressed N-myc levels, in vitro migration, and in vivo liver metastasis (Qiao et al., Reference Qiao2013).
It was recently shown that a tamoxifen inducible, systemic AKT1 knockout in MMTV-ErbB2 mouse model reduced tumor metastasis to the lung compared to AKT1 competent mice (Chen et al., 2020). The authors elegantly demonstrate that systemic AKT1 loss inhibits metastasis via stromal AKT1 mechanisms, specifically lung neutrophil derived angiogenesis to promote extravasation and colonization.
Angiopoietin-1 (Ang-1) is a strong promoter of angiogenesis. Another mechanism by which PI3K/AKT is implicated as a tumor-extrinsic metastasis promoter is by Ang-1 activating endothelial cell PI3K/AKT pathways via the Tie2 receptor, promoting survival of endothelial cells in the TME (Kim et al., Reference Kim2000). VEGF also promotes endothelial cell survival and sprouting by activating AKT and ERK pathways (Liu et al., Reference Liu2000). It is specifically the AKT1 isoform that regulates this endothelial cell VEGF-mediated migration in an mTOR dependent fashion (Chen et al., Reference Chen2005; Phung et al., Reference Phung2006; Graupera et al., Reference Graupera2008; Davies et al., Reference Davies2019).
PI3K/AKT activity can be stimulated by a plethora of cytokines, growth factors, cell contact events, or intracellular signaling (Carnero et al., Reference Carnero2008; Liu et al., Reference Liu2009). Specific evidence of regulating events of AKT activity and outcomes on metastatic behavior have been found, and a few are described here. Inhibition of the TGFβ receptor suppresses AKT phosphorylation in BRCA subcutaneous tumors (Futakuchi et al., Reference Futakuchi2019). TNF-related apoptosis-inducing ligand receptor 2 (TRAIL-R2) promotes AKT phosphorylation and bone metastasis of BRCA cells (Fritsche et al., Reference Fritsche2015). The adipocyte hormone, leptin, can induce AKT activity to promote PAAD migratory activity, and obesity promotes PAAD-liver metastasis in vivo by splenic injection (Mendonsa et al., Reference Mendonsa2015a). Bone-marrow mesenchymal stem cells conditioned media promotes migration of PRAD cells and AKT phosphorylation (Mognetti et al., Reference Mognetti2013). In addition, cancer cell-induced tumor microenvironment acidosis can promote AKT activity driving NFκB activation and expression, inviting metastatic phenotypes of promoting invasion in COAD and BRCA models (Yang et al., Reference Yang2019b). RUNX2, a metastatic regulator, contributes to AKT activation in several cancers (Cohen-Solal et al., Reference Cohen-Solal2015). In PRAD, AKT1 can promote EMT, and is inhibited at the translation level by miR-143-3p (Armstrong et al., Reference Armstrong2023).
It is clear that AKT pathways are a nexus between cellular input from the microenvironment. It is also clear that PI3K and AKT pathways intersect with multiple other pathways in which cells respond to signals. Additionally, it is clear that the PI3K and AKT pathways are involved in tumorigenicity and metastasis. What is not so clear is why the roles of these molecules vary so greatly, depending upon context. More research will be required to delineate the roles for specific isoforms in metastatic progression. Defining how each is differentially regulated and development of isoform-specific inhibitors will be critical to addressing these questions.
HUNK (MAK-V)
In vivo evidence indicates that HUNK promotes metastatic progression in breast cancer models. Hunk-deficient tumors had a dramatically reduced incidence of lung metastases, and re-expression of wild-type Hunk (but not kinase-dead Hunk) restored metastatic potential in orthotopic transplant models, implicating its kinase activity in metastatic behavior (Wertheim et al., Reference Wertheim2009). Subsequent work also demonstrated that HUNK enhances BRCA metastasis in vivo via phosphorylation and stabilization of EGFR, leading to increased EMT, migration, and lung colonization in mouse models (Williams et al., Reference Williams2020). In contrast, HUNK over-expression reduced migration in vitro and metastasis to regional lymph nodes from orthotopically injected BRCA cells in a doxycycline-inducible model (Quintela-Fandino et al., Reference Quintela-Fandino2010). The effect was thought to be via inhibition of cofilin and protein phosphatase 2-A (PP2A). HUNK1 also inhibits COAD EMT (Han et al., Reference Han2023), suggesting another mechanism by which metastasis is regulated.
NDRG1/Drg1/Cap43/Rit42/RTP/PROXY-1
N-Myc downstream regulated gene-1 (NDRG1) is predominantly described as a tumor suppressor but exhibits well studied functions in a variety of physiological phenomena (Ellen et al., Reference Ellen2008; Melotte et al., Reference Melotte2010; Azad et al., Reference Azad2025). Several independent studies characterized NDRG1/Drg1/Cap43/Rit42/RTP/PROXY-1 in the 1990s; however, NDRG1 emerged as the official gene symbol HGNC:7679 (You et al., Reference You2022). DRG1 and NDRG1, despite the similarity in name, were first described independently. DRG1 was described as differentiation related gene-1 in COAD cells as increased during differentiation (van Belzen et al., Reference van Belzen1997, Reference van Belzen1998) and PRAD cells upregulated by androgen signaling (Mori et al., Reference Mori2021). Like DRG1, TDD5 was described as an androgen responsive gene in PRAD cells with differential response to testosterone and dihydrotestosterone (Lin and Chang, Reference Lin and Chang1997). Tunicamycin responsive protein (RTP) was described in endothelial cells as induced by tunicamycin, homocysteine, and 2-mercaptoethanol (Kokame et al., Reference Kokame1996). Cap43 was described as a gene whose expression was induced via treatment with nickel compounds (NiCl2, Ni3S2) or okadaic acid which drive increased intracellular calcium levels (Zhou et al., Reference Zhou1998).
NDRG1 functions as both cancer suppressor and promoter. TCGA data show that high expression of NDRG1 correlates with an unfavorable prognosis in BRCA, LIHC and LUAD and glioma while higher expression is associated with favorable prognosis in renal cancers (Uhlen et al., Reference Uhlen2017). Many studies have demonstrated an inverse correlation of NDRG1 expression and patient outcome (Strzelczyk et al., Reference Strzelczyk2009; Soror et al., Reference Soror2024; Wang et al., Reference Wang2024a). Shortly after its discovery, NDRG1 overexpression was found to inhibit BRCA, LUAD, COAD, and BLCA metastasis in multiple mouse models, while primary tumor outgrowth was relatively unaffected. Metastatic properties (in vitro) or metastatic tumor growth (in vivo) were diminished (Kurdistani et al., Reference Kurdistani1998; Bandyopadhyay et al., Reference Bandyopadhyay2003, Reference Bandyopadhyay2004, Reference Bandyopadhyay2006; Kovacevic and Richardson, Reference Kovacevic and Richardson2006). Overexpression reduced in vitro PAAD invasiveness and angiogenesis via downregulation of IL-8, MMP9, and VEGF suggesting a role for NDRG1 in regulating tumor oxygenation and invasion (Maruyama et al., Reference Maruyama2006). In contrast, NDRG1 correlates with poor prognosis and stage in LIHC (Chua et al., Reference Chua2007; Akiba et al., Reference Akiba2008; Cheng et al., Reference Cheng2011; Wang et al., Reference Wang2024a), CESC (Nishio et al., Reference Nishio2008), THCA (Gerhard et al., Reference Gerhard2010), LUAD (Fan et al., Reference Fan2012), TNBC (Jadhav et al., Reference Jadhav2024), UCEC (Ijichi et al., Reference Ijichi2025), and CHOL (Zhang et al., Reference Zhang2012c).
NDRG1 is most extensively studied in neurodegenerative diseases (reviewed in Fang et al., Reference Fang2014; Joshi et al., Reference Joshi2022; Azad et al., Reference Azad2025). Notably in Charcot-Marie-Tooth disease, mutations in NDRG1 were studied, but provided no clues regarding its roles in cancer since there is no evidence of those mutations driving cancer incidence (Ellen et al., Reference Ellen2008; Ibanez-Julia et al., Reference Ibanez-Julia2018). The mechanisms in cancer remain unclear; however, NDRG1 interacts with molecules implicated in EMT and metastasis. NDRG1 interacts with Rab4a to promote recycling of E-cadherin, promoting epithelial phenotypes (Kachhap et al., Reference Kachhap2007). Iron chelators can inhibit EMT specifically via upregulation of NDRG1 in metastatic PRAD cells (Chen et al., Reference Chen2012c). A potential target of NDRG1 is β-catenin (Jin et al., Reference Jin2014). While promoting β-catenin signaling to inhibit EMT could be antimetastatic in some cancers, driving a potent signaling pathway capable of inducing carcinogenesis in other cancer types (e.g., COAD) would be deleterious. In a proteogenomic screen of COAD metastases to the liver, PIM-kinase promoted liver metastasis via NDRG1 phosphorylation at S330 (Zhao et al., Reference Zhao2026). The mechanism demonstrated in this study showed that NDRG1 acts as a metastasis suppressor and pS330 marks it for degradation via ubiquitination. Additionally, NDRG1 suppresses Wnt signaling to inhibit metastatic phenotypes via EMT regulation (Liu et al., Reference Liu2012) while it promotes rather than antagonizes EMT in STAD (Ureshino et al., Reference Ureshino2012).
Another important point regarding NDRG1 is that its cellular functions are dependent upon cellular localization, which varies by tissue type (Fang et al., Reference Fang2014). Thus, in addition to cell type, cellular localization is another variable which is understudied for most of the metastasis-associated proteins reviewed here.
OGR1/GPR68
OGR1 (ovarian cancer G-protein-coupled receptor 1) was so named due to its discovery by cloning from an OV cell line in 1996 (Xu and Casey, Reference Xu and Casey1996). OGR1 is a G-protein-coupled receptor that can bind sphingosylphosphocholine (SPC) driving calcium accumulation and/or extracellular acidity to activate inositol phosphate signaling and cAMP accumulation (Xu and Casey, Reference Xu and Casey1996; Liliom et al., Reference Liliom2001; Xu, Reference Xu2002; Ludwig et al., Reference Ludwig2003; Mogi et al., Reference Mogi2005; Tomura et al., Reference Tomura2005a, Reference Tomura2005b). OGR1 (GPR68) is overexpressed in many cancers yet it exhibits both pro- and antitumorigenic or pro- or antimetastatic roles depending upon context (Justus et al., Reference Justus2024).
OGR1 was first described as a metastasis suppressor in the context of PRAD (Singh et al., Reference Singh2007). Overexpression failed to alter primary tumor growth, but metastasis development was inhibited in mice. Migration was also inhibited in vitro. In OV cells, OGR1 overexpression inhibited proliferation, adhesion, and migration in vitro by promoting binding to ECM proteins fibronectin, vitronectin, and collagens I and IV (Ren and Zhang, Reference Ren and Zhang2011), perhaps by increasing ‘stickiness.’ In breast cancer cells, OGR1 overexpression drove Rho activation to inhibit Rac1 to diminish cell migration in vitro (Li et al., Reference Li2013b).
Subcutaneous injection of PRAD into OGR1 −/− mice inhibited tumor outgrowth, but adoptive transfer of myeloid cells from wild-type mice into OGR1 −/− mice rescued tumor growth in vivo (Yan et al., Reference Yan2014). There could be multiple mechanisms supported by data in different cellular contexts. OGR1 is regulated by hypoxia via HIF1α transcription (de Valliere et al., Reference de Valliere2016). Overexpression in HNSC is suspected to be due to the hypoxic environment of these tumors (Zhang et al., Reference Zhang2020d). OGR1 is also an essential gene for acidity induced PD-L1 expression in HNSC, potentially being a driver of immune evasion in this context (Mori et al., Reference Mori2021). Additionally, a recent study showed inhibition of growth in BRCA cells when OGR1 is depleted in vitro and in vivo by inhibiting acid-induced lipid uptake (Pillai et al., Reference Pillai2022). G-protein-coupled receptors like OGR1 (GPR4, GPR65, GPR132) that respond to pH are implicated as potential tumor promoters in several cancers (Insel et al., Reference Insel2020). OGR1/GPR68 inhibition or knockdown can induce apoptosis in a zebrafish xenograft model of GBM via upregulation of intracellular lipid peroxidation (Neitzel et al., Reference Neitzel2024).
OGR1 can also drive intracellular calcium signaling necessary for motility of medulloblastoma cells via TRPC4 (calcium channel protein) expression. Whether this change in intracellular calcium signaling is responsible for metastasis modulation is still a matter of conjecture. However, multiple studies have demonstrated roles of calcium in metastasis (Alessandro et al., Reference Alessandro1996; McGary et al., Reference McGary1997; Tsuruo et al., Reference Tsuruo1985; Welch et al., Reference Welch1989, Reference Welch1990b). Certainly, other divalent cations are critical for MMP activities (Nelson et al., Reference Nelson2000; Lynch and Matrisian, Reference Lynch and Matrisian2002) and invasion, making such speculation reasonable.
RECK (reversion-inducing cysteine-rich protein with Kazal motifs)
RECK is a cell surface molecule that is frequently downregulated in many cancer cell types (Takahashi et al., Reference Takahashi1998). The original characterization showed that RECK suppresses tumorigenicity by regulating MMP9 via two mechanisms: (1) RECK suppresses MMP-9 secretion, and (2) RECK actively inhibits MMP9 protease activity. RECK is also an interactor with CRMP2 (Lin et al., Reference Lin2013) and is a ubiquitously evidenced tumor suppressor. A recent study in PAAD demonstrated that combining pancreas-specific (Ptf1a Cre/+) RECK knockout with KrasG12D/+ led to greater cancer incidence and lowered survival probability while increasing spontaneous liver metastases in this model as well as with an additional p53 heterozygous knockout (Masuda et al., Reference Masuda2023). Reintroduction of RECK expression downregulates multiple EMT genes and increases E-cadherin which results in MET and inhibited metastatic outgrowth. Collectively, RECK is a well characterized metastasis suppressor via inhibition of MMP2/9 and EMT.
In addition to the associations with MMP9 and EMT, we use RECK as an example to highlight upstream regulation of metastasis-associated genes and emphasize how it is critical to consider pathways of metastasis regulation rather than simply single molecules. There are several documented methods of oncogenic downregulation of RECK. RECK has been found to be post-transcriptionally regulated by multiple microRNA (Clark et al., Reference Clark2007; Loayza-Puch et al., Reference Loayza-Puch2010; Nagini, Reference Nagini2012; Alexius-Lindgren et al., Reference Alexius-Lindgren2014; Bautista-Sanchez et al., Reference Bautista-Sanchez2020) (Table 6). Further, HDAC inhibitors can prevent epigenetic repression of RECK transcription (Chen et al., Reference Chen2017). Another evidenced mechanism of transcriptional regulation is via LINC01419, where LINC01419 stabilizes EZH2 RNA driving histone methylation of the RECK promoter (Zhang et al., Reference Zhang2020a). Mutant Ras signaling was shown to drive retinoblastoma binding protein-7 (RbAp46) and DNA methyltransferase 3b (DNMT3b) expression and downstream suppression of the RECK promoter (Chang et al., Reference Chang2004b, Reference Chang2006; Yeh et al., Reference Yeh2015).
microRNA negative regulators of suppressor RECK

Table 6. Long description
The table consists of two columns: micro R N A name and Associated cancer and reference.
* miR-15a: Neuroblastoma (Xin et al., 2013).
* miR-15b-5p: P R A D (Chen et al., 2018c).
* miR-15b/16: B R C A, S K C M, L U A D, C O A D, P A A D (Loayza-Puch et al., 2010).
* miR-16: E C S C (Zhu et al., 2014b).
* miR-21: C O A D (Wang et al., 2019); G B M, B R C A, S T A D (Shi et al., 2013); L I H C (Zhou et al., 2013); C H O L (Namwat et al., 2012).
* miR-25: S T A D (Zhao et al., 2014).
* miR-30b-3p: Glioma (Jian et al., 2019).
* miR-92a: C O A D (Q D Wei et al.); L U A D (Lin et al., 2013).
* miR-92b: L U A D (Lei et al., 2014a).
* miR-96: Iseki et al. (2018).
* miR-135b: L I H C (Li et al., 2015c; Yang and Jiang, 2019).
* miR-182: C H O L (Zheng et al., 2020).
* miR200b/c: C O A D (Pan et al., 2015); B L C A (Cheng et al., 2016).
* miR-210: C H O L (Fu et al., 2023).
* miR-221: Papillary thyroid carcinoma (Wei et al., 2019c); C O A D (Qin and Luo, 2014).
* miR-372/373: B R C A, S K C M, Lung, C O A D, P A A D (Loayza-Puch et al., 2010).
* miR-374b-5p: Xie et al. (2014).
* miR-375: C O A D (Wei et al., 2019a).
* miR-590-5p: Oral squamous cell carcinoma (Bao et al., 2021), C O A D (C W Kim et al., 2018); S T A D (Shen et al., 2016).
MTBP (MDM2-binding protein)
MTBP was first identified in a yeast two-hybrid screen and was validated for binding to MDM2 in mammalian cell lines by immunoprecipitation (Boyd et al., Reference Boyd2000). The authors demonstrated that MTBP transfection was sufficient to inhibit cancer cell line growth via G1 cell cycle arrest, and this could be overcome by overexpression of MDM2. MTBP was subsequently shown to regulate MDM2-mediated p53 degradation (Brady et al., Reference Brady2005). MTBP also promotes expression of Myc transcriptional targets in BRCA, where MTBP expression was higher in patient samples and correlated with impaired survival (Grieb et al., Reference Grieb2014a; Grieb et al., Reference Grieb2014b). MTBP also forms a complex with replication proteins Treslin and TopBP1 which mediates recruitment of PCNA to chromatin during S-phase; this led to longer S-phase due to slower replication when MTBP was silenced (Boos et al., Reference Boos2013). A study on DNA damage control found that replication fork speed was increased in response to knockdown of MTBP or Treslin to drive induction of DNA damage response pathways which could cause the previously observed increase in S-phase time (Maya-Mendoza et al., Reference Maya-Mendoza2018).
MTBP has demonstrated both pro and antitumorigenic roles in primary disease, while in metastasis studies, has only been observed as a metastasis suppressor (Li et al., Reference Li2025a). Homozygous knockout of MTBP is embryonic lethal in mice (Iwakuma et al., Reference Iwakuma2008). MTBP+/− mice live longer and have an overall reduced cancer incidence while developing lymphomas (Grieb et al., Reference Grieb2016). Iwakuma et al., demonstrated that heterozygous MTBP+/− mice combined with p53+/− genotype display enhanced development of metastases. Fibroblasts derived from these mice exhibit enhanced migratory capacity in vitro (Iwakuma et al., Reference Iwakuma2008). In an osteosarcoma model, MTBP inhibited ACTN4-mediated in vitro cell migration and in vivo metastases through downregulating expression of ACTN4 and directly impeding ACTN4-F-actin bundling (Agarwal et al., Reference Agarwal2013b). This was corroborated in a LIHC model but also implicated other factors in MTBP metastasis suppressor function. Supporting this idea, ACTN4 manipulation failed to alter migration in some contexts (Bi et al., Reference Bi2015). A study in lung cancer showed that LNC-CRYBG3 promotes MDM2 upregulation, and that MDM2 antagonizes MTBP-mediated inhibition of ACTN4, thereby promoting invasion in vitro and in vivo (Wu et al., Reference Wu2021a). Another mechanism demonstrating metastatic suppression by MTBP shows that MTBP sequesters IPO7 to inhibit pERK translocation to the nucleus, preventing transcription of ELK-1 target genes EGR1, c-fos, and PKCα (Ranjan et al., Reference Ranjan2018). This was further demonstrated in a liver carcinogenesis model where genetically modified mice with reduced expression of MTBP displayed worse survival and increased pERK nuclear localization (Ranjan et al., Reference Ranjan2023).
In clinical samples, MTBP expression was lost in HNSC and was correlated with reduced survival (Vlatkovic et al., Reference Vlatkovic2011). MTBP expression was reduced in LIHC (Bi et al., Reference Bi2015) and corresponded with reduced metastases (Ranjan et al., Reference Ranjan2018). In COAD, MTBP promotes expression of the EMT transcription factor ZEB2, where knockdown of MTBP reduced migration in a ZEB2 dependent manner (Shayimu et al., Reference Shayimu2021).
However, others have shown that MTBP is expressed at a higher level in metastatic LIHC cells (Lu et al., Reference Lu2015) and STAD (Wang et al., Reference Wang2017). Human Protein Atlas shows that high expression of MTBP associated with unfavorable prognosis from TCGA data in LUAD and PAAD cancers. In contrast, stratification of high and low expressing patients in HNSC shows higher expressing MTBP patients have improved survival (Uhlen et al., Reference Uhlen2017). An important caveat to ascribing MTBP’s role in metastasis suggests that p53 mutation status has not been assessed in every study. Since MTBP is an interactor of MDM2, it is unclear whether its role changes based on the context of mutant vs wild-type p53 status.
RKIP (Raf-kinase inhibitor protein)
RKIP (a.k.a., PEBP1, Phosphatidylethanolamine Binding Protein) was first discovered simultaneously as a 23 kDa protein in bovine brain and rat spermatozoa (Jones et al., Reference Jones1983; Bernier and Jolles, Reference Bernier and Jolles1984; Sedivy, Reference Sedivy2011). The first study of RKIP in cancer showed that its localization was excluded from the nucleus in Ha-ras-transformed NIH-3T3 fibroblasts (Satake et al., Reference Satake1989). RKIP is integrated into multiple signaling pathways. RKIP was speculated to be involved in GTP/GDP binding protein mediated signaling based on studies of a highly conserved protein in other organisms (Banfield et al., Reference Banfield1998). RKIP is indeed a binding partner of RAF as assessed in a yeast two-hybrid screen with RAF-BXB (truncated form of the kinase domain) as bait (Bruder et al., Reference Bruder1992; Yeung et al., Reference Yeung2000). RKIP is a competitive inhibitor of the Raf-1/MEK complex which prevents downstream MAPK/ERK signaling (Yeung et al., Reference Yeung2000). RKIP is regulated by PKC family proteins which phosphorylate S153 which, in turn, disrupts binding to Raf leading to ERK activation in response to EGF (Corbit et al., Reference Corbit2003). Phosphorylation shifts RKIP binding from Raf to G-protein-coupled receptor kinase 2 (GRK-2) leading to GRK-2 phosphorylation of GPCR at inhibitory phosphorylation sites (Lorenz et al., Reference Lorenz2003; Lee et al., Reference Lee2022). This PKC-regulated function of RKIP promotes intracellular cAMP accumulation via B-adrenergic receptor signaling when RKIP is phosphorylated and prevented from exhibiting its inhibitory effects on the MAPK pathway. RKIP also antagonizes NFκB pathways by inhibiting IκB kinase activity following TNF stimulation (Yeung et al., Reference Yeung1999) and regulates Notch1 (Noh et al., Reference Noh2016), 14-3-3 (Gu et al., Reference Gu2013), and autophagy (Noh et al., Reference Noh2016) pathways. Interestingly, the differentiation molecule, SOX2, can be regulated by RKIP (Cho et al., Reference Cho2022).
RKIP was first described as a metastasis suppressor in PRAD (Fu et al., Reference Fu2006). Expression is lost or lower in PRAD and, when over-expressed or re-expressed, leads to suppression of metastasis as well as angiogenesis and invasion without altering proliferation rate or soft-agar colony formation in vitro. When RKIP −/− mice were bred to transgenic adenocarcinoma of the mouse prostate (TRAMP) mice, there was reduced tumor latency and enhanced lung metastases (Escara-Wilke et al., Reference Escara-Wilke2015). As in PRAD, forced overexpression of RKIP inhibits, while RKIP suppression promotes in vitro cellular migration/invasion of SKCM (Schuierer et al., Reference Schuierer2004), LIHC (Lee et al., Reference Lee2006), and glioma cells (Martinho et al., Reference Martinho2012) (perhaps via upregulation of miR-98 (Chen et al., Reference Chen2013)).
RKIP is reduced, lost, or associated with poor prognosis in metastases from BRCA (Hagan et al., Reference Hagan2005), SKCM (Schuierer et al., Reference Schuierer2004), LIHC (Lee et al., Reference Lee2006), COAD (Al-Mulla et al., Reference Al-Mulla2006; Minoo et al., Reference Minoo2007; Kim et al., Reference Kim2015), cutaneous squamous cell carcinoma (Zaravinos et al., Reference Zaravinos2009), BLCA (Afonso et al., Reference Afonso2013; Zaravinos et al., Reference Zaravinos2009), PAAD (Kim et al., Reference Kim2010b; Song et al., Reference Song2012), CESC (Hu et al., Reference Hu2011; Martinho et al., Reference Martinho2013a), STAD (Jia et al., Reference Jia2012), ESCA (Birner et al., Reference Birner2012; Guo et al., Reference Guo2012), NSCLC (Yan et al., Reference Yan2012b; Wang et al., Reference Wang2014b), nasopharyngeal carcinoma (He et al., Reference He2015; Yi et al., Reference Yi2016), and GBM (Gimenez et al., Reference Gimenez2015). Accordingly, higher expression of RKIP correlated with extended survival in glioma patients (Maresch et al., Reference Maresch2011). In some cases, lower expression in primary tumors was prognostic for poorer survival and metastasis development. In contrast, RKIP is a significant prognostic marker for metastatic progression in PRAD (Fu et al., Reference Fu2006), COAD (Al-Mulla et al., Reference Al-Mulla2006; Doyle et al., Reference Doyle2013; Zlobec et al., Reference Zlobec2008), and STAD (Li et al., Reference Li2014; Martinho et al., Reference Martinho2013b).
It is important to emphasize that measurement of RKIP expression, like for many signaling molecules, provides an incomplete story. RKIP in its phosphorylated, inactive form, is present in multiple myeloma (Baritaki et al., Reference Baritaki2011; Shvartsur et al., Reference Shvartsur2017). Later studies showed that pS153 RKIP correlated with survival in NSCLC (Huerta-Yepez et al., Reference Huerta-Yepez2011), as well as in SKCM (Cardile et al., Reference Cardile2013), COAD (Cross-Knorr et al., Reference Cross-Knorr2013), BRCA (Al-Mulla et al., Reference Al-Mulla2013), and nasopharyngeal carcinoma (Li et al., Reference Li2016b).
In addition to its roles in metastasis, RKIP is implicated in other cancer-associated phenotypes. RKIP is a critical regulator of drug resistance, where overexpression in DNA-damage resistant BRCA and PRAD cells promotes apoptosis in response to DNA-damage inducing drugs or radiation (Chatterjee et al., Reference Chatterjee2004; Odabaei et al., Reference Odabaei2004; Woods Ignatoski et al., Reference Woods Ignatoski2008). In a similar manner, Rituximab (CD20 monoclonal antibody) treatment of non-Hodgkin’s B-cell lymphoma cells upregulates RKIP expression sensitizing the cancer cells to chemotherapy-induced apoptosis. BCL-XL is repressed by RKIP inhibition of NFκB pathway and repression of the antiapoptotic transcriptional factor Yin-Yang-1 (YY1) to allow Death Receptor 5 expression (Bonavida and Baritaki, Reference Bonavida and Baritaki2011; Vivarelli et al., Reference Vivarelli2022). In contrast, in human insulinomas, RKIP regulates cell cycle, but does not promote apoptosis (Zhang et al., Reference Zhang2012a). This was additionally observed in an OV model, but metastasis was also tested and shown as suppressed in RKIP overexpressing cells (Li et al., Reference Li2008), and shown in a genetically engineered mouse model of PRAD (Escara-Wilke et al., Reference Escara-Wilke2015). RKIP suppresses intravasation by repressing Myc-mediated transcription of LIN28 downstream of its effects on the MAPK pathway (Dangi-Garimella et al., Reference Dangi-Garimella2009; Liu et al., Reference Liu2014a). LIN28 downregulation allows accumulation of the let-7 miRNA which inhibits the translation of High-mobility group AT-hook 2 (HMGA2) (Liu et al., Reference Liu2014a). HMGA2 promotes EMT through increasing transcriptional activity at TGFβ and Snail promoters, as well as expression of other tumor metastasis and signaling tools like MMP, IGFBP2, and syndecan-2 (Dangi-Garimella et al., Reference Dangi-Garimella2009; Ma et al., Reference Ma2009; Beshir et al., Reference Beshir2010; Morishita et al., Reference Morishita2013; Sun et al., Reference Sun2013a; Datar et al., Reference Datar2015a; Kou et al., Reference Kou2018). miR-185 has also been shown to inhibit HMGA2 translation via regulation by RKIP (Zou et al., Reference Zou2016). Just as Snail is regulated by RKIP, Snail is a transcriptional regulator of RKIP in metastatic PRAD cells. Additional transcriptional regulation of RKIP has been shown to be induced by binding of dihydrotestoterone with androgen receptor in prostate cells (Zhang et al., Reference Zhang2012a) and via LncRNA GATA6 signaling (Gong et al., Reference Gong2020). RKIP also interacts with Melanoma Differentiation Associated gene-9 (MDA-9, Syntenin) to inhibit MDA-9 driven FAK/Src mediated migratory phenotypes (Das et al., Reference Das2012).
RKIP expression influences both stromal and tumoral mediated mechanisms of metastatic outcomes (Bainer et al., Reference Bainer2016). RKIP expression in TNBC reduces metastatic phenotypes of tumor-associated macrophages (TAM) (Datar et al., Reference Datar2015b; Frankenberger et al., Reference Frankenberger2015). Patients can be stratified based on RKIP expression for immunotherapy by activating dendritic cells (DCs), i.e., patients with reduced RKIP after vaccination and activation of DC had impaired survival outcomes while those with higher RKIP levels prior to vaccination did not improve (Buschow et al., Reference Buschow2017).
Treatment of PRAD cells with proteasome inhibitor NPI-0052 enhanced RKIP abundance, suggesting a degradation event that can downregulate RKIP (Baritaki et al., Reference Baritaki2009a, Reference Baritaki2009b; Labbozzetta et al., Reference Labbozzetta2015). Indeed, CDK5 phosphorylation of RKIP marks it for degradation via autophagy in Parkinson’s disease (Wen et al., Reference Wen2014). miR-224 directly represses RKIP translation in BRCA, facilitating bone metastasis (Huang et al., Reference Huang2012). STAD models have shown that the microRNAs miR-27a and miR-155 can inhibit translation of RKIP; the miRNA expression is driven by Bmi-1, an oncogene associated with multiple types of cancer metastasis (Kim et al., Reference Kim2004; Katoh and Katoh, Reference Katoh and Katoh2009; Samson and Parvathi, Reference Samson and Parvathi2023; Reyes-Carmona, Reference Reyes-Carmona2025; Spoto et al., Reference Spoto2026).
There are only a few instances in which RKIP has displayed prometastatic activity (Zhu et al., Reference Zhu2005; Ma et al., Reference Ma2009). Merkel Cell Carcinoma intriguingly displays lowered pERK activation and high levels of RKIP, despite being a highly metastatic skin cancer subtype (Houben et al., Reference Houben2006), though pRKIP was not assessed in this study. The procarcinogenic and prometastatic activities are relatively understudied with regard to post-translational regulation and protein stability. There is evidence of degradation of RKIP via autophagy (Wen et al., Reference Wen2014), but in the context of metastasis, RKIP has been investigated thoroughly – providing potential opportunities for treatment.
Kruppel-like factors 4 and 5
KLF4 is a member of a large family of zinc-finger transcription factors. KLF4 both promotes and inhibits cancer progression through various mechanisms – its role as a Yamanaka factor implicates it as a stem cell marker, but some of its transcriptional targets are antitumorigenic/metastatic. KLF4 affects gene expression of a variety of gene targets associated with stemness, cancer progression, and metastasis through inhibiting or promoting expression in different contexts. KLF4 inhibits expression of SPARC (secreted protein acidic and rich in cysteine) (Zhou et al., Reference Zhou2010) and CD44 (Yan et al., Reference Yan2016) while promoting expression of TIMP, E-cadherin, MMP2, β-catenin, and JNK1 expression (Yori et al., Reference Yori2010, Reference Yori2011; Lai et al., Reference Lai2012; Zhang et al., Reference Zhang2012b; Tiwari et al., Reference Tiwari2013; Li et al., Reference Li2017a; Wu et al., Reference Wu2019).
KLF4 is downregulated in COAD and represses cyclin D1 expression by binding its promoter (Shie et al., Reference Shie2000). KLF4 is also downregulated in ESCA (Wang et al., Reference Wang2002), STAD (Wei et al., Reference Wei2005), ESCA metastases (Ma et al., Reference Ma2014b), but it is upregulated in skin squamous cell carcinoma (Chen et al., Reference Chen2008). KLF4 expression is increased in BRCA compared to adjacent-normal tissue (Foster et al., Reference Foster2000) and represses expression of the alpha subunit (LAMA3A) of Laminin-5, which is downregulated in BRCA (Miller et al., Reference Miller2001a, Reference Miller2001b). In PAAD cells overexpression inhibits metastasis in orthotopic models (Wei et al., Reference Wei2008) and forced expression in PRAD cells inhibited migratory function (Wang et al., Reference Wang2010).
BRCA cells have KLF4-mediated stemness and migratory activity (Yu et al., Reference Yu2011). These observations were contradicted when KLF4 negatively regulated Snail expression and EMT in a HER2 model of murine BRCA (Yori et al., Reference Yori2010, Reference Yori2011). KLF4 expression was shown to be associated with BRCA-brain (but not bone) metastases (Okuda et al., Reference Okuda2013). Depletion of KLF4 promoted sensitivity of BRCA cells to the HER2 inhibitor lapatinib, and KLF4 was upregulated in response to lapatinib treatment in vitro (Farrugia et al., Reference Farrugia2015).
It was recently suggested that some of the discrepancy in KLF4 as a metastasis promoter or suppressor could arise from being present at different steps of the metastatic cascade. While KLF4 is predominantly associated as an inhibitor of EMT, upregulation of KLF4 after successful colonization at a secondary site could promote MET (Borrelli et al., Reference Borrelli2024).
Regulation of KLF4 is complex and occurs via many signaling pathways. KLF4 expression in COAD cells can be induced by APC and downregulated by induction of β-catenin signaling (Stone et al., Reference Stone2002), supplementary to the previously mentioned role of KLF4 in regulating β-catenin expression (Zhang et al., Reference Zhang2012b). Further studies showed that this process is dependent on the transcription factor CDX2 to act on the KLF4 promoter (Dang et al., Reference Dang2001). Motility and invasion in some cancers appears to be dependent upon KLF4 expression, where miR-10b inhibited KLF4 translation, driving a more aggressive phenotype (Tian et al., Reference Tian2010; Su et al., Reference Su2014; Xiao et al., Reference Xiao2014). miR-103/107 appears to be a negative regulator in COAD metastasis (Chen et al., Reference Chen2012b). Further, miR-29a inhibits KLF expression in COAD and is associated with progression to metastasis in patients (Tang et al., Reference Tang2014a). In renal cell carcinoma, KLF4 promoters are hypermethylated suppressing expression in a tumor promoting fashion (Li et al., Reference Li2013a).
KLF4 expression can be stimulated by hepatocyte growth factor (Lai et al., Reference Lai2012) and Notch1 via TWIST-mediated expression of Jagged (Chen et al., Reference Chen2014). STAT5A was recently shown to be a transcription factor that represses KLF4 expression in STAD cells; knockdown of STAT5A increased KLF4 expression and inhibited metastatic outgrowth following tail vein injection (Zang et al., Reference Zang2024).
The role of KLF4 in metastasis is not entirely tumor intrinsic. KLF4 drives stemness in HNSC cells via differentiation into endothelial-like cells to promote metastasis (Chen et al., Reference Chen2008). Perivascular cells also upregulate KLF4 prior to increasing deposition of ECM into the premetastatic niche, in a syngeneic melanoma model (Murgai et al., Reference Murgai2017).
KLF5 was first identified as a potential tumor suppressor due to its deletion in PRAD and BRCA (Chen et al., Reference Chen2002; Rozenblum et al., Reference Rozenblum2002). Like KLF4, there is evidence of KLF5 as both a metastatic promoter and suppressor, depending upon the cancer type and steps of metastasis assessed (reviewed in Lusby et al., Reference Lusby2025). The complicated dichotomy of KLF5 depends upon the signaling input, cancer types, or other contexts that dictate its function. In APCmin KRASV12D/+ mice, haploinsufficiency inhibits tumor burden in the small intestine suggesting a pro-oncogenic role for KLF5 (Nandan et al., Reference Nandan2010). Androgen signaling promotes KLF5 expression to drive CXCR4/CXCL12-mediated PRAD cell migration (Frigo et al., Reference Frigo2009). KLF5 downregulation using siRNA inhibits androgen activated CXCR4 expression, demonstrating KLF5 as the mediator between androgen signaling and CXCR4 mediated migration. This was further validated in the context of COAD (Ma et al., Reference Ma2026). The mechanism of KLF5 regulation of CSCR4 expression was further elucidated showing that acetylation of KLF5 at K369 can be induced by TGFβ, and that acetylated KLF5 is essential for PRAD-bone metastasis, but not primary tumor growth (Zhang et al., Reference Zhang2021a).
KLF5 knockdown increases anoikis in BRCA cells (Farrugia et al., Reference Farrugia2015), in part through acting as a transcription factor to increase TNFAIP2 (TNF-induced protein 2) expression, which also promotes migration. This was also observed in nasopharyngeal carcinoma (Qian et al., Reference Qian2025b). THCA and LIHC cells treated with KLF5 siRNA display inhibited migration and invasion, with increased E-cadherin expression in vitro (An et al., Reference An2019; Ma et al., Reference Ma2014). The opposite was observed with overexpression of KLF5. Overexpression of KLF5 also rescues STAD migration and invasion after it was reduced with treatment of the antioxidant crocin (Zhou et al., Reference Zhou2019). Recently, a small molecule inhibitor of KLF5 (ML264) decreased migration of COAD cells in a dose-dependent manner (Huang et al., Reference Huang2020). Collectively, KLF5 is observed as a metastasis promoter in these contexts.
In contrast, KLF5 knockdown in NSCLC cells decreased E-cadherin expression, a potential mechanism to inhibit EMT and reduce migration (Shimamura et al., Reference Shimamura2011). KLF5 overexpression inhibits KIRC in vitro and in vivo invasion, migration and metastasis, respectively (Fu et al., Reference Fu2017). A recent study in PRAD cells showed that KLF5 knockdown enhanced invasion, where IGF/STAT3 signaling was hyperactive in the absence of KLF5 (Ma et al., Reference Ma2026). Alternatively, KLF5 elicits differential effects on Myc transcription dependent on TGFβ treatment (Guo et al., Reference Guo2009; Guo et al.; Reference Guo2009 Yeh et al. Reference Yeh2019): KLF5 knockdown is sufficient to inhibit Myc transcription in the absence of TGFβ, but KLF5 knockdown plus TGFβ promotes Myc transcription. This could contribute to the differentially observed roles as a metastasis promoter or suppressor.
While KLF4 competes with SP1 at promoter sites (Kong et al., Reference Kong2013, Reference Kong2018), SP1 binds and enhances expression of KLF5 (Chen et al., Reference Chen2004). KLF5 has been documented as overexpressed in PAAD cells, and its expression is induced by IL-1β and HIF1α mediated mechanisms in the context of mutant KRAS (Mori et al., Reference Mori2009, Reference Mori2021, Reference Mori2024). Brca-associated protein-1 (BAP1) can deubiquitinate KLF5 to promote its stability and function in BRCA and SKCM (Qin et al., Reference Qin2015; Jia et al., Reference Jia2016, Reference Jia2021; Fu et al., Reference Fu2017). The epigenetic regulator DNA methyltransferase 1 (DNMT1) can hypermethylate the KLF5 promoter, reducing its expression in KIRC cells (Fu et al., Reference Fu2017).
DLC1 (deleted in liver cancer 1)
DLC1 is a member of a larger family of molecules that share Rho GTPase activating protein (RhoGAP) domain, START domain and sterile alpha motif domain. DLC1 is frequently down-regulated in multiple cancers and confers tumor suppressing effects when re-expressed (Popescu and Goodison, Reference Popescu and Goodison2014). RhoGAP molecules are critical regulators of GTP signaling by inactivating GTP-bound Rho proteins, RhoA, RhoB, RhoC, and CDC42. Resulting changes in actin cytoskeleton alters morphology, motility and invasion (Wong et al., Reference Wong2005; Holeiter et al., Reference Holeiter2008; Popescu and Goodison, Reference Popescu and Goodison2014). However, there are also Rho-independent functions of DLC1 (Holeiter et al., Reference Holeiter2008; Barras and Widmann, Reference Barras and Widmann2013). SKCM models show a role for nuclear DLC1 as a metastasis promoter. Knockdown of DLC1 inhibited invasion and metastasis to lung in multiple SKCM cell lines (Yang et al., Reference Yang2020).
GAS1 (growth arrest specific 1)
GAS1 encodes an N-glycosylated, and glycosylphosphatidylinositol (GPI) anchored membrane protein that inhibits cell cycle progression (Del Sal et al., Reference Del Sal1994; Stebel et al., Reference Stebel2000). Despite its primary role in regulating proliferation, GAS1 was reported to be metastasis suppressor of SKCM and STAD cells in experimental metastasis models (Gobeil et al., Reference Gobeil2008; Li et al., Reference Li2016a). Knockout mouse models exhibit developmental defects that do not appear directly related to growth arrest (Lee et al., Reference Lee2001b; Liu et al., Reference Liu2002). Purported mechanisms for exerting these distinct phenotypes include: antagonism of Hedgehog signaling (Lee et al., Reference Lee2001a; Martinelli and Fan, Reference Martinelli and Fan2007); signaling of AMPK/mTOR/P70S6K and EMT (Li et al., Reference Li2016a), angiogenesis (Jimenez et al., Reference Jimenez2014) and apoptosis (Li et al., Reference Li2016a). Importantly, discrimination between growth arrest) (Del Sal et al., Reference Del Sal1992), metastasis, and clinical stage of LUAD, BLCA, and COAD cancers (Jiang et al., Reference Jiang2011; Wang et al., Reference Wang2012b; Sacilotto et al., Reference Sacilotto2015) has not been extensively studied. Likewise, a soluble GAS1 isoform, tGAS1, has recently been discovered (Lopez-Ornelas et al., Reference Lopez-Ornelas2014), but distinct roles in cancer have not been characterized. Treatment of PAAD cells with tGAS1 reduces pERK activation and invasion in vitro (Daniel-Garcia et al., Reference Daniel-Garcia2020). Likewise, TNBC cells displayed reduced angiogenesis with tGAS1 over-expression in orthotopic tumors (Jimenez et al., Reference Jimenez2014).
LIFR (leukemia inhibitory factor receptor)
Chen and colleagues first reported that LIFR functions as a metastasis suppressor in BRCA models (Chen et al., Reference Chen2012). Similar findings have been reported in different BRCA models (Iorns et al., Reference Iorns2012). LIFR expression is downstream of miR-9 and upstream of Hippo/YAP signaling (Luo et al., Reference Luo2015). However, in LIHC models, suppression appears to occur via inhibition of PI3K/AKT signaling (Luo et al., Reference Luo2015). In GBM models, invasion appears to be related to macrophage-derived oncostatin M signaling through LIFR and activation of STAT3 (Hara et al., Reference Hara2021). Those signals are presumed to regulate the EMT-MET state of the cells. LIFR-mediated AKT activation is regulated by ERK phosphorylation of LIFR at serine 1044 (Shao et al., Reference Shao2019), which in PRAD, promotes migration, invasion, and proliferation.
Regulation of invasion
Just as surface adhesion molecules are critical for metastasis, invasion is an essential step for neoplastic cells to dissociate from the primary tumor, enter a transit compartment, and migrate between different tumor microenvironments. Invasion is typically mediated by proteases that renovate the ECM. Proteolytic activity is regulated at multiple levels, leading to differentially observed impacts on metastasis and survival, depending upon the milieu in which they are operating.
Matrix metalloproteinases (MMP) and tissue inhibitors of MMP (TIMP)
In this section, we will use a large class of proteases – the MMP – and protease inhibitors – the TIMP – to illustrate the context-dependency of metastasis genes (gene products). Other classes of proteases are also commonly involved in metastasis and readers are referred to several excellent reviews for more information (Bernacki et al., Reference Bernacki1985; Nakajima et al., Reference Nakajima1988; Duffy, Reference Duffy1992; DeClerck et al., Reference DeClerck1997; Price et al., Reference Price1997; Stephens et al., Reference Stephens1998; Koblinski et al., Reference Koblinski2000; Rochefort et al., Reference Rochefort2000; Sanderson, Reference Sanderson2001; Decock et al., Reference Decock2005; Arvatz et al., Reference Arvatz2011; Mason and Joyce, Reference Mason and Joyce2011; Pawar et al., Reference Pawar2019).
MMP make up a family of secreted (17 total) or membrane bound (6 total) proteases that degrade ECM substrates. There are specific and overlapping substrates throughout the family (Turunen et al., Reference Turunen2017). MMP were first distinguished by their primary substrate, acting as collagenases, gelatinases, stromelysins, and matrilysins. However, most MMP are now recognized to cleave multiple overlapping substrates (Laronha and Caldeira, Reference Laronha and Caldeira2020; Li et al., Reference Li2023). MMP are synthesized in a pro-from, where their protease catalytic sites require a cleavage of the MMP near the N-terminus to free the C-terminal side to interact with and cleave target substrates (Piperigkou et al., Reference Piperigkou2025). Alteration of MMP activity or expression are associated with several pathologies (Laronha and Caldeira, Reference Laronha and Caldeira2020). Genetically engineered knockout mice have been generated for each MMP, and they exhibit a variety of phenotypes ranging from altered presentation of obesity, tumor formation, cardiomyopathies, infection, and other documented phenotypes (Iyer et al., Reference Iyer2012).
The presumptive activity of MMP in metastasis has always been invasion, which is generally correct. However, some MMP have nonproteolytic functions (Shay et al., Reference Shay2015; Piperigkou et al., Reference Piperigkou2025) and many MMP are involved in multiple other steps of the metastatic cascade (McDonnell and Fingleton, Reference McDonnell and Fingleton1993; Chambers and Matrisian, Reference Chambers and Matrisian1997; Fingleton et al., Reference Fingleton1999; McDonnell et al., Reference McDonnell1999; Deryugina and Quigley, Reference Deryugina and Quigley2006; Lynch, Reference Lynch2011; Tauro and Lynch, Reference Tauro and Lynch2018; Winer et al., Reference Winer2018; Gonzalez-Avila et al., Reference Gonzalez-Avila2019; Piperigkou et al., Reference Piperigkou2025).
By archiving known substrates of MMP and TIMP that regulate MMP function, Gonzalez-Avila et al. (Reference Gonzalez-Avila2019) and Piperigkou et al. (Reference Piperigkou2025) categorized their roles in cancers. Both proteolytic and nonproteolytic functions of MMP promote angiogenesis, migration/invasion, intravasation, extravasation, and premetastatic niche formation (Winkler et al., Reference Winkler2004; Shay et al., Reference Shay2015; Quintero-Fabian et al., Reference Quintero-Fabian2019; Piperigkou et al., Reference Piperigkou2025). MMP can also alter adhesion in the contexts of extravasation or colonization (Shoari et al., Reference Shoari2024, Reference Shoari2025; Biswas et al., Reference Biswas2025).
Despite evidence of MMP being drivers of invasion and metastasis, early clinical trials of MMP inhibitors (MMPi) failed to improve patient outcomes (Coussens et al., Reference Coussens2002; Shay et al., Reference Shay2015; Winer et al., Reference Winer2018). There were several explanations for the negative results, including lack of inhibitor specificity, deleterious side effects, and possibly pharmacokinetics and pharmacodynamics (Winer et al., Reference Winer2018). Additionally, MMP enzymatic activity was not consistently measured, making revisitation of MMPi strategy worth revisiting (Fingleton, Reference Fingleton2008; Tauro and Lynch, Reference Tauro and Lynch2018; Winer et al., Reference Winer2018).
As expected, survival generally correlates inversely with mRNA (TCGA) or protein (CPTAC) expression (Table 7). In OVCA, MMP14 serves as a driver of metastasis, but does not appear to be an independent predictor of prognosis (Vos et al., Reference Vos2021). MMP2 and MMP9 are mostly described as prometastatic. MMP2/9 are implicated in metastasis through several mechanisms (Duffy et al., Reference Duffy2000, Reference Duffy2008; Zucker and Vacirca, Reference Zucker and Vacirca2004; Jezierska and Motyl, Reference Jezierska and Motyl2009; Shoari et al., Reference Shoari2024, Reference Shoari2025). In BRCA metastasis to the bone, Tauro and Lynch (Reference Tauro and Lynch2018) review and describe the roles of MMP1, 2, 3, 7, 9, 13, and 14 as metastasis promoters. They further describe how MMP2 is a critical component of each step of the metastatic cascade, through proteolytic cleavage of both matrix substrates, as well as by cleaving pro-forms of protumorigenic cytokines. Similarly, PRAD cells metastasizing to bone utilize MMP3 to promote vascularization at the metastatic site by altering cell signaling in endothelial tube cells (Frieling et al., Reference Frieling2020). Likewise, BLCA MMP2/9 are rate-limiting enzymes of collagen IV destruction to invade the basement membrane prior to intravasation (Black and Dinney, Reference Black and Dinney2007; Watroba et al., Reference Watroba2021).
Human protein atlas potential prognosis description (TCGA Kaplan–Meier plotting from expression) and protein (tumor vs normal) abundance (CPTAC) of MMP in cancer
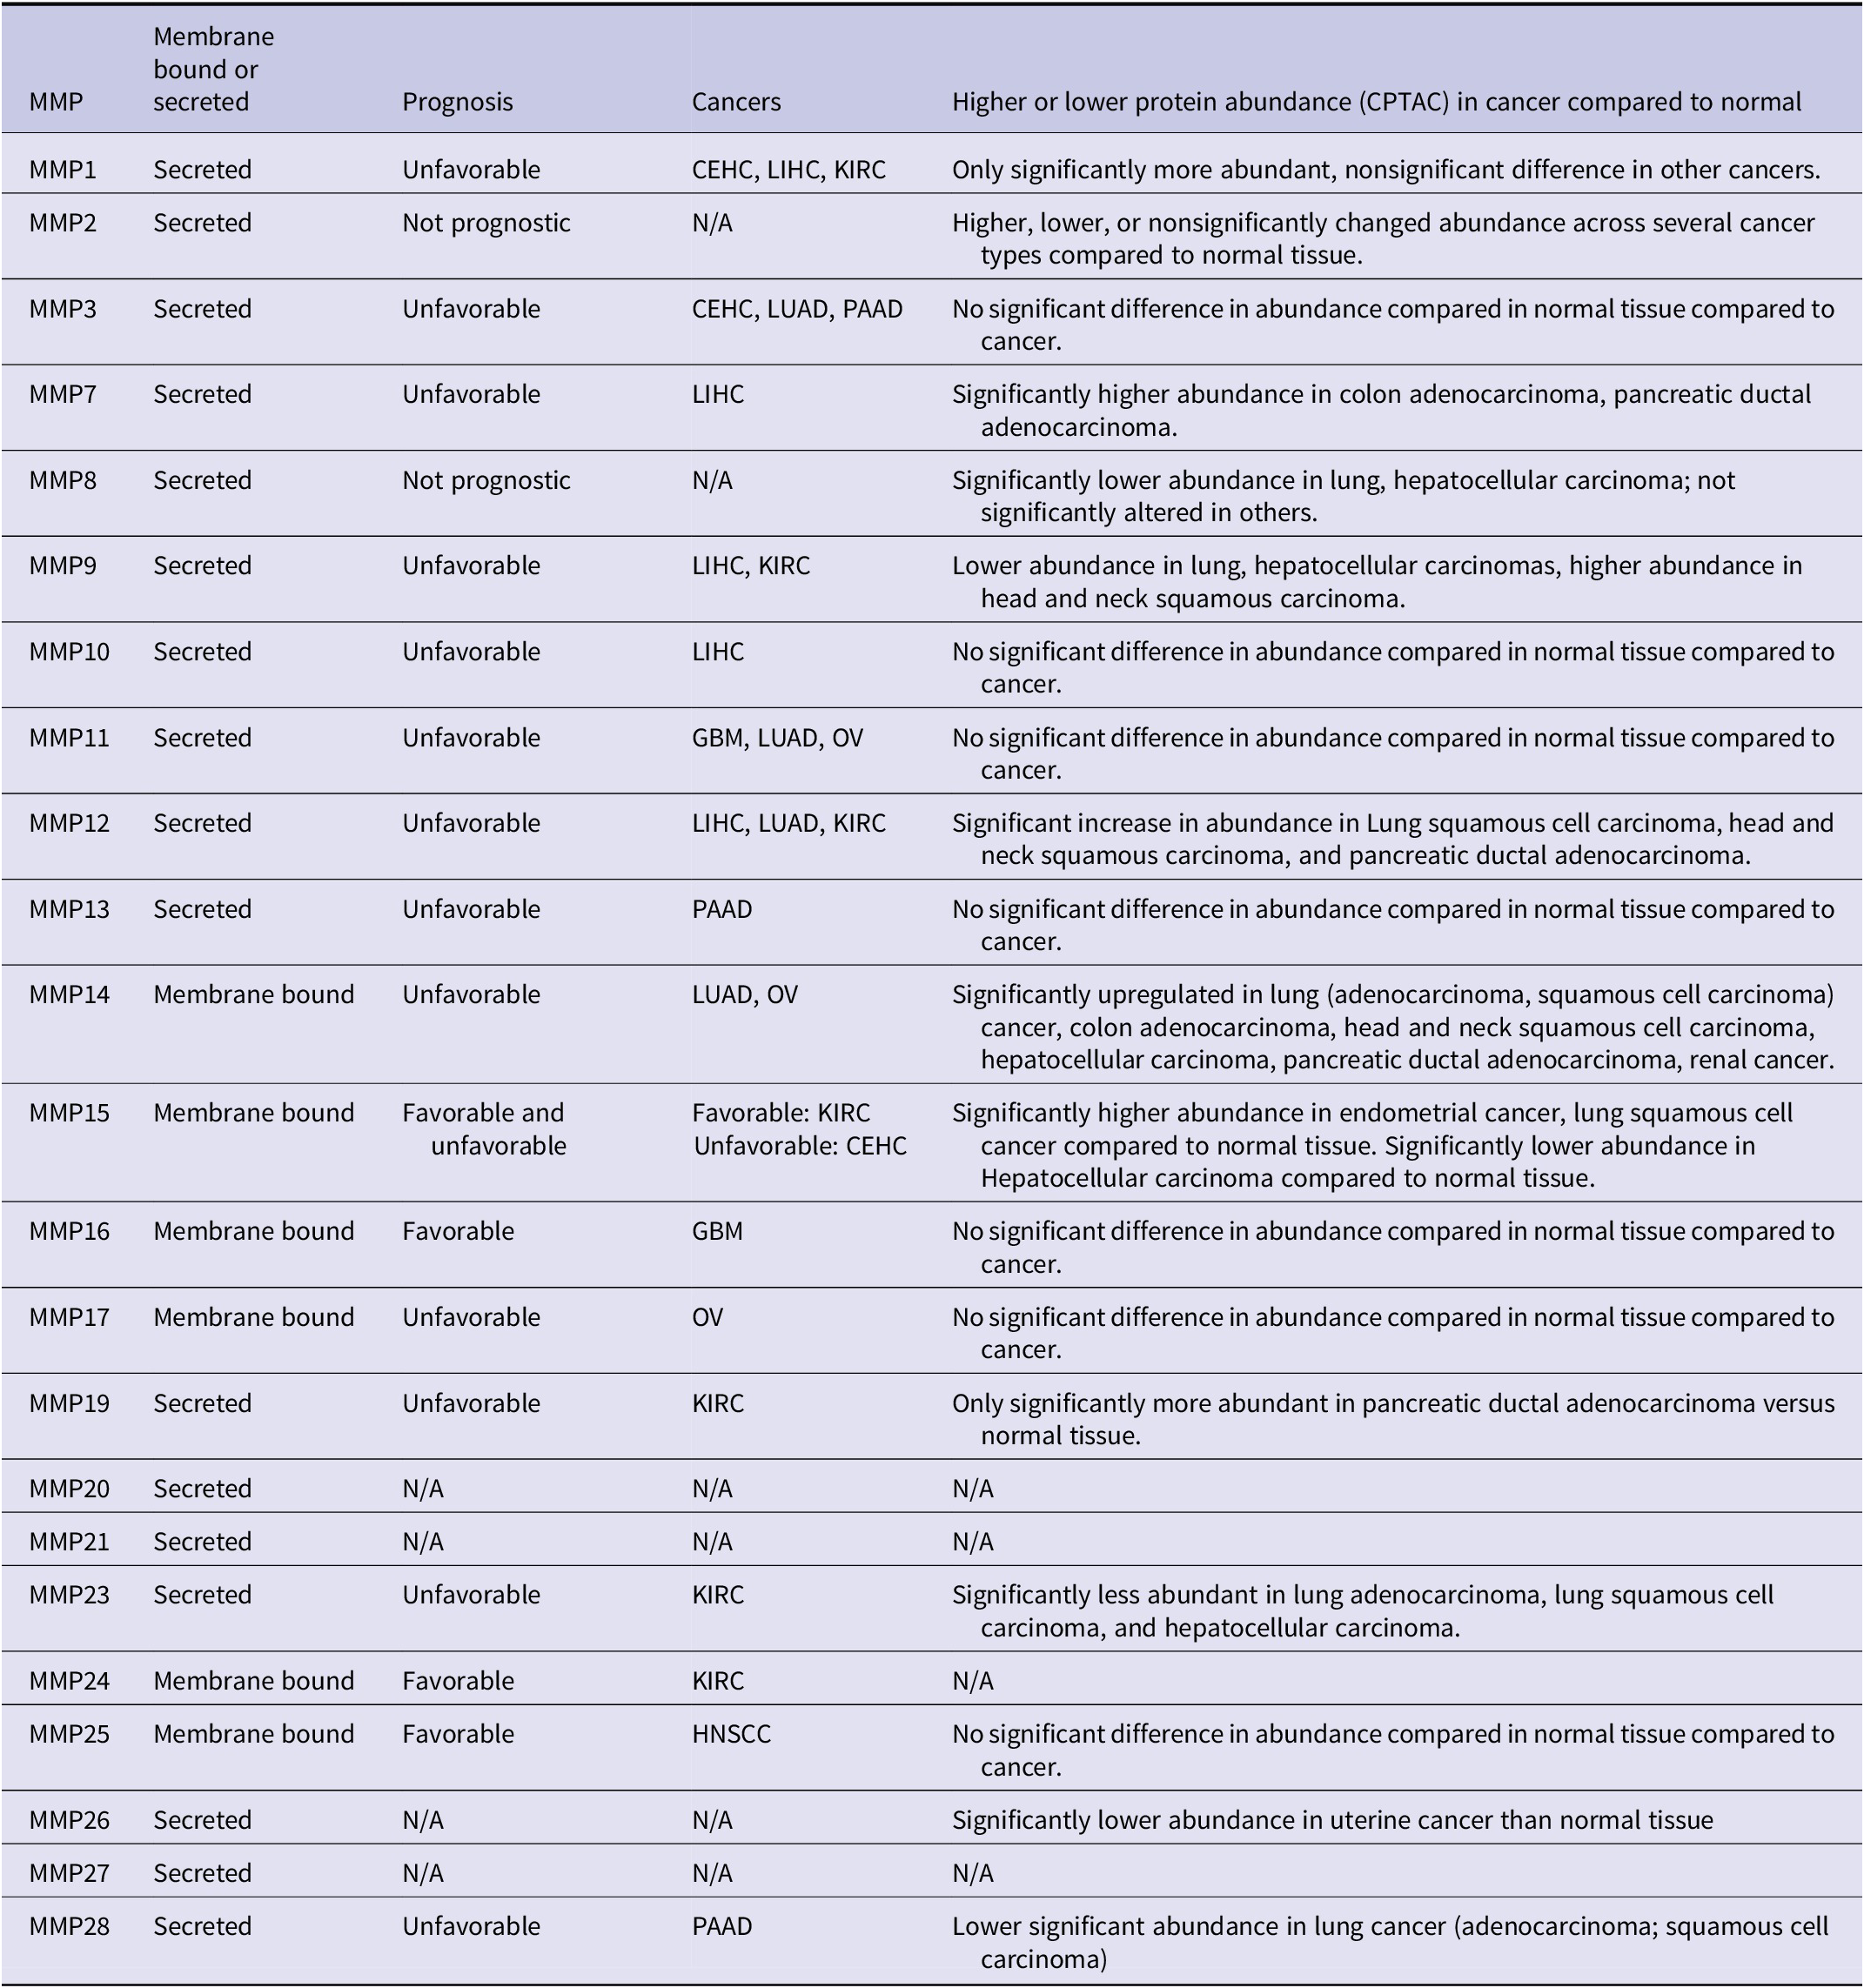
Table 7. Long description
The table consists of five columns: M M P, Membrane bound or secreted, Prognosis, Cancers, and Higher or lower protein abundance C P T A C in cancer compared to normal.
* M M P 1: Secreted, Unfavorable prognosis in C E H C, L I H C, K I R C. Only significantly more abundant in some cancers.
* M M P 2: Secreted, Not prognostic. Abundance varies across several cancer types.
* M M P 3: Secreted, Unfavorable in C E H C, L U A D, P A A D. No significant difference in abundance.
* M M P 7: Secreted, Unfavorable in L I H C. Significantly higher abundance in colon and pancreatic adenocarcinomas.
* M M P 8: Secreted, Not prognostic. Significantly lower abundance in lung and hepatocellular carcinoma.
* M M P 9: Secreted, Unfavorable in L I H C, K I R C. Lower abundance in lung and hepatocellular, higher in head and neck squamous carcinoma.
* M M P 10: Secreted, Unfavorable in L I H C. No significant difference in abundance.
* M M P 11: Secreted, Unfavorable in G B M, L U A D, O V. No significant difference in abundance.
* M M P 12: Secreted, Unfavorable in L I H C, L U A D, K I R C. Significant increase in lung squamous, head and neck, and pancreatic cancers.
* M M P 13: Secreted, Unfavorable in P A A D. No significant difference in abundance.
* M M P 14: Membrane bound, Unfavorable in L U A D, O V. Significantly upregulated in lung, colon, head and neck, hepatocellular, pancreatic, and renal cancers.
* M M P 15: Membrane bound, Favorable in K I R C and Unfavorable in C E H C. Higher in endometrial and lung squamous; lower in hepatocellular.
* M M P 16: Membrane bound, Favorable in G B M. No significant difference in abundance.
* M M P 17: Membrane bound, Unfavorable in O V. No significant difference in abundance.
* M M P 19: Secreted, Unfavorable in K I R C. More abundant in pancreatic ductal adenocarcinoma.
* M M P 20 and M M P 21: Secreted, N A for all other categories.
* M M P 23: Secreted, Unfavorable in K I R C. Significantly less abundant in lung and hepatocellular carcinomas.
* M M P 24: Membrane bound, Favorable in K I R C. N A for abundance.
* M M P 25: Membrane bound, Favorable in H N S C C. No significant difference in abundance.
* M M P 26: Secreted, N A for prognosis. Significantly lower abundance in uterine cancer.
* M M P 27: Secreted, N A for all other categories.
* M M P 28: Secreted, Unfavorable in P A A D. Lower abundance in lung cancer.
MMP can promote signaling pathways by activating prometastatic cytokines or growth factors. They can also cleave ECM to free signaling molecules, degrade of inhibitors, or cleave of prosignaling peptides into their active forms (Kessenbrock et al., Reference Kessenbrock2010). For example, MMP2, 9, and 14 activate TGFβ through cleavage of latent TGFβ binding protein in the ECM. MMP7 can cleave and release RANKL to drive NFκB signaling in bone metastasis (Lynch et al., Reference Lynch2007). MMP7 also cleaves cell-membrane attached heparin-bound growth factor into its soluble form driving internalization and cytosolic signaling of ErbB4 (Lynch et al., Reference Lynch2007). MMP3 and 7 can cleave E-cadherin into a soluble form that acts in a paracrine fashion to promote cellular invasion (Noe et al., Reference Noe2001). In contrast, in oral squamous cell carcinoma, MMP9 can inhibit angiogenic properties through increasing levels of endostatin and angiostatin, impeding endothelial cell proliferation (Vilen et al., Reference Vilen2013). MMP8 can also enhance tumor-ECM adhesion correlating with reduced lung metastases from a syngeneic MMP8 overexpressing SKCM line (Gutierrez-Fernandez et al., Reference Gutierrez-Fernandez2008).
MMP expression is not restricted to tumor cells. MMP9 is secreted by neutrophils to promote prometastatic angiogenesis prior to intravasation from the primary site (Poto et al., Reference Poto2022). Circulating monocytic myeloid derived suppressor cells (mono-MDSCs) secrete MMP9 to promote metastasis to lung (Zhang et al., Reference Zhang2020d, Reference Zhang2020c). VEGFR1+ hematopoietic progenitor cells and bone marrow-derived endothelial cells express MMP9 prior to cancer cell arrival at the site (Kaplan et al., Reference Kaplan2005, Reference Kaplan2006). Stromal MMP9 is an important contributor to COAD metastasis to the liver, where MMP9 null mice displayed reduced metastasis formation by splenic injection of COAD cells (Gorden et al., Reference Gorden2007). Similarly, MMP13 −/− mice display reduced liver steatosis induced by a high-fat diet leading to a subsequent reduction in COAD-to-liver metastases and reduced extravasation (Mendonsa et al., Reference Mendonsa2015b). MMP2 secretion from fibroblasts also drives TGFβ mediated matrix remodeling, promoting BRCA growth in vitro (Bates et al., Reference Bates2015). Kessenbrock et al. (Reference Kessenbrock2010) review other stromal constituents that express proteases (MMP and ADAMs) or their inhibitors (TIMPs).
Expression of MMP across cancers and stroma is regulated by a variety of mechanisms and signaling cascades. Mediation via cytokine signaling, especially in the context of angiogenesis (reviewed in Quintero-Fabian et al., Reference Quintero-Fabian2019). Growth factors EGF, HGF, and FGF3/4 drive expression of either MMP2 or MMP9 in some cancers (Kondapaka et al., Reference Kondapaka1997; Hajitou et al., Reference Hajitou1998; Li et al., Reference Li1998). MMP9, specifically, is well documented to be upregulated through several mechanisms ranging from signaling pathways (NFκB, AKT, β-catenin), hypoxia, interleukins, and microRNA (Andela et al., Reference Andela2003; Barillari, Reference Barillari2020). CD44 stimulation with monoclonal antibodies, but not canonical ligands, can induce MMP2 expression in SKCM (Takahashi et al., Reference Takahashi1999). Meanwhile, IFNγ reduces MMP2 production in RCC cells (Gohji et al., Reference Gohji1998), and astroglioma cells (Qin et al., Reference Qin1998). MMP 2, 9, and 14 are inhibited by RECK: this is regulated by the requirement of RECK glycosylation at N297 (MMP9 inhibited secretion) or N352 (MMP2 inhibited activity) (Sasahara et al., Reference Sasahara2002; Noda et al., Reference Noda2003; Clark et al., Reference Clark2007; Noda and Takahashi, Reference Noda and Takahashi2007). RECK-mediated inhibition of MMP can occur through direct interactions, but RECK expression also negatively correlates with expression of some MMP (Takahashi et al., Reference Takahashi1998).
As enzymes, mere expression is insufficient to address MMP activity. As with other proteases, MMP enzymatic activity is intricately regulated by selective tissue inhibitors of metalloproteinases (TIMP). TIMP constitute a family of four MMP inhibitors. They also interact with integrins, A-Disintegrin And Metalloproteinases (ADAM), and various cytokine/growth factor receptors (Arpino et al., Reference Arpino2015; Eckfeld et al., Reference Eckfeld2019). Importantly, the ratio between MMP and TIMP expression regulates MMP activity which, in turn, determines cancer aggressiveness, staging, and metastasis (Bramhall et al., Reference Bramhall1997; Kugler, Reference Kugler1999; Andela et al., Reference Andela2003).
Despite the inhibitory role of TIMP, TIMP1 expression can be associated with poor prognosis The differences between TIMP family members, their interactors, and roles in signal transduction in cancer are summarized in Jackson et al. (Reference Jackson2017) and cancer-type specific contexts associated with poor prognosis are reviewed in Eckfeld et al. (Reference Eckfeld2019).
In addition to cancer-type specific roles of TIMPs, studies on TIMPs in various physiological contexts exhibit mixed effects across tissues. TIMP1 knockout mice display increased fibrosis in response to injury in the liver, but not fibrosis in lung (Arpino et al., Reference Arpino2015). Inflammatory signaling is, however, elevated in both liver and lung. TIMP2 −/− mice exhibit cardiac collagen disorganization, where TIMP2 regulates MMP14 activity (Kandalam et al., Reference Kandalam2010). TIMP3 −/− mice also display increased degradation of collagen and fibronectin in lung tissues (Leco et al., Reference Leco2001; Martin et al., Reference Martin2003). TIMP3 −/− further leads to kidney and heart fibrosis following injury (Kassiri et al., Reference Kassiri2009a, Reference Kassiri2009b).
Some key principles emerging from analysis of MMP and TIMP in metastasis are: (1) expression levels are not always correlated with activity; (2) proteolytic cleavage is dependent upon stoichiometry of the proteases and their inhibitors; (3) the impact of the proteases and their inhibitors can be direct or indirect; (4) stroma-derived molecules contribute to the promotion or inhibition of proteolysis; (5) different members of each family play tissue-specific roles and, (6) each of the MMP and TIMP have functions that are not necessarily associated with their proteolytic activity. Those principles apply to other protease families as well.
SERPINB5/Maspin
Maspin is a serine protease inhibitor encoded by SerpinB5 (Berardi et al., Reference Berardi2013). So, its first presumed mechanism of action is related to regulation of invasion. Maspin directly binds pro-uPA via its reactive site loop, thereby blocking plasmin-mediated activation and promoting uPA/uPAR internalization which, in turn, limits ECM remodeling (Yin et al., Reference Yin2006). However, Maspin function is significantly more complex (Bailey et al., Reference Bailey2006). Maspin also suppresses tumor cell detachment by stabilizing adhesion complexes. Maspin blocks VEGF- and bFGF-driven angiogenesis and reduces tumor microvessel density. Maspin’s antiangiogenic activity is distinct from its inhibition of tumor cell migration (Zhang et al., Reference Zhang1997, Reference Zhang1999, Reference Zhang2000). SERPINB5 is a cytoskeleton-binding protein that regulates epithelial cell architecture. Loss disrupts actin organization and induces EMT-like changes (altered E-cadherin localization and upregulation of EMT transcription factors) and accelerates microtubule growth. Loss or dysregulation of SERPINB5 may facilitate epithelial plasticity and invasion (da Silva et al., Reference da Silva2025).
Nuclear localization of Maspin is essential for its regulation of tumor growth and metastasis (Goulet et al., Reference Goulet2011). Maspin was initially discovered as a tumor and metastasis suppressor following transfection into MDA-MB-435 cells in nude mice (Zou et al., Reference Zou1994). Suppression of invasion and/or metastasis has been described in PRAD (Abraham et al., Reference Abraham2003; Bernardo et al., Reference Bernardo2011) by reprogramming a subset of HDAC1-regulated genes, downregulating EMT and TGFβ signaling. Maspin suppressed MMP9, uPA, and uPAR, and enforced β1-integrin–dependent polarized adhesion in collagen I–rich environments.
However, in a study of 132 tumor samples from patients with NSCLC, SERPIN5 overexpression in the cytoplasm resulted in poor prognosis (Hirai et al., Reference Hirai2005). Also, SERPINB5 is significantly overexpressed and demethylated in LUAD correlating with reduced overall and progression-free survival. SERPINB5 was likewise correlated with the development of muscle invasive BLCA (Sugimoto et al., Reference Sugimoto2004), CESC (Hao et al., Reference Hao2025), and PAAD (Lim et al., Reference Lim2004; Cao et al., Reference Cao2007). Using LUAD cell lines (A549 and PC9), SERPINB5 knockdown suppressed migration, invasion, and epithelial–mesenchymal transition (EMT), while SERPINB5 overexpression enhanced these metastatic phenotypes. Gene set enrichment analyses linked high SERPINB5 expression to EMT, TNFα–NFκB, IL-17, HIF-1, MYC, E2F, and mTORC1 signaling pathways, suggesting that SERPINB5 promotes metastasis by driving EMT and activating oncogenic and inflammatory signaling programs (Tian et al., Reference Tian2020). Likewise, PAAD metastasis, invadopodia formation and MMP activity were enhanced when overexpressed (He et al., Reference He2023b). Over-expression in COAD cell lines promoted EMT, MMP2 and MMP9, VEGF (Liu et al., Reference Liu2024a).
Stefin A/cystatin A
Another protease inhibitor, Stefin A, belongs to the cysteine protease inhibitor family. Transfection of Stefin A into human ESCA cells reduced cathepsin B and inhibited Matrigel invasion. Overexpression of Stefin A decreased lung metastasis in a mouse xenograft model (Li et al., Reference Li2005). Likewise, re-expression of Stefin A in murine mammary cancer decreased bone metastasis in vivo (Parker et al., Reference Parker2008). Thus, the presumptive mechanism of action is through reduced cathepsin B activity (Withana et al., Reference Withana2012). Supporting this mechanism, shRNA knockdown of cathepsin B decreased lung metastasis in syngeneic mice without affecting the orthotopic mammary tumor growth. In LUAD cells, overexpression of Stefin A suppressed EMT and promoted MET, suggesting an alternative mechanism of action (Ma et al., Reference Ma2018b). Demethylation of DNA increased Stefin A expression in those same cells, suggested DNA methylation as a potential cause of decreased expression in cancer (Wang et al., Reference Wang2021b).
In tissue sections, Stefin A expression is heterogeneous in metastases. It is expressed where there is interaction with stromal cells, but not in the center of metastases. The expression pattern could be due to differential oxygenation, response to external signals from stromal cells, or the loss of ability to produce the molecule (Li et al., Reference Li2005).
Summary and implications
While the list of molecules reviewed here is long, it is still incomplete. We have opted to use several key molecules for which there are relatively abundant data in an attempt to illustrate several key points. Foremost, metastasis is a highly complex, multigenic phenotype. A one gene–one phenotype explanation of metastasis has long been discounted and analysis of the genes and gene products discussed here exemplify that point. Coordinated spatial and temporal gene expression is absolutely essential for cancer dissemination to form secondary foci. Molecules that may be necessary for metastasis are not necessarily sufficient. That metastasis suppressors – defined by their ability to inhibit metastasis without blocking primary tumor development – exist demonstrates that tumorigenicity and metastasis are distinct genetic diseases. The fact that most of the genes and gene products described here have diametrically opposite results in different tumor types highlights that metastasis is indeed a complex, polygenic disease, impinged by combinations of differential transcription, translation, presence or absence of isoforms, post-translational modifications, interactors (at both the cellular and molecular levels), regulators (signaling and epigenetic), protein stability, and protein location.
Single cell analysis, while contributing insights, is also limited because it results in probabilistic predictions since it is currently impossible to know whether a given cell is actually THE 1/<0.00001% of cells that eventually successfully succeed in metastatic colonization. Transcriptomic studies do not necessarily take into account whether a protein encoded by an mRNA is proportionately present. This issue is further complicated by enzymes whose activity is not necessarily proportionate to the number of molecules present and which are regulated by other co-expressed molecules and the stoichiometric relationships of those pairs. Thus, there is a strong danger in extrapolating findings using a single technique.
Complex genetic diseases are contributed to by sometimes 10s to 100s of genes simultaneously. The genetic backgrounds upon which those genes are expressed have profound effects on the efficiency of metastasis. All of the molecules described here function in pathways or complexes with agonistic or antagonistic partners. Discussion of pathways is often oversimplified as linear rather than arbors of branches. Signaling is, in fact, a web of interconnecting pathways. Thus, there are redundancies in the system. By analogy, there are many roads leading to Rome. When blocking one road, cells find ways to circumvent that blockade. Redundancy is one mechanism that results in resistance to antimetastatic therapies or circumvention of metastasis suppressors.
Another limitation of this review is that we have mostly focused on molecules that have functional data associated with them and metastasis. We also acknowledge that many of the data reported here and in cited papers do not always discriminate cancer subtypes. Therefore, readers are cautioned not to extrapolate findings reported here to all subtypes since there are clearly differential effects of metastasis genes that are subtype- or cancer-specific.
To illustrate this point, we compared publicly available datasets examining gene expression data for four metastasis-associated molecules (readers can perform the same analysis with other genes and cancer types) (Figure 2). GSN, BRMS1, NME1, and TIMP4 expressions are examined with their relationship to development of bone or lung metastases. What is clearly illustrated is how correlations of expression and probability of metastasis are positive or negative for each metastasis suppressor, depending upon tumor type. We did not find a single example where a gene is always positively or negatively correlated with metastasis development.
Representative data showing that metastasis regulatory gene expression exhibits conflicting patterns of metastatic efficiency in different cancer types. Data were derived from MetMap500 Relative Metastatic Potential (Jin et al. Reference Jin2020) and Gene Expression (Cancer Cell Line Encyclopedia, CCLE (Ghandi et al., Reference Ghandi2019) was accessed via DepMapPortal (Tsherniak et al., Reference Tsherniak2017). Representative data are shown to demonstrate that gene expression correlation (linear regression) with metastasis (Metastatic Potential as defined in Jin et al. (Reference Jin2020) can differ based on context. Shown are examples significantly (p < 0.05) positively or negatively correlated CCLE gene expression of four metastasis suppressors (GSN, BRMS1, NME1, TIMP4) with MetMap500 metastatic potential to bone (a–c) or lung (d) cancer types. Dotted lines = 95% confidence interval. (a) Correlation of cell line GSN expression with metastatic potential to bone in lung cancer cell lines (black, negative correlation) and peripheral nervous system cancer cell lines (blue, positive correlation). (b) BRMS1 expression correlated to metastatic potential to bone in colorectal cancer (blue, positive correlation) and breast cancer (pink, negative correlation) cell lines. (c) NME1 expression correlated to metastatic potential to bone in colorectal cancer (blue, positive correlation), breast cancer (pink, negative correlation) and brain cancer (green, positive correlation) cell lines. (d) TIMP4 expression versus lung metastatic potential in head and neck cancer (red, negative correlation) and pancreatic cancer (purple, positive correlation) cell lines.

Figure 2. Long description
A four-panel figure displaying linear regression analysis of gene expression versus metastatic potential. All panels use a Y-axis of log 2 scale Relative Metastatic Potential.
Top-left panel: MetMap 500 Metastatic Potential to Bone versus Relative Gene Expression G S N. Lung cancer (black circles) shows a negative correlation (p equals 0.0215). Peripheral nervous system cancer (blue squares) shows a positive correlation (p equals 0.0225).
Top-right panel: MetMap 500 Metastatic Potential to Bone versus Relative Gene Expression B R M S 1. Colorectal cancer (blue circles) shows a positive correlation (p equals 0.028). Breast cancer (pink squares) shows a negative correlation (p equals 0.0106).
Bottom-left panel: MetMap 500 Metastatic Potential to Bone versus Relative Gene Expression N M E 1. Colorectal cancer (blue circles) and Brain cancer (green diamonds) show positive correlations (p equals 0.0214 and p equals 0.0144 respectively). Breast cancer (pink squares) shows a negative correlation (p equals 0.0484).
Bottom-right panel: MetMap 500 Metastatic Potential to Lung versus Relative Gene Expression T I M P 4. Head and Neck Cancer (red circles) shows a negative correlation (p equals 0.0016). Pancreatic Cancer (purple squares) shows a positive correlation (p equals 0.0436).
Each regression line is accompanied by dotted lines representing the 95 percent confidence interval.
What is the take-home message? Our title says it all – metastasis genetic and epigenetic function are context dependent. All molecules regulating metastasis are regulated at multiple levels (epigenetics, transcription, splicing, translation, stability). And most molecules have multiple functions, likely determined by the molecules with which they are associated. The multi-dimensional relationships represent a problem that machine or language learning algorithms can hopefully help solve. Although disheartening in some respects, it is clear that no single gene will explain nor solve the problem of metastasis.
As a result, using these genes as biomarkers to predict probability for developing metastasis has been frustrating and has fallen short of optimistic predictions. We predict that combinations of these molecules will eventually emerge as helpful predictive biomarkers, just like combinations of surface molecules are now used to define immune cells or cancer subtypes. Predictions will also be facilitated by more precise defining of cellular contexts. As single cell analyses of various tumor microenvironments become more well defined, the contexts defining cellular responses will be better defined. Heterogeneity of both the cancer cells and the myriad TME experienced during transport of metastatic cells await more definitive understanding before direct applications will be possible. Importantly, many of the interactions are transient and the cells’ responses are temporary. One must keep in mind that most current technologies allow only ‘snapshots’ rather than ‘video’ of events leading to development of metastasis.
There remains hope that some of the metastasis-associated genes and gene products can become targets for selective treatment (i.e., inhibiting metastasis promoting molecules, protease inhibitors, etc.) or treatments themselves (i.e., metastasis suppressors). Again, that promise will be delayed until the field develops a better handle on regulation and cofactors involved.
Despite the complexity highlighted in this review, increases in the knowledge related to metastasis regulation has already led to improvements in survival and quality of life for patients with many types of cancer. Whereas, 5-year survival with stage-IV cancer was almost unheard of a few decades ago, some patients have survived for decades. As metastasis genetics and epigenetics become increasingly well defined, we expect that outcomes will further improve.
Supplemental material
The supplementary material for this article can be found at https://doi.org/10.1017/S0033583526100201.
Acknowledgments
We are grateful to many colleagues and collaborators for fruitful discussions and apologize to any authors whose work was not cited due to space limitations. We also acknowledge that, despite our efforts to be relatively comprehensive, some papers will have undoubtedly been omitted. To those authors, we apologize.
Financial support
Work reported from our lab has been generously supported by these grants from the National Cancer Institute (CA62168, CA87728, CA134981, CA168524, CA281118, GM103418), Department of Defense (DAMD-17-96-1-6152, DAMD17-01-1-0362, DAMD17-02-1-0541, W81-XWH-07-1-0399), Susan G. Komen for the Cure (SAC110037), National Foundation for Cancer Research, METAvivor Research and Support, Inc., Theresa’s Research Foundation, VesselWork.org, and the Hall Family Professorship in Molecular Medicine.
Competing interests
The authors declare no competing interests.


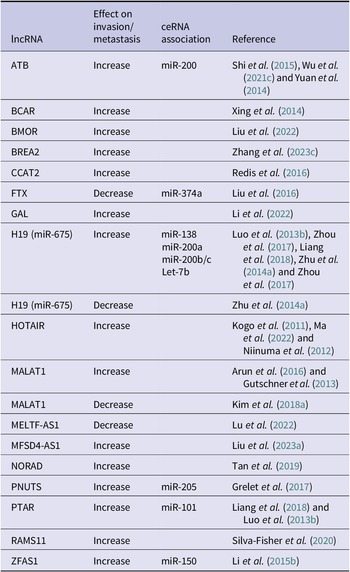
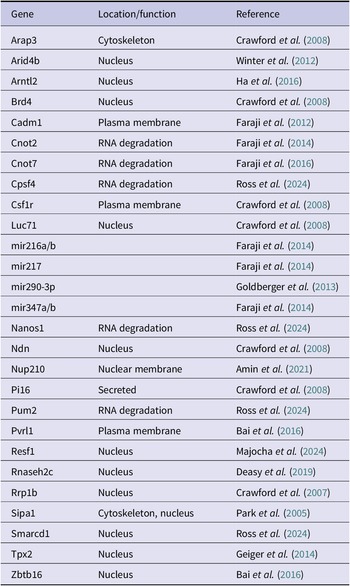
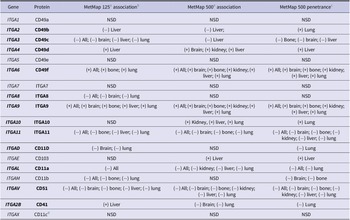
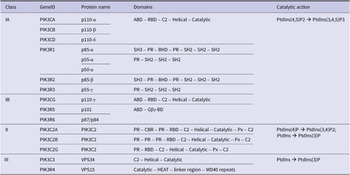
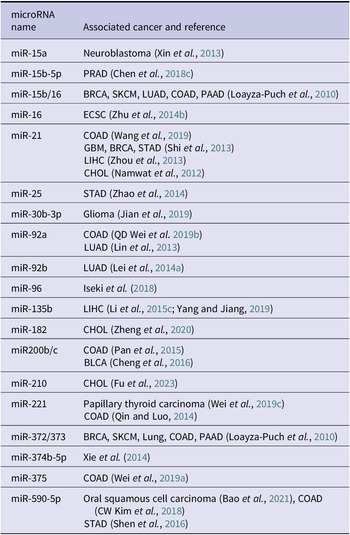

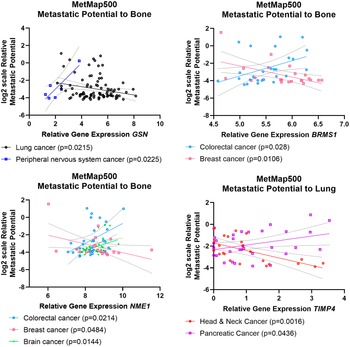


 Open access

