1. Introduction
As part of the process of selecting a global boundary stratotype section and point (GSSP) for the Coniacian–Santonian boundary, Howe et al. (Reference Howe, Sikora, Gale and Bergen2007) suggested that the primary biomarker for this boundary, the first occurrence (FO) of the inoceramid bivalve, Platyceramus undulatoplicatus, occurred later at Olazagutia, Spain, than at Ten Mile Creek, Texas (both candidate GSSP sites), based on other nannofossil and foraminiferal evidence. If one accepts that the micro- and nanno-fossil bioevents are reliable time planes, then the bivalve bioevent is diachronous. However, if one accepts that the bivalve bioevent is a good time plane, the micro- and nanno-fossil events are diachronous. This is a common problem in biostratigraphy. Usually there is no way to decide between the alternatives other than by received wisdom. For example, most palaeontologists would accept that ammonoids or graptolites are better fossils for biostratigraphy than brachiopods or bivalves. However, exceptions must occasionally occur. In discussing the base of the Hettangian Stage (and therefore the base of the Jurassic), Hodges (Reference Hodges1994) argued that relevant primary bioevent, the FO of the ammonite Psiloceras planorbis, was diachronous in sections around the Bristol Channel, SW Britain. One of the events he used in his correlation was the first common occurrence of the bivalve Plagiostoma gigantea. Thus again, at least in part Hodges was judging the reliability of one bioevent on the basis of another bioevent. We believe that we can decide objectively which of the Coniacian–Santonian bioevents is the best time plane (see Section 4 below).
Similarly, most biostratigraphers refer the occurrence of fossils to biozones. Shaw (Reference Shaw1971) argued that using fossils to define biozones and then assigning fossils to those biozones prevents recognition of exceptions or range extensions. He also argued that zonal schemes become refined so that original designations may become obscure with time. Furthermore, referring fossil occurrences to biozones automatically extends apparent stratigraphic ranges because first and last occurrences of most fossils do not coincide with zonal boundaries and it sets biostratigraphic precision (to the nearest biozone) at the outset (Paul, Reference Paul, Cope and Skelton1985). Thus referring bioevents to zones or stages means using a ‘ruler’, the divisions of which are known to be unequal and which span tens or hundreds of metres when the position of a bioevent can easily be measured to the nearest metre or better. Extensions of stratigraphic ranges and determination of the sequence of bioevents within biozones become impossible. Another limitation of zonal biostratigraphy is its selectivity. Biozones are only as good as their boundaries. Perhaps hundreds of species may occur within a biozone, yet its lower boundary is defined by the range termination of a single index fossil. How can we tell if the bioevent that defines the base of a biozone is less diachronous than other bioevents that occur within the biozone or in an alternative biozonation?
This paper aims to describe a simple, easily applied technique to compare the precision of bioevents, which can be used by anyone familiar with spreadsheets. We use as examples the correlation of two Cretaceous stage boundaries, the Cenomanian–Turonian boundary and the Coniacian–Santonian boundary, but stress that our intention is not to provide an improved correlation for either boundary. The method should be regarded only as a first step in any attempt to improve a given correlation. Bioevents that fail at the first step are unlikely to be reliable and should, at best, be used with caution. How diachronous bioevents are is a common problem in stratigraphy, so we think a general discussion of the principles underlying our technique is appropriate. For simplicity we refer to events that are isochronous within the limits of current resolution as ‘reliable’. Those that are not we refer to as ‘diachronous’. Given a sufficiently fine timescale, all events can be shown to be diachronous (Paul, Reference Paul1987).
To determine the size of a fossil more accurately one can make a more precise measurement using a finer scale, for example, using a vernier calliper rather than a millimetre rule. In such a case, accuracy and precision are closely correlated. However, in biostratigraphy they may not be. For example, if the last occurrence of a fossil is based on reworked specimens it does not matter how precisely the level is measured, it will not produce an accurate estimate of the true level (or time) of extinction of that fossil. Similarly, in correlation two bioevents may be coeval. However, depending on context, this may mean that they occur in the same stage, or zone, or bed, or that they occur on the same bedding surface. On average, Cretaceous stages lasted 6.7 Ma, whereas specimens on the same bedding surface might be the same age to within a year. Terms such as ‘coeval’, ‘diachronous’ and even ‘accurate’ are meaningless without some indication of the precision with which they can be determined.
2. General principles
Paul (Reference Paul1987) discussed the general problem of stratigraphic precision. Time is a continuous variable, but we arbitrarily divide it into units of the same duration (years, seconds, millenia), each of which carries a measurement error. In measurement of continuous variables it has long been standard scientific convention to measure to one order of magnitude greater precision than required and then to round up or down to the nearest unit at the precision required. The same general principle can be applied to biostratigraphic problems. In addition, the finest ‘ruler’ we can use will give the most accurate correlation, because even if the units are of uneven duration, the resulting measurement error will be minimized. Once the correlation has been established, disputed events can be plotted against it to see how well they fit. This is particularly important in biostratigraphy because we cannot assume that sections are complete. However, by using the finest ‘ruler’ available, first, it is more likely that minor hiatuses will be detected, and second, their effect on the overall correlation will be minimal because they will have been measured using the finest temporal subdivisions. This was the basis of House's (1985) argument for using sedimentary microrhythms to refine the radiometric timescale. In biostratigraphic terms, the finest ‘ruler’ is likely to be the data source that provides the largest number of points within the relevant stratigraphic interval. Data sources we discuss here are sedimentary logs (lithostratigraphy), Milankovitch cycles (cyclostratigraphy), stable isotopes (chemostratigraphy), bioevents (quantitative biostratigraphy), magnetic reversals and radiometric dating. Ideally, one should establish the correlation on a data source independent of biostratigraphy to resolve biostratigraphic problems, but if no other data sources are available, quantitative biostratigraphy is better than received wisdom about the relative merits of different types of bioevents.
3. Data sources
First it is perhaps worth reiterating Shaw's (Reference Shaw1971) definition of adequate biostratigraphic information. That is ‘a statement of the exact stratigraphic position of a fossil, . . . relative to an objectively recognizable stratigraphic marker.’(Shaw, Reference Shaw1971, p. 2).
3.a. Lithostratigraphy
In exceptional cases, varved successions can provide annual precision (see, for example, Anderson & Dean, Reference Anderson and Dean1988), but these are usually restricted to lacustrine deposits and of limited geographic extent. However, lithostratigraphy can provide precision in the order of 10 000 years (10 ka) within individual marine basins (e.g. Jefferies, Reference Jefferies1963; Mortimore, Reference Mortimore1986, Mortimore & Pomerol, Reference Mortimore and Pomerol1987; Robinson, Reference Robinson1986). Lithostratigraphic correlation between basins is more problematic, unless the lithostratigraphy is orbitally forced. In selecting a GSSP, inter-basinal correlation is essential.
3.b. Cyclostratigraphy
Generally the finest precision within the Milankovitch band is the precession cycle, which is in the order of 20 ka. It is usually manifested as rhythmic alternations of two lithologies, such as marl and limestone, hence a precision in the order of 10 ka is theoretically possible. Where successions are genuinely orbitally forced, then potentially the same sequence should be recognizable in different basins. For example, Kemp & Coe (Reference Kemp and Coe2007) have correlated non-marine sequences between SW England and the Newark Basin, New Jersey, USA, entirely on the basis of cyclostratigraphy. Potentially, cyclostratigraphy is a high-precision data source and global in application. House (Reference House1985) suggested that cyclostratigraphy could be used to improve the precision of dating of system and stage boundaries using Jurassic examples, but the idea that orbitally-forced sedimentary rhythms could be used to establish a geological timescale dates back to Gilbert (Reference Gilbert1895) at least. Although cyclostratigraphy is frequently correlated using key bioevents, detailed sedimentary logs usually reveal subtle changes in the succession (e.g. variations in thickness and/or clay content), which can be used to match sections in exactly the same way that tree rings are used in dendrochronology. Although any local dendrochonological timescale is anchored at the present day, in practice the fundamental approach is matching patterns of thicker and thinner bands in both dendrochronology and cyclostratigraphy. In some cases, cyclostratigraphic variations can be traced between basins (e.g. Gale, Reference Gale, House and Gale1995; Paul et al. Reference Paul, Mitchell, Lamolda and Gorostidi1994), as one might expect if they are truly orbitally forced.
3.c. Chemostratigraphy
Stable isotopes of a number of elements (C, O, Sr) are now routinely used to investigate stratigraphic problems. Precision is partly a matter of sample spacing, but ultimately is limited by the number of recognizable events, usually peaks and troughs of the isotope curve. For this reason, carbon stable isotopes tend to be the most useful. They are much less susceptible to later diagenetic alteration than oxygen isotopes (Marshall, Reference Marshall1992), but equally full of detail. Strontium isotope curves tend to be much more generalized and are unlikely ever to reach the potential precision of carbon isotope curves. Mitchell, Paul & Gale (Reference Mitchell, Paul, Gale, Howell and Aitken1996) suggested that background carbon curves are a good proxy for eustatic sea level. Since the oceans are connected and mixing times are short on a geological timescale (about 1000 years) with respect to the sedimentary record, carbon isotope curves offer global correlation and have a potential precision in the Milankovitch band, although probably less refined than cyclostratigraphy for most sections. Again chemostratigraphy is usually confirmed with biostratigraphy, but curve-matching techniques can be used in the absence of biostratigraphy. Lithostratigraphy can also be used. Above the Cenomanian chalk, virtually all the identified isotope events in Jarvis et al. (Reference Jarvis, Gale, Jenkyns and Pearce2006) relate to lithostratigraphic marker beds, not bioevents.
3.d. Bioevents
Individual bioevents are subject to the problems outlined in the introduction. Hence quantitative approaches (graphic correlation: Shaw, Reference Shaw1964; Mann & Lane, Reference Mann and Lane1995; probabilistic stratigraphy: Hay, Reference Hay1972; unitary associations: Guex, Reference Guex1977; Guex & Davaud, Reference Guex and Davaud1984; seriation: Brower & Burroughs, Reference Brower, Burroughs, Cubitt and Reyment1982; ranking and scaling (RASC): Agterberg & Nel, Reference Agterberg and Nel1982; Gradstein, Reference Gradstein, Gradstein, Agterberg, Brower and Schwarzacher1985; appearance event ordination: Alroy, Reference Alroy1994; gradient analysis: Miller et al. Reference Miller, Holland, Meyer and Dattilo2001; constrained optimization (CONOP): Sadler, Reference Sadler2003) are essential. For a thorough review, see Sadler (Reference Sadler2004). Practical applications of quantitative methods have achieved an order of magnitude greater precision than conventional biozonal stratigraphy (e.g. Blank & Ellis, Reference Blank and Ellis1982; Sweet, Reference Sweet and Bruton1984; Sadler, Reference Sadler2004), but it is still in the order of one event per 100 ka.
Precision really depends on the number of range terminations (or other bioevents) within the relevant stratigraphic interval. Holland (Reference Holland1995) has argued that range terminations are likely to be concentrated at sequence boundaries and there is considerable evidence that they are not evenly distributed in the stratigraphic record. During intervals of biotic turnover, bioevents may offer a similar precision to cyclostratigraphy and chemostratigraphy. If no other data source is available, omitting the target bioevents from the data used in correlation should provide an independent test. Depending on the fossils, bioevents are potentially global in application, but most are more likely to be regional.
3.e. Magnetostratigraphy
This has the undoubted advantage that magnetic reversals are global in extent and isochronous to within very fine intervals on a geological timescale. However, magnetic reversals are unlikely to provide a precision comparable with cyclostratigraphy or chemostratigraphy because there are not enough of them. Furthermore, for a large part of the Upper Cretaceous the prolonged magnetic quiet zone invalidates magnetostratigraphy. Elsewhere in the geological column, magnetostratigraphy is usually integrated with biostratigraphy. Although the best correlations result from use of a variety of data sources, any technique that depends on biostratigraphy provides a weaker test of bioevents.
3.f. Radiometric dating
Radiometric dating offers the only practical method of providing a reasonably accurate age estimate. However, radiometric dates are not usually available in sufficient numbers to provide the quantity of points necessary for high precision correlation. They also require sections with intercalated volcaniclastic sediments in order to provide direct dates from sedimentary sequences. Finally, radiometric dates usually come with about a 1% error. This means an uncertainty between half and one million years (Ma) in the Cretaceous. Although invaluable for age estimates, radiometric dates are unlikely ever to resolve the problems posed in the introduction. Furthermore, arguments about stratigraphic precision based on radiometric dates are akin to using a metre rule to check if centimetre divisions are even, because the inherent error of radiometric dates is two orders of magnitude larger than the precision potentially available from chemo- or cyclostratigraphy.
3.g. Summary of data sources
All of the above data sources have their limitations. Nevertheless, cyclo- and chemostratigraphy currently offer the finest practical precision, can often be used for inter-basinal correlation and are potentially of global application. Furthermore, they can often be correlated independently of all biostratigraphic information and so provide a truly independent test of how diachronous bioevents are. They can confidently be used to calibrate bioevents and other stratigraphic markers.
4. Methods
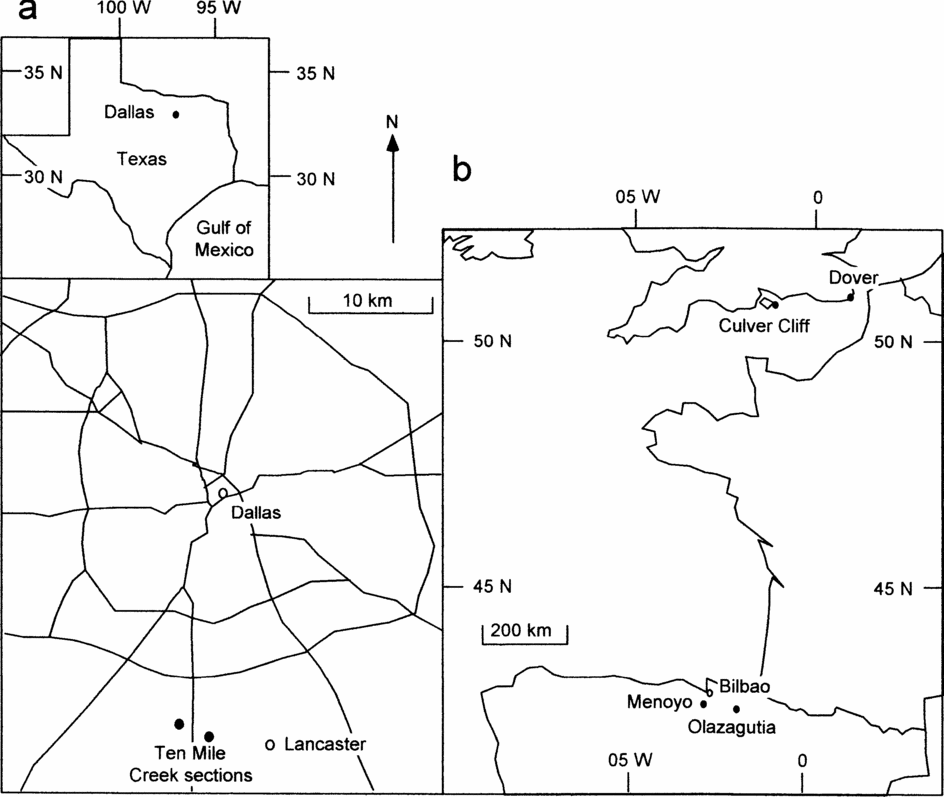
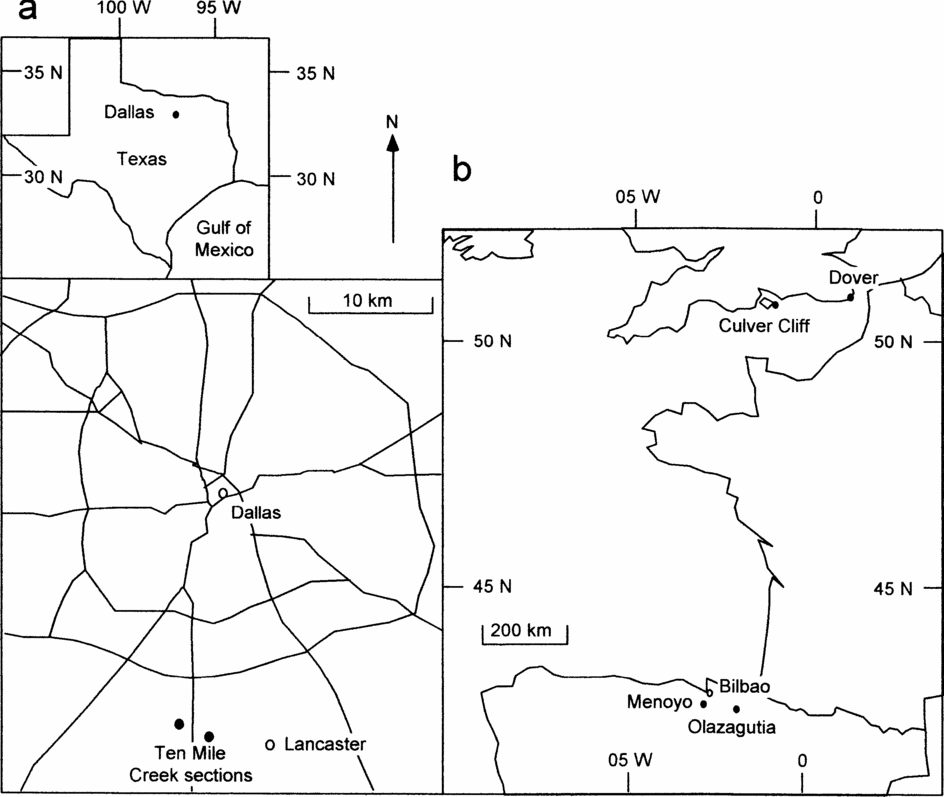
We use as examples sections across the Cenomanian–Turonian boundary in southern England and Spain and across the Coniacian–Santonian boundary in southern England, Spain and the United States (Fig. 1). The approach we have taken is to select the best data source for correlating the relevant sections, produce a graphic correlation (Shaw, Reference Shaw1964) and then plot on the bioevents. We use cyclostratigraphy to correlate the Cenomanian–Turonian boundary sections at Dover, England, and at Menoyo, Spain (Paul et al. Reference Paul, Mitchell, Lamolda and Gorostidi1994) and chemostratigraphy to correlate the Coniacian–Santonian boundary sections in southern England (Jarvis et al. Reference Jarvis, Gale, Jenkyns and Pearce2006), Olazagutia, Spain (Lamolda & Paul, Reference Lamolda and Paul2007) and Ten Mile Creek, Texas (Gale et al. Reference Gale, Kennedy, Lees, Petrizzo and Walaszczyk2007).
Location of sections mentioned in the text.
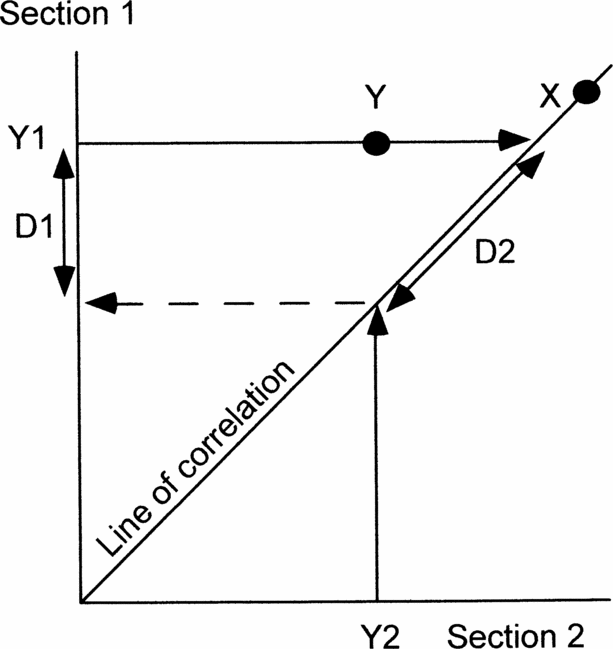
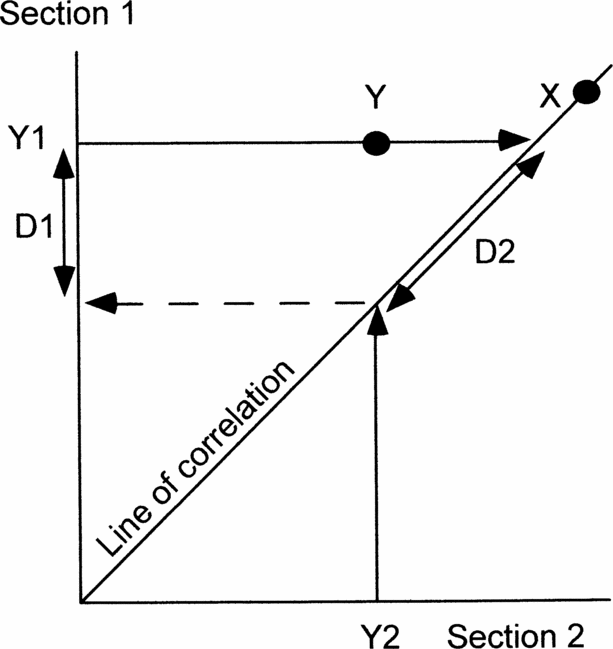
For this purpose graphic correlation is the best quantitative method. Probabilistic stratigraphy seeks to establish the most probable sequence of events. Events that consistently occur in the same order in all sections are the most reliable for correlation. However, this is always true of first and last occurrences of the same fossil species, but it reveals nothing about how diachronous either event is. Other techniques are more time-consuming and frequently require several sections before anomalous occurrences are detectable. On the other hand, graphic correlation, even when comparing only two sections, immediately establishes how diachronous any event is compared to the best correlation, because reliable events plot on, or adjacent to, the line of correlation (e.g. X in Fig. 2). If the cyclo- or chemostratigraphic events are truly isochronous, the line of correlation should be constrained to pass through all points (or their error boxes). However, we prefer to regard data points on isotope curves as independent variables because of potential sampling errors (Fig. 3) or because we cannot be sure that points taken to be the tops of rhythms are indeed the same in different basins. Furthermore, a single best-fit line allows immediate visual inspection of the scatter of the two types of data (cyclostratigraphic or chemostratigraphic versus biostratigraphic; compare open and solid symbols in Fig. 4).
Diagram to show how graphic correlation between two sections can be used to demonstrate the precision of events (X, Y) and estimate the amount of any discrepancy using the line of correlation. X occurs at the same time in both sections and so plots on the line of correlation. Y occurs significantly earlier in section 2 than in section 1. Y1 and Y2, positions of event Y in sections 1 and 2, respectively. D1, discrepancy measured in section 1. D2, discrepancy measured along the line of correlation. See text for further explanation.
Stable isotope sampling effects. The curve represents the true variation in isotope values if the succession were sampled continuously. 1–8 and a–d represent sample levels in sections 1 and 2, respectively. Note that the peak value for section 1 is in sample 4, closely followed by sample 5. In section 2 the peak value is in sample c, above both samples 4 and 5. Although values in section 2 are most comparable with the closest sample in section 1, the peak of the isotope curve sampled in section 2 is not immediately adjacent to the peak value in section 1. For this reason we believe that isotope values should be treated as independent variables, not as best-fit points through which a best-fit line should be constrained to pass.

Graphic correlation of Milankovitch rhythms across the Cenomanian–Turonian boundary between Menoyo, Spain and Dover, England, together with positions of bioevents common to both sections. Identified bioevents are (in stratigraphic order): last occurrences of 1, Corolithion kennedyi; 2, Rotalipora greenhornensis; 3, Axopodorhabdus albianus; 4, Rotalipora cushmani; 5, Lithraphidites acutus; 6, Microstaurus chiastius and 7, the first occurrence of Quadrum gartneri. Only these events plot close to the line of correlation and are potentially reliable events in international correlation.

Projecting occurrences in each section to the line of correlation enables quantification of any mismatch (Y in Fig. 2). If one section is known to be better than the other, or is being used as the reference section, then the mismatch can be measured in that section (D1 in Fig. 2). If neither section is known to be better, then the mismatch can be measured along the line of correlation (D2 in Fig. 2). Either way, graphic correlation offers an immediate visual indication and a quantitative estimate of the reliability of any event compared with the best correlation, hence it is the method used here. Finally, depending on whether any event plots below or above the line of correlation enables us to determine in which section it occurs earlier. The equation of the line of correlation is in the form Y = aX + b. In this context a is a measure of the relative rates of sedimentation in the two sections.
For cyclostratigraphy we have generally used the sharpest lithological change within a rhythmic section as a point to correlate. In Cenomanian–Turonian boundary sections in southern England, the rhythms are generally pure chalk separated by wispy marls, although when the marls are thick enough, there is a tendency for the base of the marls to be sharper and the tops to grade up into the overlying chalk. At Menoyo, Spain, the rhythms are much thicker and composed of marly siltstone, which gradually becomes more calcareous up-section. Initially the increase in carbonate produces levels of nodules, which become thicker and more continuous up-section. The rhythms usually end in a prominent limestone at the top, followed by a sharp break to the siltstone. We have taken this sharp break as the point for correlation.
For this paper our correlation between Menoyo and Dover is entirely independent of biostratigraphy. Both sections start at a prominent facies change, which provides one tie point and in both sections the eighth rhythm up is either anomalously thick or represents two thinner-than-usual rhythms. This provides a second tie point. Furthermore, in both sections the first five rhythms progressively decrease in thickness up-section. We can match the two sections entirely on lithostratigraphy (open squares in Fig. 4). Equally, the Cenomanian–Turonian boundary is characterized by a very significant positive carbon isotope excursion, details of which can be used to confirm the correlation. In both sections, the excursion starts late in rhythm 1, peaks in rhythm 5, remains high but with a minor decline in rhythm 10 until it starts to decline towards background levels in rhythm 12 (Paul et al. Reference Paul, Mitchell, Lamolda and Gorostidi1994, fig. 12).
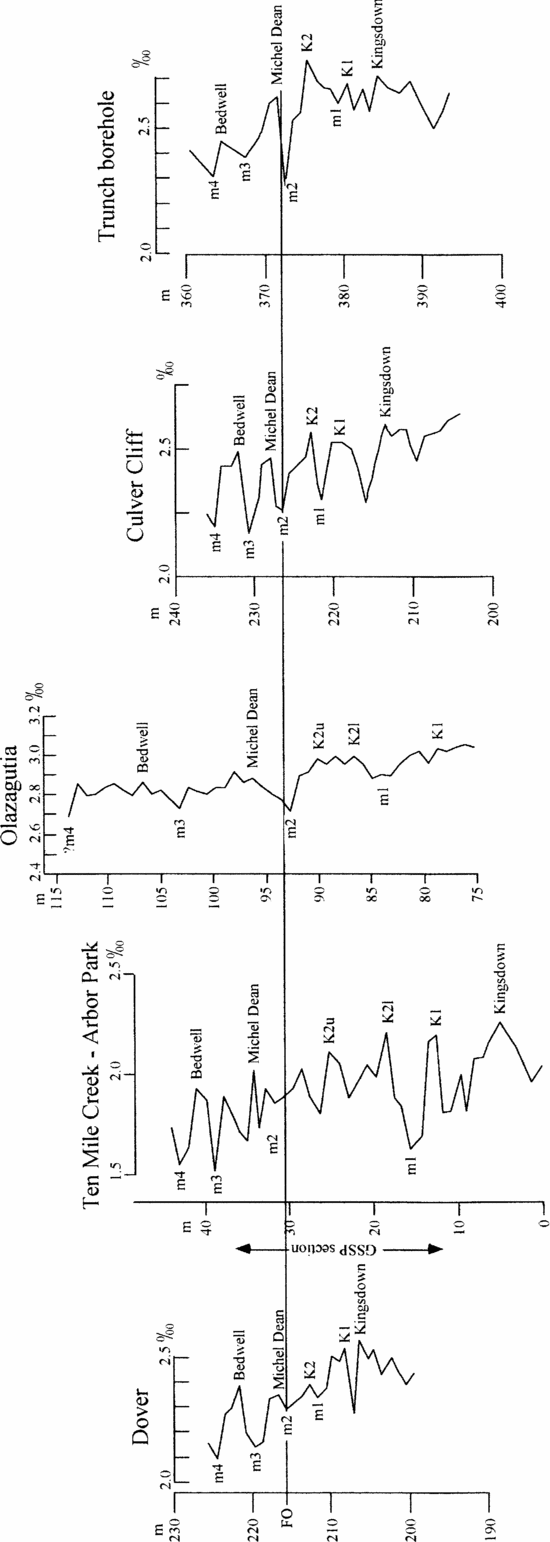
Figure 5 illustrates our suggested correlation of carbon isotope curves for five sections across the Coniacian–Santonian boundary. This shows that thicker (or more intensely sampled) sections potentially offer more points for correlation. Thus trying to match peaks and troughs in the absence of corroborating data is fraught with difficulties. At Dover and Culver Cliff in England, the isotope events can be identified using very detailed lithostratigraphy (e.g. Mortimore & Pomerol, Reference Mortimore and Pomerol1987; Jarvis et al. Reference Jarvis, Gale, Jenkyns and Pearce2006). The section at Ten Mile Creek, Texas, is rhythmic (Gale et al. Reference Gale, Kennedy, Lees, Petrizzo and Walaszczyk2007) and could potentially be correlated by cyclostratigraphy. However, the section at Olazagutia lacks clear rhythms or lithostratigraphic marker beds across the Coniacian–Santonian boundary. Lack of lithological variation is an advantage in avoiding spurious isotopic variations caused by differential diagenesis in different lithologies (see Mitchell et al. Reference Mitchell, Ball, Crowley, Marshall, Paul and Veltkamp1997; Paul, Allison & Brett, Reference Paul, Allison and Brett2008). However, it is a disadvantage when trying to avoid using bioevents to establish a correlation. We suspect this will prove to be a common problem and hence this example is broadly relevant. To minimize reliance on bioevents, we have chosen just two tie points to estimate relative rates of sedimentation at different sections. The inoceramid bivalve Platyceramus undulatoplicatus occurs at two levels in the English chalk, the bases of which can be shown to be reliable bioevents in England because of their consistent occurrence relative to lithostratigraphic markers. The first occurrence (FO) defines the base of the Santonian Stage and occurs adjacent to a carbon isotope minimum (m2 in Fig. 5) a little below the Michel Dean Flint. The base of the second coincides with Bedwell's Columnar Flint (and the Bedwell isotope peak).
Correlation of carbon stable isotope curves between southern England (Dover, Culver Cliff & Trunch borehole), Texas (Ten Mile Creek) and Spain (Olazagutia) to show our interpretation of the named isotope events (peaks) of Jarvis et al. (Reference Jarvis, Gale, Jenkyns and Pearce2006) and the intervening minima (m1–m4) used to establish the correlation.

Lamolda & Paul (Reference Lamolda and Paul2007) used the interval between these two bioevents to estimate at which levels the isotope values from Dover would correlate in the section at Olazagutia. Then, allowing for consistently higher isotope values at Olazagutia, they calculated the sum of the squares of the differences between most closely adjacent pairs of values. They then altered the correlation by moving the Dover samples up and down by one and then two samples at Olazagutia and recalculated the sum of the squares of the differences. This showed a significantly smaller sum of residuals for the original correlation than for any other match, despite the original correlation being based on 16 comparisons, whereas some of the others were based on only 15 comparisons. Thus we believe the correlation originally suggested between Dover and Olazagutia is the best. For this paper we have used it to identify the most likely positions of the peaks and troughs in the isotope curves identified by Jarvis et al. (Reference Jarvis, Gale, Jenkyns and Pearce2006) in England.
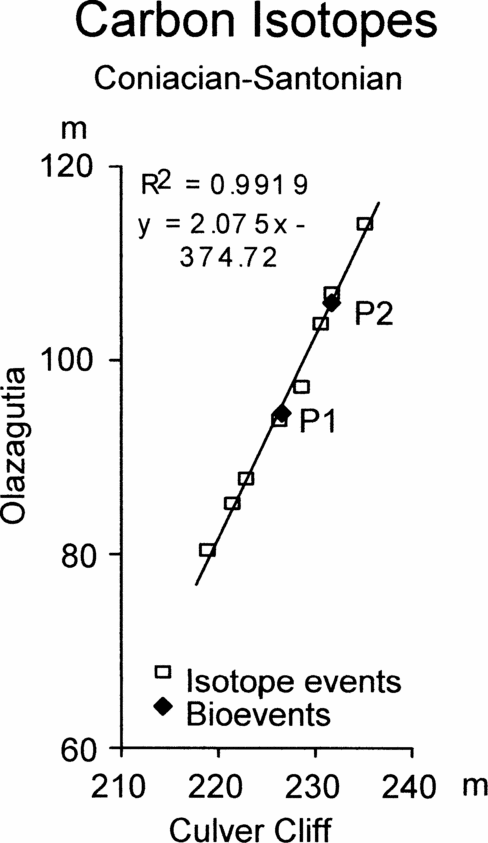
For chemostratigraphic correlation we have taken as many as possible of the peaks and troughs of the isotope curves for southern England produced by Jarvis et al. (Reference Jarvis, Gale, Jenkyns and Pearce2006), not just the named events in that paper, and compared them with peaks and troughs in the carbon isotope curve for Olazagutia, first to establish if a correlation was feasible (Figs 6, 7). The interval covered is from the K1 event to the minimum above the Bedwell Event of Jarvis et al. (Reference Jarvis, Gale, Jenkyns and Pearce2006). As a double check, we also correlated the Ten Mile Creek section with Culver Cliff in southern England (Fig. 8). We have then repeated the procedure to compare the carbon curve for Ten Mile Creek with that for Olazagutia (Fig. 9). The correlation between Ten Mile Creek and Culver Cliff illustrates the point that thicker sections offer more points for correlation. At Culver Cliff between the Kingsdown and Michel Dean events there are two peaks, which Jarvis et al. (Reference Jarvis, Gale, Jenkyns and Pearce2006, fig. 9) labelled K1 and K2, and three minima (Fig. 5). At Ten Mile Creek there are four peaks and five minima between these two isotope events (Gale et al. Reference Gale, Kennedy, Lees, Petrizzo and Walaszczyk2007, fig. 24). Gale et al. (Reference Gale, Kennedy, Lees, Petrizzo and Walaszczyk2007) interpreted the lowest of the four peaks at Ten Mile Creek as K1 and the next two as correlative with K2 (K2l and K2u in Fig. 5). The stratigraphically highest peak they left unlabelled. We have accepted the interpretations of the isotope events given in Gale et al. (Reference Gale, Kennedy, Lees, Petrizzo and Walaszczyk2007), which were also primarily based on the bases of the first and second occurrences of P. undulatoplicatus. In correlating Ten Mile Creek with Olazagutia we think we can recognize these additional events. In Figures 6–9 the equations of correlation and correlation coefficients are based only on the isotope events.
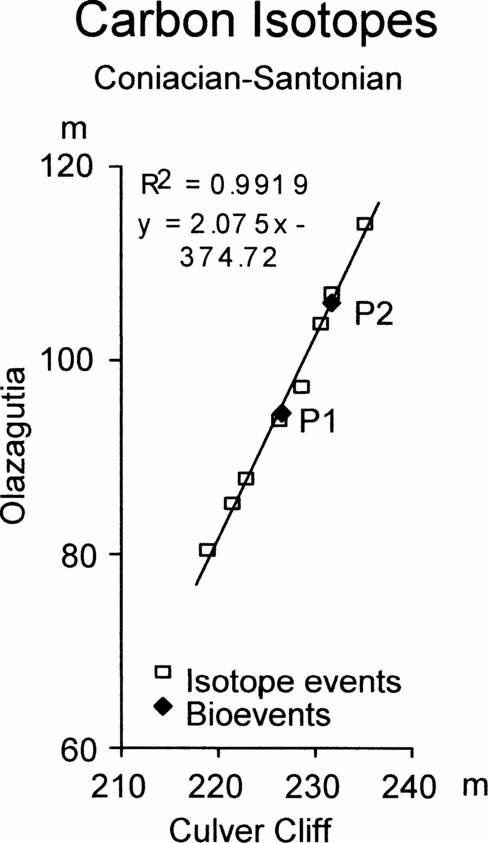
Graphic correlation of peaks and troughs in the carbon stable isotope curves across the Coniacian–Santonian boundary between Olazagutia, Spain and Culver Cliff, England, together with the position of the first occurrence of Platyceramus undulatoplicatus (P1) and the base of the upper level of P. undulatoplicatus (P2).
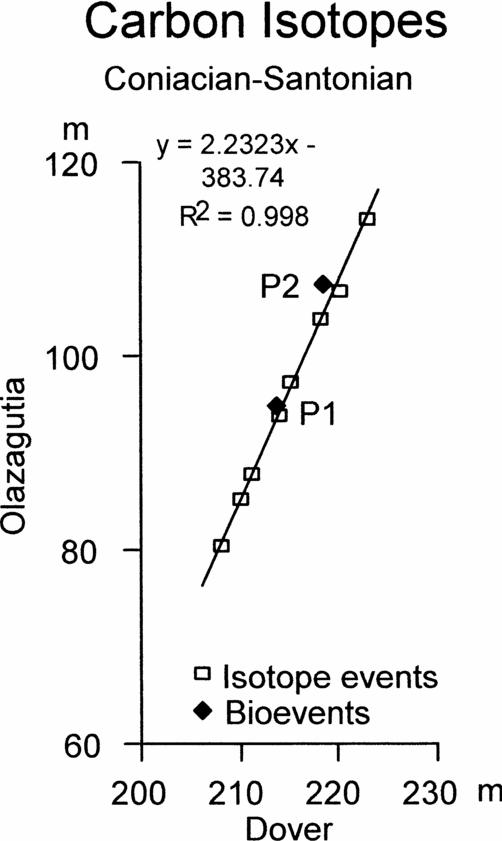
Graphic correlation of peaks and troughs in the carbon stable isotope curves across the Coniacian–Santonian boundary between Olazagutia, Spain and Dover, England, together with the positions of the first occurrence of Platyceramus undulatoplicatus (P1) and the base of the upper level of P. undulatoplicatus (P2).

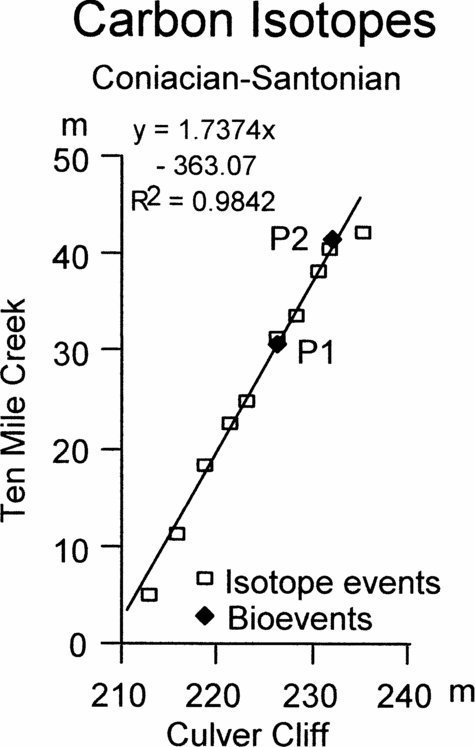
Graphic correlation of peaks and troughs in the carbon stable isotope curves across the Coniacian–Santonian boundary between Culver Cliff, England and Ten Mile Creek, USA, together with the position of the first occurrence of Platyceramus undulatoplicatus (P1) and the base of the upper level of P. undulatoplicatus (P2).

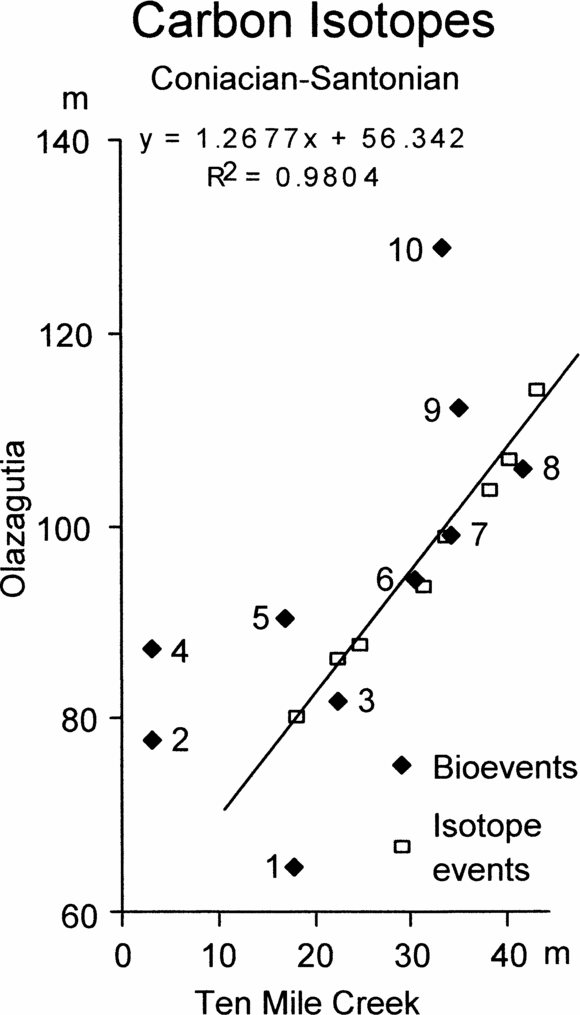
Graphic correlation of peaks and troughs in the carbon stable isotope curves across the Coniacian–Santonian boundary between Olazagutia, Spain and Ten Mile Creek, USA, together with the positions of ten bioevents common to both sections. Bioevents are: 1, the first occurrence (FO) of Magadiceramus subquadratus; 2, FO of Lithastrinus grillii; 3, FO of Lucianorhabdus cayeuxii; 4, FO of Calculites obscurus; 5, FO of Costellagerina; 6, FO of Platyceramus undulatoplicatus; 7, FO of Platyceramus cycloides; 8, last occurrence (LO) of Platyceramus undulatoplicatus; 9, LO of Lithastrinus septenarius; 10, FO of Cordiceramus.

5. Results
5.a. Cenomanian–Turonian boundary
Figure 4 shows a graphic correlation between Dover, England, and Menoyo, Spain, based on cyclostratigraphy. There is one slight change between Figure 4 and the correlation presented by Paul et al. (Reference Paul, Mitchell, Lamolda and Gorostidi1994). We have taken the equivalent of the top of bed 3 of the Plenus Marls at Dover to be slightly lower at Menoyo, however, this makes very little difference to the overall correlation. Figure 4 also identifies the seven bioevents, which plot close to the line of correlation based on cyclostratigraphy and which were previously identified (Paul et al. Reference Paul, Mitchell, Lamolda and Gorostidi1994, fig. 10). In addition, we have plotted 13 other nannofossil events that can be identified in both sections and which also lie below the break in the section at Menoyo (at about 76 m). Figure 4 shows how scattered these additional bioevents are and also that only one appears to occur earlier at Dover than at Menoyo. A further seven nannofossil bioevents can be recognized in both sections, but occur above the break in the section at Menoyo, and so cannot be plotted accurately. These seven events are even further from the line of correlation based on cyclostratigraphy.
5.b. Coniacian–Santonian boundary
Figures 6 and 7 show the graphic correlation between Olazagutia and Culver Cliff, Isle of Wight, and between Olazagutia and Dover, Kent. Both show slightly sinuous scatters of points from the isotope events. For comparison, the FO and base of the second occurrence of Platyceramus undulatoplicatus are also plotted (P1 and P2, Figs 6 and 7, respectively).
Figure 8 shows the correlation between Ten Mile Creek and Culver Cliff. Again, P1 and P2 are plotted for comparison.
Figure 9 shows the graphic correlation between Olazagutia and Ten Mile Creek, together with ten bioevents that can be detected in both sections. Once again there is a slightly sinuous array of isotope points to which we have fitted a best-fit line, but the bioevents show a wide scatter. Only four bioevents plot close to the line of correlation (Fig. 9). These are the FO and LO of P. undulatoplicatus (events 6 and 8), which would be expected, the FO of P. cycloides (event 7) and the FO of Lucianorhabdus cayeuxii (event 3). The other bioevents plotted are: 1 – the unique occurrence of the inoceramid bivalve Magadiceramus subquadratus, 2 – the FO of the calcareous nannofossil Lithastrinus grillii, 4 – the FO of the calcareous nannofossil Calculites obscurus, 5 – the FO of the planktonic foraminiferan Costellagerina, 9 – the LO of the calcareous nannofossil Lithastrinus septenarius, and 10 – the FO of the inoceramid bivalve Cordiceramus. None of these plots close to the line of correlation and so all are likely to be unreliable as time planes.
6. Discussion
6.a. Principles
Both referees argued that sedimentary rhythms, isotope curves, magnetic reversals, etc. are very similar, can only be correlated with biostratigraphic control and hence our proposed test of bioevents is not truly independent. We dispute this argument. Dating timber using dendrochronology would be impossible if it were true (see Section 3.b). Nevertheless, the most accurate correlations will involve biostratigraphy. Furthermore, bioevents often provide the quickest means to anchor rhythmic successions or isotope curves. However, when an independent test of bioevents is required, as with the test described here, it is desirable and frequently possible to correlate in the complete absence of biostratigraphy. Kemp & Coe (Reference Kemp and Coe2007) have correlated non-marine Upper Triassic sequences between England and the Newark Basin, USA, on the basis of cyclostratigraphy and our example of the correlation of the Cenomanian–Turonian boundary is based on a combination of cyclo- and chemostratigraphy.
Our original version of the manuscript was also criticized for assuming that cyclo- and chemostratigraphy offered greater precision than other techniques. We argue that this is not an assumption; it is a fact. At the precession scale cyclostratigraphy offers a potential resolution of one bed per 10 ka. If 50% of the rhythms are missing in any given section, this still gives one event per 20 ka. What other stratigraphic method (apart from varves) provides anything like that precision? Chemostratigraphy is relatively new. When we prepared our original comments on the carbon isotope curve at Olazagutia (Lamolda & Paul, Reference Lamolda and Paul2007, but submitted in 2003), we did not think the subtle variations (peaks and troughs) in the isotope curve would be of much use in international correlation. Thus we used a combination of bioevents (the two occurrences of P. undulatoplicatus) together with a curve-fitting procedure to match the isotope curves between England and Spain. Since then, Jarvis et al. (Reference Jarvis, Gale, Jenkyns and Pearce2006) have shown that even quite minor fluctuations in δ13C values can be traced widely in the English Chalk and correlated with successions in Italy. Conservatively, we can now correlate eight isotope events in the interval sampled at Olazagutia, which we estimate lasted 968 ka and gives one event per 121 ka. We used 16 pairs of isotope values for the curve-fitting procedure, giving one point per 60.5 ka. The latter was limited by the sampling interval used in England (Jenkyns, Gale & Corfield, Reference Jenkyns, Gale and Corfield1994), not by any inherent limitation of chemostratigraphy. Even so, chemostratigraphy offers a precision which few, if any, other stratigraphic methods can match. So we reiterate the point mentioned in Section 2: the finest stratigraphic ruler will detect the smallest hiatuses, will introduce the smallest errors if events are missing or of variable duration, and hence is to be preferred in a test such as the one proposed here.
6.b. Cyclostratigraphic correlation
The cyclostratigraphic correlation of the Cenomanian–Turonian boundary between Menoyo and Dover has more bioevents that appear to be reliable than the correlation of the Coniacian–Santonian boundary. We suspect that this is because of the very significant isotope excursion at the Cenomanian–Turonian boundary, which is known to be an interval of mass-extinction (e.g. Raup & Sepkoski, Reference Raup and Sepkoski1986). Even so, the majority of calcareous nannofossil events plot well away from the line of correlation, indicating that even these minute and widely distributed fossils do not necessarily produce reliable bioevents.
6.c. Isotope correlation
As mentioned above, thicker or more intensely sampled sections are likely to contain additional peaks and troughs in their isotope curves, causing potential difficulties in correlation. In such cases, events at the top or base of the local isotope curve are most likely to be misinterpreted because they lack control above or below. For example, it is noteworthy that the topmost isotope event (m4 in Fig. 5) lies further from the line of correlation than any other point in the correlation between Ten Mile Creek and Culver Cliff (Fig. 8), suggesting that this event may be miscorrelated. However, we have no additional data at Ten Mile Creek to see if a better candidate for event m4 exists. Nevertheless, the uncertainty affects the correlation minimally. We have selected peaks and troughs in the isotope curve as the named events, using inferred rates of sedimentation based on the distances between the first and second occurrences of P. undulatoplicatus (Fig. 5). Gale et al. (Reference Gale, Kennedy, Lees, Petrizzo and Walaszczyk2007) adopted a similar approach in identifying the named isotope events at Ten Mile Creek. However, they suggested two peaks at Ten Mile Creek were equivalent to peak K2 in England (labelled K2l and K2u in Fig. 5), illustrating the difficulty of being certain precisely which event is which. In addition, this means that our selection of peaks and troughs for correlation is not truly independent of biostratigraphy. In particular, we cannot use the suggested isotope correlation to see how diachronous the two P. undulatoplicatus bioevents are (but see next paragraph), although no other bioevents are compromised in this way. Finally, from Figure 3 it can be seen that even when sampling the same part of an isotope curve, the peak value in one section may not be closest to the nearest equivalent sample in another section. Sample C would appear to be the isotope peak in section 2, whereas sample 4 would appear to be the peak in section 1, despite the fact that sample 5 is stratigraphically closest to sample C.
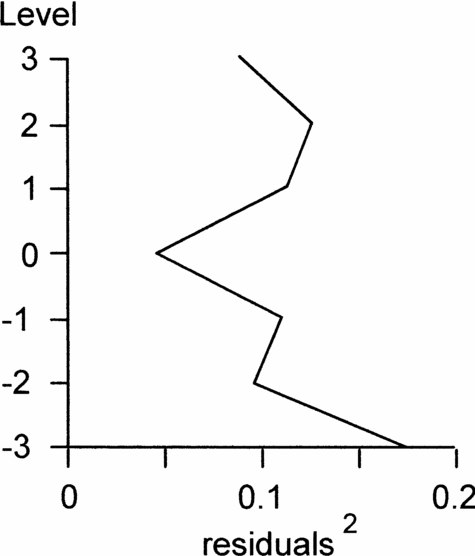
To test our suggested isotope correlation between Dover and Olazagutia, we recalculated equivalent levels for the Dover samples at Olazagutia and selected the closest peaks or troughs, rather than just closest pairs of samples. Then, using the curve-fitting technique outlined in the Methods section, we tested the correlation by moving the two isotope curves relative to each other, but this time by up to three positions, and calculated the goodness of fit. This showed that the original correlation based on the two P. undulatoplicatus bioevents fitted better than any other alternative position (Fig. 10). We also investigated a correlation in which we fixed isotope event K1 as the lowest peak at Olazagutia and counted peaks and troughs upwards from this single fixed point. We then repeated the goodness of fit test. This second goodness of fit curve has no obvious best-fit position and the sums of the squares of the residuals are consistently 3–5 times as large as the original best fit, suggesting that all the alternative positions provide a poorer fit. Thus, although our chemostratigraphic correlation was initially based on the two P. undulatoplicatus bioevents, we believe the results of the curve-fitting test corroborate that we have selected the correct isotope peaks. Thus we believe it is valid to use the isotope correlation to test how diachronous the two P. undulatoplicatus bioevents are.
Sums of squares of residuals of carbon isotope values for seven possible correlations between Olazagutia, Spain and Dover, England at the Coniacian–Santonian boundary. Note that the original level (0) has the smallest sum and hence the best correlation.

Despite these difficulties, it is clear from Figure 9 that we could not achieve anything like as accurate a correlation between Ten Mile Creek and Olazagutia without the isotopic evidence. Only four of the ten bioevents plot moderately close to the line of correlation, including the two P. undulatoplicatus bioevents. Furthermore, the line of correlation for Olazagutia versus Ten Mile Creek using bioevents has a significantly different slope compared with that produced using isotope events, and very low correlation coefficient (R2 = 0.4379). Other bioevents, such as the first and last occurrences of the ammonite Texanites (T.) gallicus or the first occurrence of the planktonic foraminiferan Sigalia carpatica, are known from one or the other, but not both localities, and so cannot be used for correlation between these sections.
6.d. Bioevents
Macrofossils are very useful in biostratigraphy because they can often be identified in the field and therefore provide a means of location within a section. This, in turn, often defines sampling levels for other activities, such as micropalaeontology or geochemistry. Lamolda & Paul (Reference Lamolda and Paul2007) concluded that at the level of precision available then, correlation between Spain and England was equally precise using either the first and last occurrences of P. undulatoplicatus or using stable isotopes. The additional information now available does not falsify this view. Furthermore, if one accepts that our curve-fitting test justifies the use of chemostratigraphy to test the precision of the P. undulatoplicatus bioevents, then the correlation shows that the FO of this bivalve occurs lower at Olazagutia than at any other section so far investigated.
Ammonites are generally accepted as excellent fossils for biostratigraphy, but in the candidate sections for the Coniacian–Santonian boundary GSSP, ammonites are found near the boundary only at Ten Mile Creek. Even at Ten Mile Creek, only one species (Texanites (T.) gallicus) is recorded across the boundary and it is known from only three horizons (Gale et al. Reference Gale, Kennedy, Lees, Petrizzo and Walaszczyk2007, fig. 4). It would be very interesting to know how precise the first and last occurrences of this ammonite are as time planes, but this is impossible using the techniques outlined above. For fossils known from only a single section, an alternative approach might be to estimate confidence intervals on known range terminations (see Strauss & Sadler, Reference Strauss and Sadler1987; Marshall, Reference Marshall1990). Fifty per cent confidence intervals represent the point where the probability changes from being more to less likely that one is still within the stratigraphic range of the fossil concerned. For T. (T.) gallicus, with three known horizons, 50% confidence intervals are 41% of the known range for either the first or the last occurrence, and 74% of the known range for the entire range (Marshall, Reference Marshall1990, table 1). These values represent 2.7 and 4.8 m, respectively, in the Ten Mile Creek section. They also represent approximately 120 and 200 ka. Thus it would seem that even if T. (T.) gallicus could be detected in other candidate GSSP sections, its first and last occurrences might not be good time planes.
Another point concerns unique occurrences, such as that of Magadiceramus subquadratus at Olazagutia. Unique occurrences have to be treated as both first and last occurrences in graphic correlation. Usually it is possible to tell whether the unique occurrence plots closer to the first or the last occurrence in sections where a range has been established. In the case of M. subquadratus, the unique occurrence at Olazagutia appears to correlate better with the first occurrence of M. subquadratus at Ten Mile Creek. Although intuitively one might suspect that unique occurrences or very narrow stratigraphic ranges would be less likely to be good time planes, examples of unique bioevents that are good time planes do exist. We would cite as examples the unique level of Praeactinocamax primus (the ‘primus event’) in the Middle Cenomanian, which can be correlated between basins in NW Europe (Mitchell et al. Reference Mitchell, Paul, Gale, Howell and Aitken1996), or the very narrow stratigraphic occurrence of Actinocamax plenus in the late Cenomanian (Jefferies, Reference Jefferies1963; Gale, Reference Gale, House and Gale1995; Owen, Reference Owen, Howell and Aitken1996; Jarvis et al. Reference Jarvis, Gale, Jenkyns and Pearce2006). In both cases, other evidence such as lithostratigraphy, sequence stratigraphy, carbon isotope data and conventional biostratigraphy all confirm that both these events are coeval to within very narrow time intervals.
Finally, although we argue in the introduction that we should test conventional wisdom concerning how diachronous bioevents are, our examples show that the experience of practising biostratigraphers can be reliable. Paul et al. (Reference Paul, Mitchell, Lamolda and Gorostidi1994, fig. 13) illustrated seven nannofossil bioevents, which had previously been identified as good indices of the Cenomanian–Turonian boundary (Crux, Reference Crux and Lord1982; Bralower, Reference Bralower1988; Jarvis et al. Reference Jarvis, Carson, Cooper, Hart, Leary, Tocher, Horne and Rosenfeld1988; Lamolda, Gorostidi & Paul, Reference Lamolda, Gorostidi and Paul1994), five of which appeared to be consistently reliable. In our new correlation, those five nannofossil events and no others are confirmed as being reliable. Similarly, in selecting a primary biomarker for the base of the Santonian, the Coniacian–Santonian Boundary Working Group selected the first occurrence of P. undulatoplicatus (Lamolda & Hancock, Reference Lamolda, Hancock, Rawson, Dhondt, Hancock and Kennedy1996), which is known to be reliable within the Anglo-Paris basin, and from this paper appears to be as reliable as chemostratigraphy in international correlation. Nevertheless, without the test proposed here we would be unable to confirm that these events are reliable.
7. Conclusions
(1) The most accurate correlation can be made using the finest timescale available. For most practical purposes this means using carbon stable isotope curves (chemostratigraphy) or Milankovitch cycles (cyclostratigraphy), which offer a potential precision in the order of 10 ka.
(2) Graphic correlation can then be used to test the precision of other events, such as bioevents, between relevant sections, and to quantify any mismatch. It can also be used to determine in which section any event occurs earlier.
(3) Application of these ideas to correlation of the Cenomanian–Turonian and Coniacian–Santonian boundaries demonstrates that some bioevents are as precise as chemo- and cyclostratigraphy, but that most are not.
(4) Two problems occur with bioevents. First, the bioevents may not be recognizable in all sections. Second, where they are recognizable, they may not plot close to the line of correlation.
(5) In the former case, a possible alternative test involves calculating confidence intervals on known ranges in sections where the relevant fossil has been recorded. Large confidence intervals suggest it is unlikely that either first or last occurrences of a fossil will be reliable bioevents. In addition, graphic correlation can be used to predict precisely where a bioevent will be expected to occur within a section from which it has yet to be recorded, as an aid to more intensive searching.
(6) At the Cenomanian–Turonian boundary, the following bioevents (in stratigraphic order) appear to be reliable time planes for international correlation. The last occurrences of (1) Corolithion kennedyi, (2) Rotalipora greenhornensis, (3) Axopodorhabdus albianus, (4) Rotalipora cushmani, (5) Lithraphidites acutus, (6) Microstaurus chiastius and (7) the first occurrence of Quadrum gartneri.
(7) At the Coniacian–Santonian boundary, the bases of first and second occurrences of Platyceramus undulatoplicatus, the first occurrences of Platyceramus cycloides, and Lucianorhabdus cayeuxii have been identified as potentially reliable bioevents.
Acknowledgements
Comments of two anonymous reviewers greatly improved the final version of this paper and are gratefully acknowledged.