Healthcare-associated infections (HAIs) are a leading cause of preventable morbidity, mortality, and healthcare expenditure, and catheter-associated urinary tract infection (CAUTI) is the most common type of HAI.Reference Saint, Meddings, Calfee, Kowalski and Krein 1 Successful efforts to reduce CAUTI have generally focused on 1 or more of the 4 stages of the urinary catheter life cycle: (1) catheter placement, (2) catheter care, (3) catheter removal, and sometimes (4) catheter reinsertion.Reference Meddings and Saint 2 The greatest risk factor for CAUTI is prolonged indwelling urinary catheter (IUC) use.Reference Garibaldi, Burke, Dickman and Smith 3 – Reference Foxman 5 Reducing catheter use, whether by avoiding initial placement or by removing catheters promptly, is key to preventing CAUTI.
Initiatives aimed at reducing IUC use include criteria for placement and checklists, reminders, and protocols encouraging timely removal.Reference Meddings, Rogers, Krein, Fakih, Olmsted and Saint 6 Most of these efforts are time and labor intensive and thus are limited in scalability. The largest interventions use electronic clinical decision support (CDS) tools,Reference Knoll, Wright and Ellingson 7 – Reference Baillie, Epps, Hanish, Fishman, French and Umscheid 9 which promise reliability, automation, scalability, and targeted incorporation into the workflow of the appropriate decision maker. However, the optimal design and implementation of CDS tools targeting catheter use remain unknown.
The effectiveness of CDS tools varies with their ability to provide useful information to the appropriate practitioners at the right point in their workflow.Reference Osheroff 10 Electronically generated reminders present potential hazards in the form of alert fatigue, and automated processes threaten to supersede clinical judgment and individualized patient care. Most prior interventions have been tested in a single setting, limiting generalizability. These reports rarely describe the evolution of the intervention, nor do they employ an iterative design, and they generally lack long-term follow-up.
In this study, we aimed to describe the phased implementation of CDS interventions targeting the full life cycle of urinary catheters at a multicampus academic medical center using iterative design.
Methods
Study population and setting
All patients admitted or under observation at New York-Presbyterian Hospital (NYPH), a 2,600-bed, multicampus, academic medical center in New York City, were included for analysis. All interventions were implemented as part of quality improvement initiatives with modifications to the existing electronic health record (EHR) system, Eclypsis Sunrise Clinical Manager (Allscripts, Chicago, IL). Two separate installations of the EHR are used at different campuses of NYPH, hereafter referred to as the A and B subgroups. The institutional review board approved the protocol for this retrospective analysis.
Interventions and timeline
The intervention had 4 distinct phases (Table 1). Department representatives from hospital administration, quality improvement, epidemiology, biomedical informatics, house staff, and nursing designed and implemented each phase in an iterative process between January 2011 and September 2015. The deployment date for interventions sometimes differed between subgroups A and B. With limited exception, silver alloy catheters were used routinely during the observation period.
Intervention Phases

NOTE. EHR, electronic health record; A, EHR installation A; B, EHR installation B.
a Phases 2 and 3 were implemented asynchronously at different hospital campuses in EHR installations A and B. In EHR installation B, there was a transition phase (T) between phases 2 and 3 (10/2013 to 2/2014) during which multiple version of the mandatory pop-up checklist were tested before the final version went live, marking the start of phase 3. Data from this transition phase were excluded from statistical analysis. Phase 2 ended later in installation A (7/2014) than in installation B (10/2013), and installation A had no transition period prior to phase 3.
In phase 1, representatives from nurse management and hospital epidemiology led a training initiative to reinforce best practices for proper placement and maintenance of catheters according to the Centers for Disease Prevention and Control (CDC) guidelines,Reference Gould, Umscheid, Agarwal, Kuntz and Pegues 11 as well as the documentation of catheters in the EHR. A custom module was implemented within the EHR that required nurses to document the presence and appropriate maintenance of an IUC every 12 hours. An IUC order or nurse opening an electronic flow-sheet to document urinary output triggered the module.
During phase 2, real-time electronic tracking of IUCs was made available to clinicians as an optional checklist tool. Clinicians could access a tab in the patient’s electronic chart called the “Quality Checklist” to visualize a real-time, customized list of a patient’s active lines and catheters and their duration (Fig. S1). Information in the tab was updated automatically, based on the custom module from phase 1. Clinicians could elect to update the status of each line or catheter from a drop-down menu with the options: “maintain,” “already removed,” or “remove today.”
In phase 3, the real-time electronic tracking tool became a triggered pop-up reminder that needed to be viewed and assessed by a clinician daily (Fig. S2). To reach the appropriate clinician at a convenient time, the reminder was linked to the initiation of a daily progress note, which is required to be completed by the patient’s designated primary clinician daily. The mandatory pop-up prevented the clinician from entering text into a note until updating the catheter status or opting out by selecting “not primary clinician.” To minimize inappropriate or duplicative reminders, once a provider assessed all lines and catheters, progress notes no longer triggered reminders until the following day.
Phase 4 comprised 2 interventions: (1) a nurse-driven automatic IUC stop order and (2) a clinician-driven selection of placement criteria. First, IUC orders began automatically expiring at 1200 (noon) on day 2 after placement, at which point the corresponding electronic flow sheet would lock. Thus, nurses were charged with removing catheters in patients that did not meet criteria for prolonged use or obtaining a renewal order from clinicians to complete their charting. The reminder system from phase 3 continued and also warned clinicians of the impending order expiration time (Fig. S3).
The second intervention in phase 4 consisted of a new IUC order, which required clinicians to consider catheter alternatives and to select an appropriate indication for IUC placement. The order used drop-down menus and branch logic (Fig. S4) to navigate the clinician through the decision-making process. Criteria for placement and prolonged use were based on CDC guidelines.Reference Gould, Umscheid, Agarwal, Kuntz and Pegues 11
Outcome measures
We abstracted CAUTI incidence from EHR data using a validated epidemiology decision support system called “EpiPortal”Reference Wajngurt, Hong, Chaudhry, Hyman, Ross and Fracaro 12 with definitions established by the National Health Safety Network of the Centers for Disease Control and Prevention.Reference Dudeck, Edwards and Allen-Bridson 13 , 14 Notably, the definition was revised as of January 2015 to exclude fungemia and lower bacteriuria levels. 15 Counts of new catheters, catheter days, and reinsertions were calculated with the module from phase 1. Catheters that were removed for more than 12 hours (ie, long enough to be captured by electronic documentation) and replaced in the same patient were defined as reinsertions.
We report 4 main study outcomes. First, we examined CAUTI rates per 1,000 device days and per 10,000 hospitalized patient days because the former has been shown to mask the effects of successful quality improvement initiatives targeting reduction in catheter utilization; the latter is influenced by the noncatheterized patient population.Reference Wright, Kharasch, Beaumont, Peterson and Robicsek 16 Second, we determined the number of initial catheter placements per 1,000 hospitalized patient days and total catheter days per 1,000 hospitalized patient days because phased interventions aimed to reduce both initial catheter placement and catheter duration. In addition to reporting mean and median catheter duration, we plotted the distribution of catheter duration by study period to better characterize changes. Mean catheter duration is commonly reported in the literature,Reference Meddings, Rogers, Krein, Fakih, Olmsted and Saint 6 even though the distribution of catheter duration is typically skewed toward shorter durations and does not follow a normal distribution. Most catheters remain for only 1 or 2 days; therefore, median values also do not adequately capture effects on longer-duration catheters. Third, we calculated the rate of catheter reinsertion as a proportion of all catheters. Finally, we collected and analyzed descriptive data from the user logs of clinician interaction with the CDS tools.
Statistical analysis
Measures of CAUTI, catheter days, new catheters, and reinsertion were calculated as proportions of eligible patient days. Comparisons between phases were made using the Pearson χ2 test for independence. Catheter duration was compared between phases using the nonparametric Kruskal-Wallis one-way analysis of variance. All analyses were conducted in R version 3·2·1 software (R Foundation for Statistical Computing, Vienna, Austria). 17
Results
Between January 2011 and September 2015, the overall inpatient census was 3·85 million hospitalized patient days. We identified 179,070 unique catheters (or 46·4 catheters per 1,000 patient days) and 643,055 catheter days (or 166·7 catheter days per 1,000 hospitalized patient days). During this time, 2,121 CAUTIs occurred, for an overall rate of 3·30 per 1,000 catheter days or 5·50 per 10,000 hospitalized patient days. Also, 5,916 catheter reinsertions took place during the study period, a rate of 3·30%.
CAUTI rates
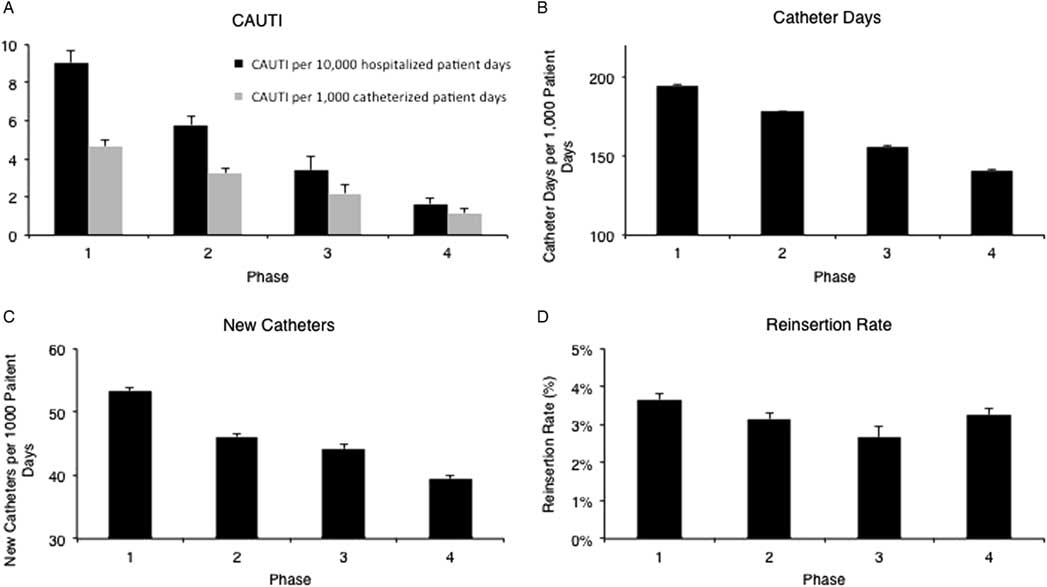
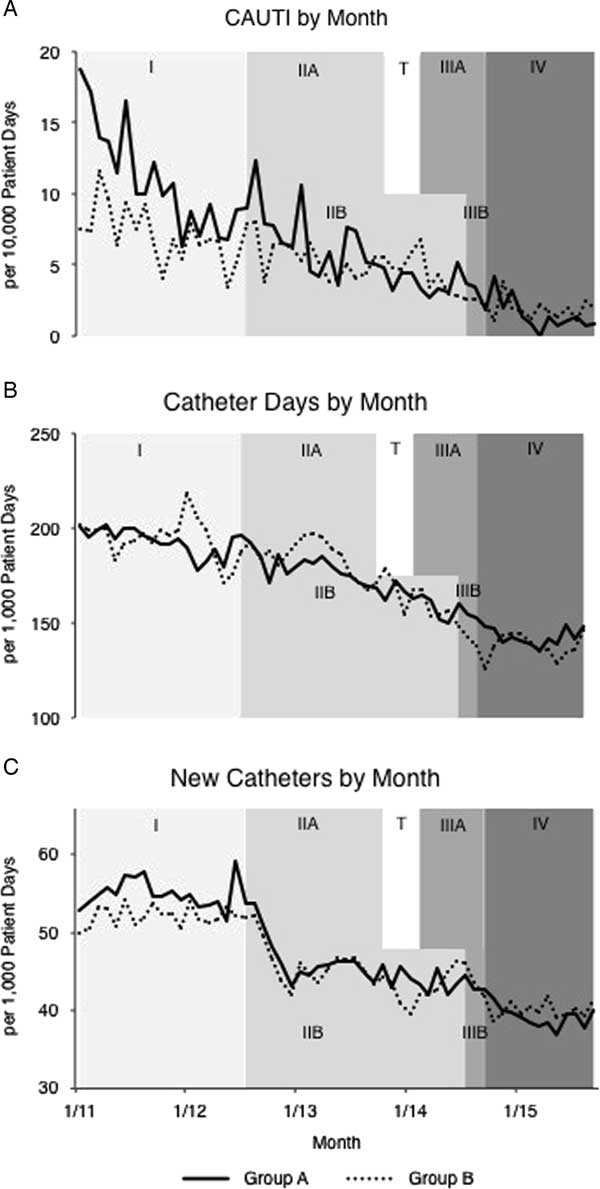
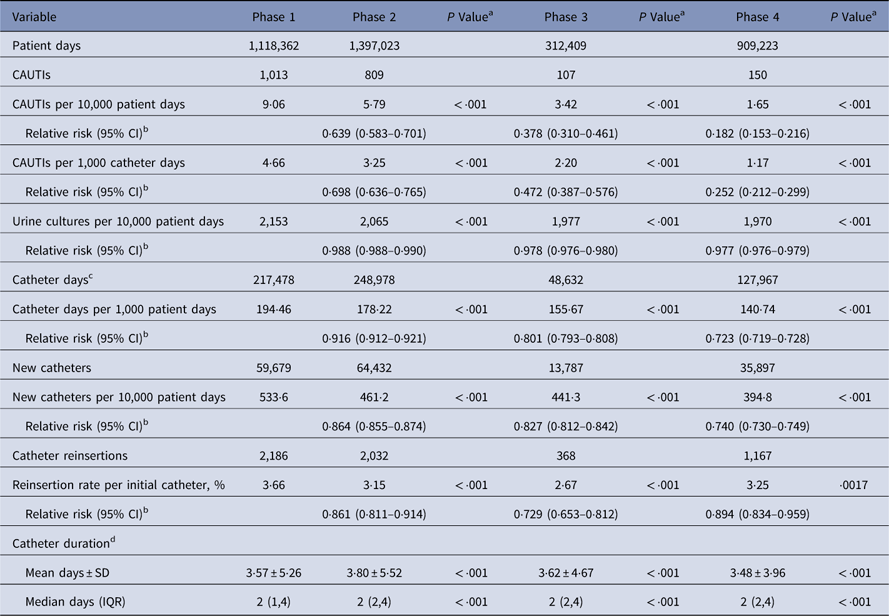
The CAUTI rate per 10,000 patient days declined incrementally in each study phase, from 9·06 in phase 1 to 1·65 in phase 4, for an overall decline of 81·8% (Table 2 and Fig. 1A). Similarly, the CAUTI rate per 1,000 catheterized patient days declined from 4·67 in phase 1 to 1·17 in phase 4, for an overall decline of 74·8%. The monthly CAUTI rate suggests an initial steep decline in CAUTIs in the first year of the phase 1 intervention (standardization and training) followed by a possible plateau in the final 6 months and then a further decline with interventions specifically targeting catheter use in phases 2, 3, and 4 (Fig. 2A). Notably, a decrease in the CAUTI rate occurred with the definition change in January 2015.
Outcomes by phase of intervention. Error bars represent upper limit of 95% confidence interval for the population proportion.

Outcomes by month. NOTE. I, phase 1; IIA, group A phase 2; IIB, group B phase 2; T, transition phase; IIIA, group A phase 3; IIIB, group B phase 3; IV, phase 4.

Outcomes by Phase of Intervention

NOTE. CAUTIs, catheter-associated urinary tract infections; SD, standard deviation; IQR, interquartile range.
a Comparison to phase 1. Pearson’s χ2 test for proportions. The Student t test was used for the mean. Kruskal-Wallis one-way analysis of variance was used for median.
b Relative risk by comparison to phase I.
c Catheter days includes reinserted catheters.
d Catheter duration was calculated for initial catheters only and excluded reinserted catheters.
Catheter use and duration
Overall, total catheter days decreased incrementally from 194·5 in phase 1 to 140·7 in phase 4, for a total decrease of 27·7% (Table 2 and Fig. 1B). Fig. 2B shows a gradual decline in monthly catheter days during phase 1, which accelerated through each study intervention and then leveled off several months into phase 4.
The rate of new catheters also declined between each phase, for a total decrease of 26·0% (Table 1 and Fig. 1C). Monthly trends show that the rate of new catheter placement was relatively stable during phase 1, dropped dramatically with the onset of real-time catheter tracking in phase 2, and continued to gradually decline in phases 3 and 4 (Fig. 2C).
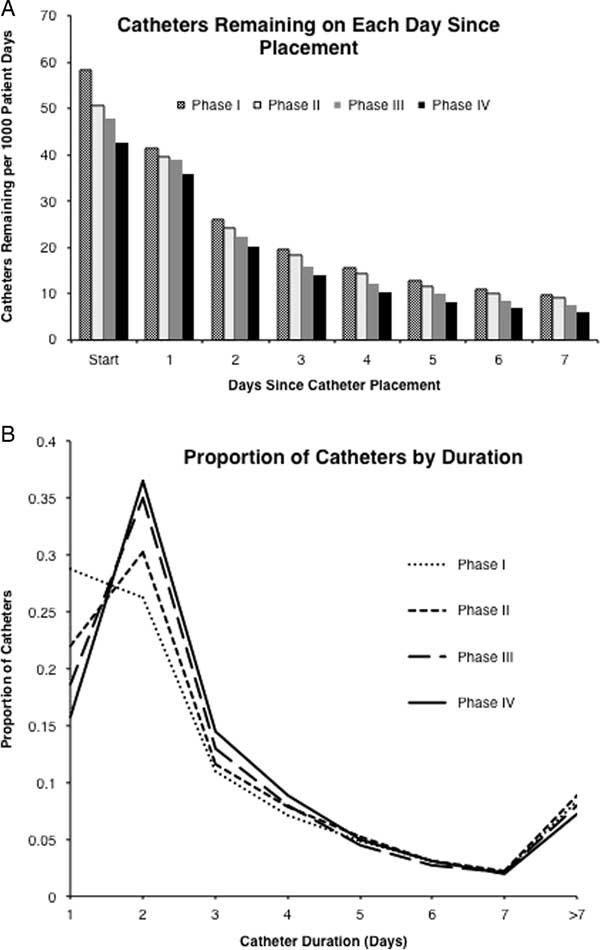
Mean catheter duration increased from 2·56 in phase 1 to 2·80 in phase 2 before declining to 2·62 in phase 3 and 2·49 in phase 4. However, in real terms, a steady decline occurred in catheters of all durations in each successive phase (Fig. 3A). The distribution density plot of catheter duration (Fig. 3B) shows that there was a proportionately greater decline in short-duration catheters (those lasting <1 full day) and a relative concentration of 1–3-day duration catheters, inflating the mean catheter duration. There was also a small decline in the proportion of catheters remaining >7 days in phases 3 and 4.
Catheters remaining and by duration. P<.001 was calculated using Kruskal-Wallis one-way analysis of variance.

Catheter reinsertion rate
The catheter reinsertion rate declined from 3·66% in phase 1 to 3·15% with real-time track in phase 2, then to 2·67% with the pop-up reminder in phase 3 before increasing slightly to 3·25% with the automated removal and placement criteria in phase 4. Overall, we detected an 11·2% decline in the reinsertion rate.
Clinician use of decision support tools
In phase 2, the real-time tracking tab received 11,662 clinician views, or 83 views per 10,000 hospitalized patient days (Table S1). By contrast, in phase 3, the triggered pop-up alert had 98,068 views, or 3,139 views per 10,000 patient days. Only a small portion of elective tab views led to an assessment (2·6%), whereas 62·8% of alerts were assessed and 37·2% opted out. Of the 23,386 IUCs assessed by pop-up alert viewers, the clinician selected “remove today” in 9·6% of instances, “maintain” in 67·5%, and “already removed” in 22·9%.
In response to the new order set in phase 4, clinicians chose to manage patients with an IUC alternative in only 0·9% of cases and to proceed with an IUC in 99·1% of cases. Table S2 delineates the frequency with which clinicians selected each alternative or indication. However, due to low baseline utilization rates, use of some alternatives increased dramatically, including 1,704% for straight catheterization and 607% for absorbent underpads (Table S3).
Discussion
In this longitudinal study, we demonstrated a significant reduction in IUC and CAUTI rates through the phased introduction of CDS across a multicampus academic medical center. Through an iterative process and EMR-centered implementation, the interventions progressively engaged a wide audience of nurses and physicians in their workflow to incrementally change practice habits and outcomes. Collectively, the tools targeted the complete life cycle of IUCs.
Nurse training in best practices and documentation
Efforts to standardize and train nurses in best practices around catheter placement and maintenance care techniques are a proven component of CAUTI reduction initiativesReference Gould, Umscheid, Agarwal, Kuntz and Pegues 11 , Reference Saint, Greene and Krein 18 , Reference Rosenthal, Guzman and Safdar 19 ; however, a natural limit likely applies to the gains that can be achieved without a reduction in catheter use.Reference Meddings and Saint 2 Our training initiative was associated with a dramatic decline in CAUTIs, which leveled off after ~12 months, and with minimal changes in overall catheter use.
Our approach was unique in that the training initiative also engaged nurses in the standardized documentation of catheters in the EMR, thus enabling real-time tracking and laying the groundwork for subsequent electronic CDS interventions. The overwhelming majority of prior catheter reduction efforts relied on dedicated personnel to track catheter use, limiting the opportunity to scale the intervention hospital-wide.Reference Meddings, Rogers, Krein, Fakih, Olmsted and Saint 6 By engaging all nurses at the level of their routine documentation practices, administrators employed the latest approaches to crowdsourcing hospital data,Reference Ranard, Ha and Meisel 20 and they were able to distribute the burden of measuring the key outcome in this quality improvement initiative.
Reducing catheter placement
The most surprising observation in our study was the dramatic and sustained decrease in new catheter placements shortly following the release of real-time catheter tracking in phase 2. The decline occurred after ~18 months of relatively stable rates in phase 1. Real-time tracking was intended to increase clinician awareness of existing catheters, and we hypothesized that it would lead to decreased catheter duration.Reference Seguin, Laviolle, Isslame, Coue and Malledant 21 We hypothesize that the tool raised clinician awareness of the hospital’s monitoring efforts, leading to a difference in clinician behavior by means of the Hawthorne effect.Reference McCambridge, Witton and Elbourne 22 The increase in mean catheter duration of 0·23 days in the same period was due to a disproportionate decrease in the placement of short-duration catheters (those remaining <1 full day) (Fig. 3B). An absolute reduction in catheters of all durations occurred with each phase of intervention (Fig. 3A).
Only the new order in phase 4 specifically targeted new catheter placement. Catheters are often placed without appropriate indicationReference Jain, Parada, David and Smith 23 , Reference Gardam, Amihod, Orenstein, Consolacion and Miller 24 and numerous guidelines and education initiatives have aimed to minimize initial use.Reference Knoll, Wright and Ellingson 7 , Reference Fakih, Watson and Greene 25 – Reference Dumigan, Kohan, Reed, Jekel and Fikrig 30 Our approach directed clinicians through guidelines at the point of decision making in the EHR order, which has mostly been reported in small pilot studiesReference Patrizzi, Fasnacht and Manno 27 – Reference Cornia, Amory, Fraser, Saint and Lipsky 29 with few hospital-wide implementations.Reference Knoll, Wright and Ellingson 7 The order set rarely (<1% of instances) led clinicians to select alternatives; however, given their low baseline utilization, we detected a dramatic increase in the overall use of these alternatives (Table S3). The impact of this intervention on new catheter placement was difficult to isolate because it followed prior, unexpected reductions; however, we detected a further decline in new catheter placement in phase 4 after relative stabilization between phases 2 and 3.
Promoting catheter removal
Reminders of catheter duration are a popular approach to promoting catheter removal, but empiric results are mixed. Several studies have shown that IUCs remain in use when they are no longer neededReference Huang, Wann and Lin 31 , Reference Murphy, Francis, Litzenberger and Lucente 32 and that physicians are often unaware of their presence.Reference Reilly, Sullivan, Ninni, Fochesto, Williams and Fetherman 33 In one meta-analysis,Reference Meddings, Rogers, Krein, Fakih, Olmsted and Saint 6 some reminders were associated with large effects, but the weighted mean did not meet statistical significance (standardized mean difference [SMD], −1·54; 95% confidence interval [CI], −3·20 to 0·13). Our triggered-reminder system in phase 3 was associated with a measurable reduction in mean catheter duration of 0.19 days from phase 2, a measure that underestimates the true effect size given the concurrent disproportionate decreased use of short-duration catheters. Total catheter days also declined by a greater percentage than new catheters between phase 2 and 3.
Electronic reminder systems effectively reach a wide clinical audience, but variable resultsReference Meddings, Rogers, Krein, Fakih, Olmsted and Saint 6 suggest that design and implementation drive success. Alert fatigue can lead users to ignore or override even well-designed reminders.Reference Weingart, Toth, Sands, Aronson, Davis and Phillips 34 , Reference Embi and Leonard 35 In CDS design, it is a common adage that successful tools provide the right information, to the right people, through the right channels, in the right format, and at the right points in the workflow.Reference Osheroff 10
Our alert synthesized and presented relevant nurse documentation to decision makers at a time when they were formulating a daily plan, thus streamlining interdisciplinary communication that might otherwise not occur.Reference Hripcsak, Vawdrey, Fred and Bostwick 36 The alert also stopped triggering until the following day once an assessment was made, avoiding repeated reminders. The triggered alert led to a nearly 40-fold increase in views of the tracking tool compared to the optional tab. Our opt-out rate (ie, users selecting “not primary clinician”) of 37·2% was lower than that reported in many prior studies,Reference Weingart, Toth, Sands, Aronson, Davis and Phillips 34 , Reference Embi and Leonard 35 but it still suggests that the reminder reached many clinicians for whom it was not intended. Additionally, only a relatively small portion of assessments (9·2%) led to a decision to “remove today.” Clinicians selected “maintain” in most cases (67·5%) and noted that the catheter had been “already removed” in 22.9% of cases, likely due to the lag time in our electronic tracking system (Table S1).
Automatic IUC order expiration, or standing stop orders, change the default option, a powerful technique in behavior modification,Reference Johnson and Goldstein 37 , Reference Stephan, Sax, Wachsmuth, Hoffmeyer, Clergue and Pittet 38 and one that is highly effective in promoting catheter removal.Reference Dumigan, Kohan, Reed, Jekel and Fikrig 30 , Reference Stephan, Sax, Wachsmuth, Hoffmeyer, Clergue and Pittet 38 – Reference Rothfeld and Stickley 40 In the aforementioned meta-analysis,Reference Meddings, Rogers, Krein, Fakih, Olmsted and Saint 6 standing stop orders yielded consistent reductions in catheter duration (SMD, −0·37 days; 95% CI, −0·56 to −0·18). In phase 4 of this study, we detected a further 0·23-day decrease in mean catheter duration and a further decline in total catheter days in addition to the prior reductions.
The limitation of automated removal protocols is that they require a change in the expectations and responsibilities of nurses and clinicians. Clinicians, fearing premature removal of catheters and increased need for reinsertion, may be reluctant to accept protocols that they perceive to supersede clinical judgment. Nurses may be uncomfortable assuming responsibility for decisions previously left to clinicians.Reference Wenger 41 As a result, automated protocols often require significant training and auditing; thus, they have largely been implemented in individual units.Reference Meddings, Rogers, Krein, Fakih, Olmsted and Saint 6 , Reference Andreessen, Wilde and Herendeen 28 , Reference Titsworth, Hester and Correia 42 In addition, adherence is often poor.Reference Stone, Pogorzelska-Maziarz and Herzig 43
Our intervention built on the existing electronic tracking platform and improved interdisciplinary communication to promote the rapid adoption of automatic removal orders across multiple campuses. Clinicians received an electronic warning about autoexpiration upon initial IUC order entry and each day of catheter use in the existing pop-up reminder. All orders expired at noon on day 2 after placement, giving clinicians many opportunities to assess catheter appropriateness before removal and monitor voiding trials afterward. Notably, we did observe a small increase in the reinsertion rate from 2·67% before automated removal to 3·25% afterward. This rate remained lower than the 3·66% rate at the start of the study period and was at the low end of rates reported in the literature,Reference Meddings, Rogers, Krein, Fakih, Olmsted and Saint 6 but this finding does support the hypothesized tradeoff between early removal and reinsertion.
Limitations
This study has 2 principal limitations. First, a before-and-after study design by nature does not account for confounding factors that could affect CAUTI rates and catheter use. While individual units may have had independent CAUTI initiatives, there were no other hospital-wide interventions targeting CAUTI during the study period. Second, our sequential approach (ie, 2 simultaneous interventions in phase 4, and the change in CAUTI definition in phase 4) makes it challenging to compare the effects of each strategy, though this was not our primary objective.
Conclusions and relevance
In conclusion, the phased introduction of CDS tools was associated with progressive declines in new catheters, total catheter days, and CAUTIs. Clinical decision support tools offer a viable and scalable intervention to target hospital-wide catheter use with potential application to other indwelling lines and devices.
Supplementary material
To view supplementary material for this article, please visit https://doi.org/10.1017/ice.2018.114
Acknowledgments
The authors wish to thank Rohit Chaudhry, Frank F. Hong, and Oliver (Jun) Yang (New York-Presbyterian Hospital) for assistance with data collection.
Financial support
The Value Institute and EpiPortal are supported by New York-Presbyterian Hospital. No external funding was used in support of this study.
Conflicts of interest
All authors report no conflicts of interest relevant to this article.