


1 Introduction
The flow around a road vehicle determines its aerodynamic drag. Most vehicles are blunt bluff bodies, meaning that the flow separates over the blunt back end of the vehicle (Hucho Reference Hucho1998). The wake flow is then composed of detached interacting shear layers, which form the envelope of a large low-pressure recirculation area and is responsible for most of the aerodynamic drag.
The wake topology is fundamental to the vehicle drag and lift forces. The investigations of Ahmed, Ramm & Faltin (Reference Ahmed, Ramm and Faltin1984) on a simplified road vehicle, the so-called Ahmed body, paved the way for a range of studies on reducing the aerodynamic drag of road vehicles (Choi, Lee & Park Reference Choi, Lee and Park2014). This has spanned passive control using boat tails/cavities (Verzicco et al. Reference Verzicco, Fatica, Iaccarino, Moin and Khalighi2002; Evrard et al. Reference Evrard, Cadot, Herbert, Ricot, Vigneron and Délery2016), splitter plates (Gilliéron & Kourta Reference Gilliéron and Kourta2010) and vortex generators (Krajnović Reference Krajnović2014) as well as open-loop control using jets (Roumeas, Gillieron & Kourta Reference Roumeas, Gillieron and Kourta2009; Barros et al. Reference Barros, Borée, Noack, Spohn and Ruiz2016). Closed-loop control has been applied more recently to three-dimensional Ahmed bodies (Brackston et al. Reference Brackston, García de la Cruz, Wynn, Rigas and Morrison2016; Li et al. Reference Li, Barros, Borée, Cadot, Noack and Cordier2016; Evstafyeva, Morgans & Dalla Longa Reference Evstafyeva, Morgans and Dalla Longa2017).
Recently, the relevance of symmetry-breaking behaviour in the wakes of blunt bluff bodies to aerodynamic drag has emerged. It is known that the laminar symmetric wake flow behind a flat disk becomes unstable above some Reynolds number, then undergoing a sequence of bifurcations which break the wake symmetry (Fabre, Auguste & Magnaudet Reference Fabre, Auguste and Magnaudet2008). This behaviour can be predicted via a weakly nonlinear analysis of the Navier–Stokes equations (Meliga, Chomaz & Sipp Reference Meliga, Chomaz and Sipp2009). Subsequent laminar flow experiments on an Ahmed body revealed very similar symmetry-breaking behaviour (Grandemange, Cadot & Gohlke Reference Grandemange, Cadot and Gohlke2012). Above a critical Reynolds number, the wake flow is no longer instantaneously symmetric, instead choosing one of two possible asymmetric states and remaining in that state – no switching between asymmetric states occurs and different experiments (initial conditions) can lead to a different choice of state.
A very recent finding is that this symmetry-breaking behaviour persists to high, turbulent Reynolds numbers (Grandemange, Gohlke & Cadot Reference Grandemange, Gohlke and Cadot2013b , Reference Grandemange, Gohlke and Cadot2014; Rigas et al. Reference Rigas, Oxlade, Morgans and Morrison2014), but with the flow now exhibiting switching between different asymmetric states. This switching occurs over slow, random time scales, typically three orders of magnitude slower than the vortex-shedding mode associated with separation at the blunt end of the body. This is known as bi-modality for square-back blunt bluff bodies and multi-modality for axisymmetric blunt bluff bodies (Grandemange et al. Reference Grandemange, Gohlke and Cadot2013b , Reference Grandemange, Gohlke and Cadot2014; Rigas et al. Reference Rigas, Oxlade, Morgans and Morrison2014; Varon et al. Reference Varon, Eulalie, Edwige, Gilotte and Aider2017). The system can be described by a Langevin model with the stochastic forcing term associated with turbulent flow fluctuations – thus turbulent forcing appears to perturb the flow causing it to switch from one asymmetric state to another (Rigas et al. Reference Rigas, Morgans, Brackston and Morrison2015; Brackston et al. Reference Brackston, García de la Cruz, Wynn, Rigas and Morrison2016). Grandemange, Gohlke & Cadot (Reference Grandemange, Gohlke and Cadot2013a ) showed that bi-modality can occur for blunt bluff bodies with a rectangular base across a wide range of aspect ratios. The existence of bi-modality and, if present, its axis (i.e. whether it occurs with top–bottom asymmetry or side–side asymmetry) was found to be sensitive to the bluff body aspect ratio, ground proximity, pitch/yaw angle or any flow perturbations (Grandemange et al. Reference Grandemange, Gohlke and Cadot2014; Barros et al. Reference Barros, Borée, Cadot, Spohn and Noack2017; Gentile et al. Reference Gentile, van Oudheusden, Schrijer and Scarano2017). Bi-modal switching has not only been observed in the case of simplified square-back geometries such as the Ahmed body (Grandemange et al. Reference Grandemange, Gohlke and Cadot2014) and the Windsor model (Pavia, Passmore & Sardu Reference Pavia, Passmore and Sardu2018) but also for real full-sized road vehicles (Bonnavion et al. Reference Bonnavion, Cadot, Évrard, Herbert, Parpais, Vigneron and Délery2017). Its presence affects the forces and moments on the body, including the aerodynamic drag.
Thus far, studies of the bi-modality of blunt bluff body wakes have employed wind tunnel experiments. Simulations which accurately capture the wake unsteadiness at high Reynolds number, and which furthermore extend over the large time scales of bi-modal switching, are very costly. Unsteady simulations of simplified bluff body flows have been performed using partially averaged Navier–Stokes (PANS), simulations (Mirzaei, Krajnović & Basara Reference Mirzaei, Krajnović and Basara2015; Rao et al. Reference Rao, Minelli, Zhang, Basara and Krajnović2018a ), unsteady Reynolds-averaged Navier–Stokes simulations (Khalighi, Chen & Iaccarino Reference Khalighi, Chen and Iaccarino2012), detached eddy simulations and large eddy simulations (Krajnović & Davidson Reference Krajnović and Davidson2003; Serre et al. Reference Serre, Minguez, Pasquetti, Guilmineau, Deng, Kornhaas, Schäfer, Fröhlich, Hinterberger and Rodi2013; Aljure et al. Reference Aljure, Lehmkuhl, Rodriguez and Oliva2014; Östh et al. Reference Östh, Noack, Krajnović, Barros and Borée2014; Rao et al. Reference Rao, Zhang, Minelli, Basara and Krajnović2018b ), some also employing a lattice Boltzmann formulation (Roumeas et al. Reference Roumeas, Gillieron and Kourta2009; Lucas et al. Reference Lucas, Cadot, Herbert, Parpais and Délery2017). Recent lattice Boltzmann simulations by Lucas et al. (Reference Lucas, Cadot, Herbert, Parpais and Délery2017) successfully captured wake asymmetry, but not the presence of two asymmetric states nor any wake switching. Similarly, Rao et al. (Reference Rao, Minelli, Zhang, Basara and Krajnović2018a ) observed asymmetric wakes using PANS simulations for various grid resolutions and numerical schemes. To our knowledge, no simulations have yet captured a blunt bluff body wake exhibiting bi-modal switching.
The present study achieves what we believe are the first simulations of wake bi-modality, capturing both asymmetric states, for a blunt bluff body. No artificial forcing nor inlet perturbations are applied to trigger bi-modality; the flow develops naturally from a steady inlet velocity condition, with bi-modal switches occurring randomly. Two bluff bodies are considered, the first being taller than it is wide, with an aspect ratio corresponding to European lorries. Wind tunnel experiments by Cabitza (Reference Cabitza2013), performed on an almost identical geometry at higher Reynolds number, were used for flow correlation. The second body is the conventional Ahmed body, chosen in its square-back configuration, matching exactly the experiments of Grandemange et al. (Reference Grandemange, Gohlke and Cadot2013a ). The simulations provide richer access to flow-field data than is achievable experimentally, allowing an in-depth analysis of the wake topology changes associated with bi-modality. This article presents the simulation set-ups (§ 2), the wake flow results and in particular the bi-modal switching sequence (§ 3), a modal analysis of the wake (§ 4) and finishes with concluding remarks.
2 Simulations set-up and validation
Large eddy simulations were performed on two square-back bluff bodies:
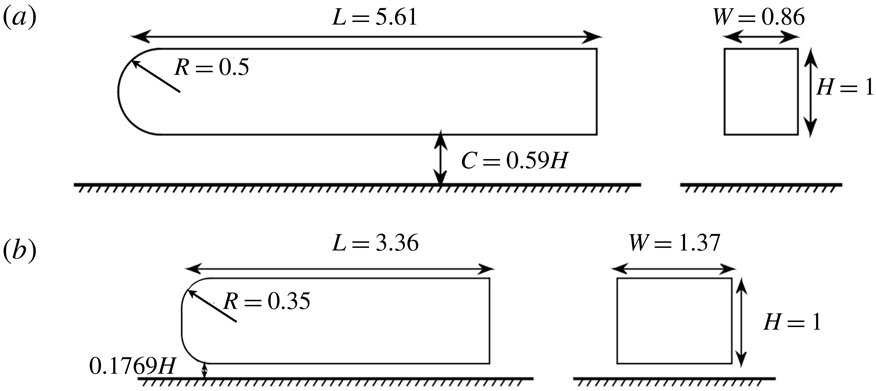
Case 1. A simplified lorry whose dimensions correspond to a 15 % scaled model of a European lorry (see figure 1). Its aspect ratio is
 $H^{\ast }=H/W=1.16$
, where
 $H$
and
 $W$
are the body height and width. The gap between the body and the fixed road is
 $C^{\ast }=C/W=0.68$
. The nose is rounded to minimise front separation. These settings were chosen to match the experimental work of Cabitza (Reference Cabitza2013). The Reynolds number in this case is
 $Re_{H}=20\,000$
. This value was found to be sufficient to ensure a fully turbulent boundary layer at separation, where the shape factor
 $H_{sf}=\unicode[STIX]{x1D6FF}^{\ast }/\unicode[STIX]{x1D703}\simeq 1.2$
(
 $\unicode[STIX]{x1D6FF}^{\ast }$
being the displacement thickness and
 $\unicode[STIX]{x1D703}$
the momentum thickness).
(a) Simplified lorry geometry and (b) square-back Ahmed body geometry. For both geometries, the side view is shown on the left and the rear view on the right.

Case 2. A square-back Ahmed body at
 $Re_{H}=33\,000$
. Its aspect ratio is
 $H^{\ast }=H/W=0.73$
and the gap between the body and the fixed road is
 $C^{\ast }=C/W=0.128$
. These dimensions and Reynolds number correspond to the Ahmed body configuration studied experimentally by Grandemange et al. (Reference Grandemange, Gohlke and Cadot2013a
).
The domains for the simulations were chosen according to ERCOFTAC recommendations for the Ahmed body. The domain size for the Ahmed body was chosen such that
 $(L_{inlet},L_{domain},H_{domain},Z_{domain})=(1.3L,6.3L,1.6L,1.6L)$
where
 $L_{inlet}$
is the length in the
 $x$
-direction of the upstream section before the body and
 $L_{domain}$
,
 $H_{domain}$
and
 $Z_{domain}$
are respectively the length, height and width of the domain. In the case of the lorry, the domain size was scaled by the body height
 $H$
to keep the streamwise domain size reasonable. As a result, dimensions in this case were chosen such that
 $(L_{inlet},L_{domain},H_{domain},Z_{domain})=(7H,31H,5H,5W)$
.
A steady uniform velocity was set at the inflow; a no-slip condition was used on the floor and on the body surfaces. Free-slip conditions were prescribed on lateral walls and on the roof and a convective outflow condition was set at the outlet. The flow is started from an initial inlet velocity condition and develops naturally without the addition of external perturbations.
An incompressible large eddy simulation solver, STREAM-LES, developed by Lardat & Leschziner (Reference Lardat and Leschziner1998) was used to compute the flow around the present square-back geometries. This is a finite volume code which solves the three-dimensional Navier–Stokes equations in a block-structured domain. Pressure correction is computed using the Poisson equation and the velocity field is solved via a co-located finite volume method, using a second-order accurate scheme for the fluxes. Time marching is obtained by using a third-order gear-like fractional step algorithm. A wall-adapting local eddy-viscosity sub-grid-scale model is employed to represent the smaller turbulent scales, this model accounting for the vanishing behaviour of the eddy viscosity near the walls. This solver has been extensively tested and validated by Temmerman (Reference Temmerman2004) and more recently applied to a range of bluff body flows (Dahan, Morgans & Lardeau Reference Dahan, Morgans and Lardeau2012; Dalla Longa, Morgans & Dahan Reference Dalla Longa, Morgans and Dahan2017; Evstafyeva et al. Reference Evstafyeva, Morgans and Dalla Longa2017).
Baseline grids used in the simulation,
 $xy$
slice, side view. (a) Simplified lorry configuration, (b) Ahmed body configuration. Only showing a quarter of the points for clarity.

Grid checks were performed by increasing the number of cells in all directions until reaching convergence of the results. Eventually, a baseline mesh composed of 56.6 million cells was chosen for both bluff bodies (figure 2). These baseline meshes were already refined compared with similar numerical studies performed at higher Reynolds number (Krajnović Reference Krajnović2014; Östh et al.
Reference Östh, Noack, Krajnović, Barros and Borée2014; Lucas et al.
Reference Lucas, Cadot, Herbert, Parpais and Délery2017), and are sufficiently refined near the body walls such that
 $y^{+}\simeq 1$
for both cases, the widely held benchmark for which the turbulent boundary layer can be taken to be properly resolved. Additional finer meshes were also used for comparison, these having the same first cell height (and hence
 $y^{+}$
) as the baseline grid, but more closely spaced cells in the boundary layer region beyond this, around the bluff body and in the wake. Note that the maximum streamwise and spanwise cell sizes at separation for the baseline grid were
 $\max (\unicode[STIX]{x0394}x^{+})=0.66$
and
 $\max (\unicode[STIX]{x0394}z^{+})=3.67$
for the Ahmed body case and
 $\max (\unicode[STIX]{x0394}x^{+})=6.50$
and
 $\max (\unicode[STIX]{x0394}z^{+})=10.81$
for the lorry case. The Courant–Friedrichs–Lewy number in the simulations is dynamic and bounded below 0.25. All grids were symmetric around the body to avoid introducing asymmetry in the flow. In order to capture the large-time-scale bi-modal behaviour, simulations were run on Imperial College and ARCHER (the UK National Supercomputing service) clusters for up to 8–10 days on several thousand cores.
Numerical simulations were compared to experimental results respectively from Cabitza (Reference Cabitza2013) and Grandemange et al. (Reference Grandemange, Gohlke and Cadot2013a
) for the two different bluff body configurations. Results from different grid refinements are summarised in tables 1 and 2 and show the correlation of the numerical results to the experimental data available. The base pressure coefficient is defined as
 $C_{p_{b}}=\int ((p-p_{0})/(\unicode[STIX]{x1D70C}U_{0}^{2}/2))\,\text{d}S$
integrated over the base surface
 $S=HW$
.
Case 1 (simplified lorry): summary of the grid refinement study. The time-averaged base pressure
 $\overline{C_{p_{b}}}$
and the bubble pumping frequency
 $St_{H\text{-}b.p.}$
are compared. Experimental values from Cabitza (Reference Cabitza2013) are also included.

Case 2 (Ahmed body): summary of the grid refinement study. The time-averaged base pressure
 $\overline{C_{p_{b}}}$
and the wake recirculation length are used for comparison. Experimental values from Grandemange et al. (Reference Grandemange, Gohlke and Cadot2013a
) are also included.

3 Results
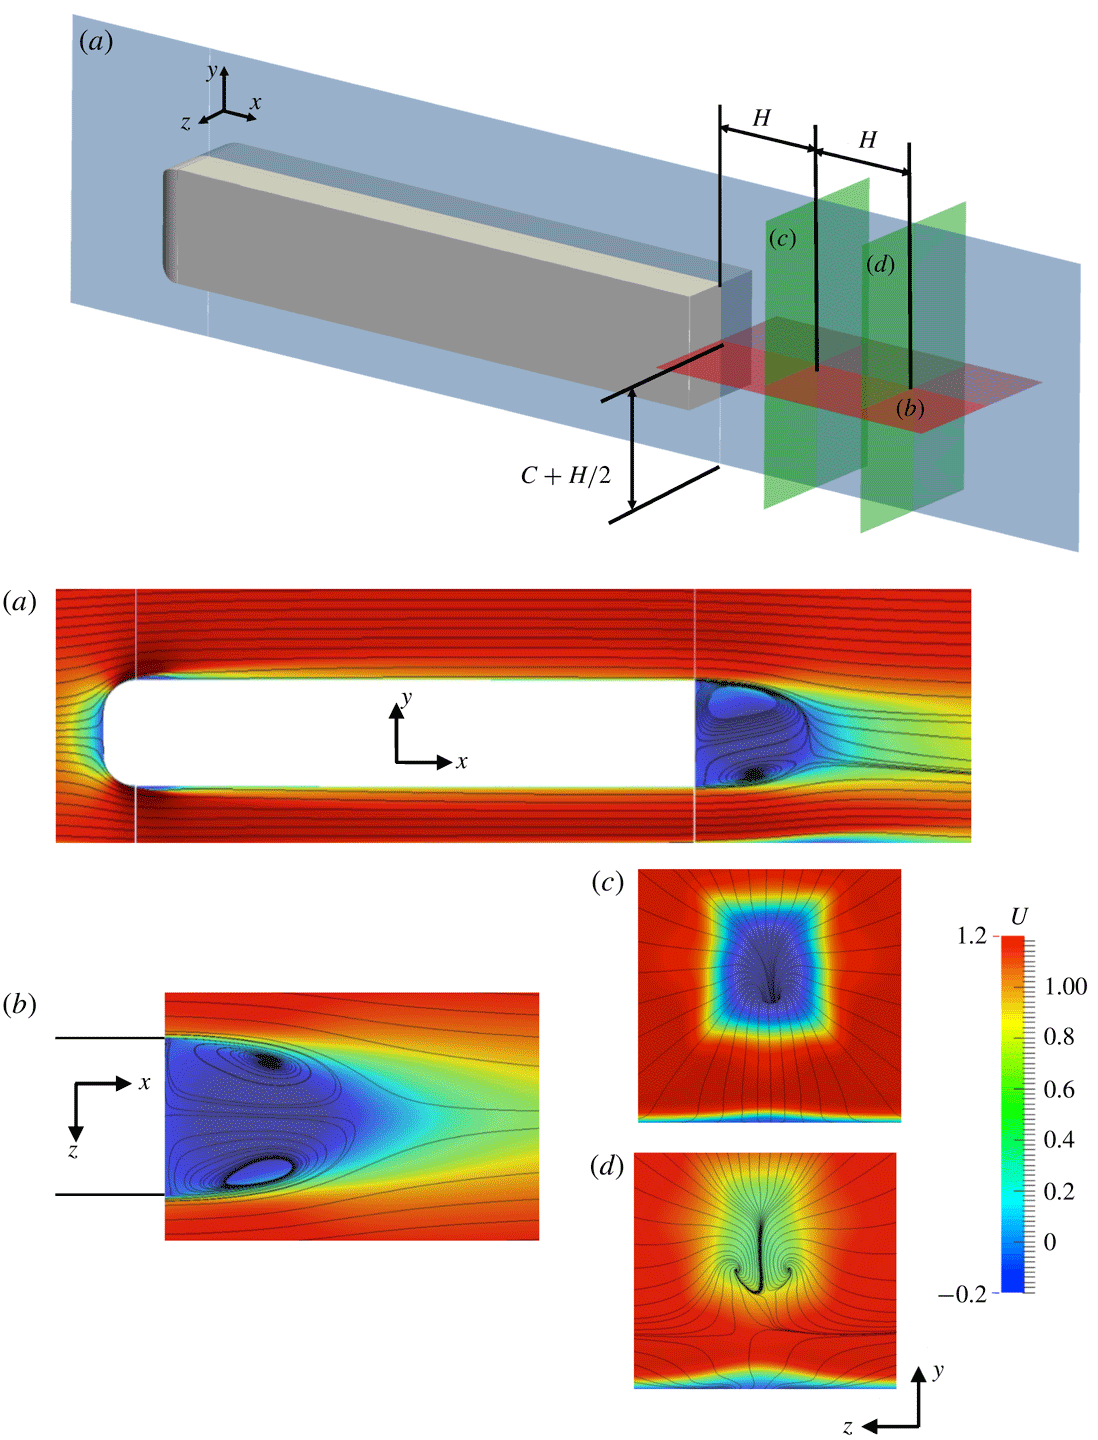
Case 1 (simplified lorry): time-averaged streamwise velocity field
 $U$
and projected streamlines. (a) Side view in the symmetry plane
 $z=0$
, (b) top view in the symmetry plane
 $y=C+H/2$
, (c,d) downstream planes at
 $x=H$
and
 $x=2H$
. The locations of the planes are shown in the upper schematic. Results are obtained using the baseline grid.

The time-averaged flow downstream of the simplified lorry is shown in figure 3. The flow separates over the blunt end of the body and forms a large recirculation area, with the low-pressure bubble extending up to
 $x=1.17H$
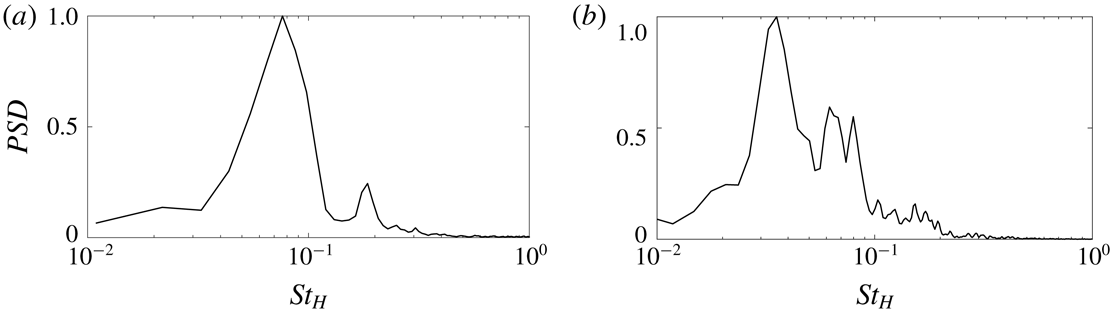
downstream (the recirculation length being defined as the streamwise distance between the bluff body base and the wake stagnation point). The time-averaged wake is symmetric in the horizontal direction but slightly asymmetric in the vertical direction due to the presence of the floor. A small recirculation region appears on the fixed floor due to the upwash flow. Figure 5 shows the spectra of the base pressure force. Two main modes are captured. The main peak at a frequency
 $St_{H}\sim 0.08$
corresponds to the bubble pumping mode, caused by the wake oscillation. The second peak at
 $St_{H}\sim 0.18$
corresponds to the vortex-shedding mode generated by the detached shear layers at the rear end of the body.
Case 2 (Ahmed body): time-averaged streamwise velocity field
 $U$
and projected streamlines. The locations of the planes match the schematic from figure 3. Results are obtained using the baseline grid.

The time-averaged wake behind the Ahmed body is shown in figure 4. The wake is asymmetric in the vertical direction due to the ground effect caused by the smaller underbody gap. The wake also appears asymmetric in the horizontal direction; this occurs because the wake spent an uneven amount of time in the two asymmetric positions. Indeed we expect the wake to recover horizontal symmetry as the simulation is extended and the wake spends an equal time on the left and right side of the base. Figure 5 shows the spectra of the base pressure force. A main peak at a frequency
 $St_{H}\sim 0.04$
is captured, corresponding to the bubble pumping mode. Several other frequencies are also captured in the wake in the range
 $St_{H}=0.08{-}0.20$
corresponding to the vortex-shedding frequency coming from the horizontal and vertical edges of the base (Grandemange et al.
Reference Grandemange, Gohlke and Cadot2013b
).
Energy spectrum of the pressure signal integrated over the body base. Filtering is applied using pwelch function for clarity. (a) Simplified lorry, (b) Ahmed body.

Regions of bi-modality from Grandemange et al. (Reference Grandemange, Gohlke and Cadot2013a
) at
 $Re_{W}=45\,000$
, with the limits
 $H_{1}^{\ast }$
and
 $H_{2}^{\ast }$
obtained in the experiments. The yellow star and the pink diamond indicate the respective locations of the simplified lorry geometry and the Ahmed body geometry.

Next the asymmetry of wake behind both bluff bodies is investigated. Grandemange et al. (Reference Grandemange, Gohlke and Cadot2013a
) mapped the presence of vertical or horizontal bi-modality as a function of bluff body aspect ratio and underbody gap size. The current geometries are shown in the context of their mapping in figure 6. The Ahmed body lies in the domain exhibiting horizontal bi-modality whereas the lorry is seen to lie near the boundary of the interfering region. This means that both vertical and horizontal bi-modality can occur. Experimentally it has been observed that even when a geometry can exhibit both bi-modalities over a series of different experiments/runs, only one is observed in any given experiment/run – they are never both observed simultaneously. Note that the Reynolds number in the Grandemange et al. (Reference Grandemange, Gohlke and Cadot2013a
) experiments was
 $Re_{W}\simeq 45\,000$
(equivalent to
 $Re_{H}\simeq 52\,200$
for the corresponding lorry aspect ratio
 $H^{\ast }=1.16$
) whereas in the current lorry simulations
 $Re_{H}=20\,000$
. It is highly probable that the boundaries of appearance of bi-modality are dependent on the Reynolds number. At lower Reynolds number, the floor is expected to have a stronger influence on the wake as the underbody flow is slower and the boundary layers are thicker. Indeed, even with the current large underbody gap, we observe some vertical asymmetry in the wake. This vertical asymmetry reduces the likelihood of the vertical bi-modality. Furthermore, the disturbances shed by the small separation at the front nose of the body will be dependent on Reynolds number and may also influence bi-modality. It is therefore possible that the horizontal bi-modality exists for a wider range than in the configuration of Grandemange et al. (Reference Grandemange, Gohlke and Cadot2013a
) and thus their mapping should be used only qualitatively in the lorry case.
Variation of the base pressure gradients in the
 $z$
and
 $y$
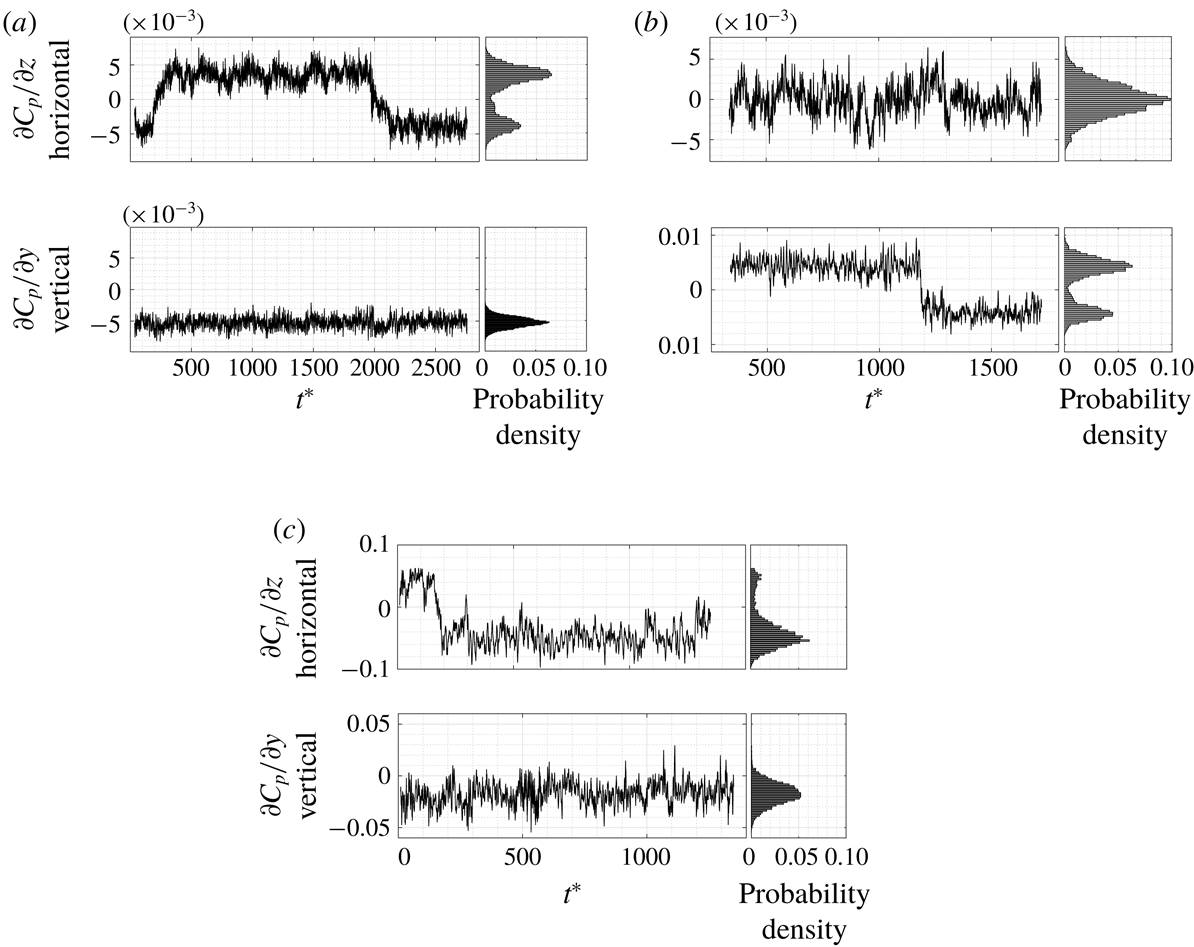
directions over time and their corresponding probability distribution. (a) Simplified lorry – baseline grid, (b) simplified lorry – very fine grid, (c) Ahmed body – baseline grid.

In order to assess the asymmetry of the body wake and ascertain whether the wake exhibits bi-modality, spatial gradients in base pressure were analysed in both the vertical (
 $\unicode[STIX]{x2202}C_{p}/\unicode[STIX]{x2202}y$
) and horizontal (
 $\unicode[STIX]{x2202}C_{p}/\unicode[STIX]{x2202}z$
) directions. For the simplified lorry case, two behaviours are observed. We can see in figure 7(a) that for the baseline grid case, two peaks are present in the horizontal (
 $z$
) gradient probability density, meaning that the wake is bi-modal in the horizontal direction. The wake which is initially located on the left-hand side of the base (‘positive
 $z$
location’) moves to the right-hand side of the base (‘negative
 $z$
location’) at
 $t^{\ast }\simeq 200$
and stays in this position until
 $t^{\ast }\simeq 2000$
when it goes back to its original left-hand location (here
 $t^{\ast }$
is the non-dimensional time defined as
 $t^{\ast }=tU_{0}/H$
). We expect the two locations to become equally probable as the simulation is extended. Due to the large time scale of the phenomenon, only two bi-modal switches were captured in this simulation. Note that the wake is slightly asymmetric in the vertical direction due to the presence of the floor, and fluctuates around this shifted position exhibiting a Gaussian distribution. It can also be observed that when the wake undergoes a horizontal switch, the vertical pressure gradient is affected, decreasing as the wake moves towards the bottom to reach the opposite location.
Using the very fine grid (figure 7
b), two peaks are now present in the vertical (
 $y$
) gradient probability density, meaning that the wake is bi-modal in the vertical direction. The wake undergoes a change of location at
 $t^{\ast }\simeq 1180$
, moving from its original top state (i.e. upper state, far away from the ground) towards the bottom state (i.e. lower state, closer to the ground), where the wake remains for the rest of the simulation. Horizontally, large oscillations occur. Because of the large computational cost of running the very fine grid, the simulation could not be sufficiently extended to obtain a second switch.
It therefore appears that even though the mean and main unsteady flow quantities are correctly converged between the two grids, over-refinement of the grid affects the direction of the bi-modality. In the case of the lorry, either vertical or horizontal bi-modality can appear in the simulations depending on the grid refinement chosen. As for the Ahmed body experiments of Grandemange et al. (Reference Grandemange, Gohlke and Cadot2013a ), one bi-modality direction dominates over the other, and bi-modality in both directions is not observed within a single simulation. At this point, the nature of the mechanism that establishes and maintains the direction of the bi-modality remains an open question.
In the Ahmed body case (figure 7
c), the horizontal (
 $z$
) base pressure gradient distribution exhibits two peaks which indicates the presence of horizontal bi-modality. The wake, initially on the left-hand side, moves to the right at
 $t^{\ast }\simeq 160$
. Meanwhile, large fluctuations are measured in the vertical pressure gradient forming a Gaussian distribution around an off-centred location, shifted by the presence of the floor. Note that bi-modality was only observed in the horizontal direction for this case.
Normalized probability distribution of the horizontal and vertical base pressure gradients versus the base pressure. (a) Simplified lorry – baseline grid, (b) simplified lorry – very fine grid, (c) Ahmed body – baseline grid.

Figure 8 shows the phase diagrams of the probability density functions, PDF
 $(\unicode[STIX]{x2202}C_{p}/\unicode[STIX]{x2202}z,C_{p_{b}})$
and PDF
 $(\unicode[STIX]{x2202}C_{p}/\unicode[STIX]{x2202}y,C_{p_{b}})$
. For the simplified lorry using the baseline grid, we observe the presence of two attractors located at an equal distance from the centre of symmetry. Both states are mirrored and have similar base pressure (i.e. similar drag). We can see also that within each state, large oscillations in base pressure occur. For the very fine grid, the vertical bi-modality results in two attractors in the vertical gradient plane, as shown in figure 8. Similarly to the baseline case of the lorry, the Ahmed body case exhibits two attractors in the horizontal (
 $z$
) direction and large pressure oscillations around these attractors. The wake spent more time in one of the asymmetric states, resulting in one attractor being larger than the other. We expect both states to be mirrored as the simulation is extended and more switches are observed.
Instantaneous snapshots of iso-contours of pressure
 $C_{p}=-0.15$
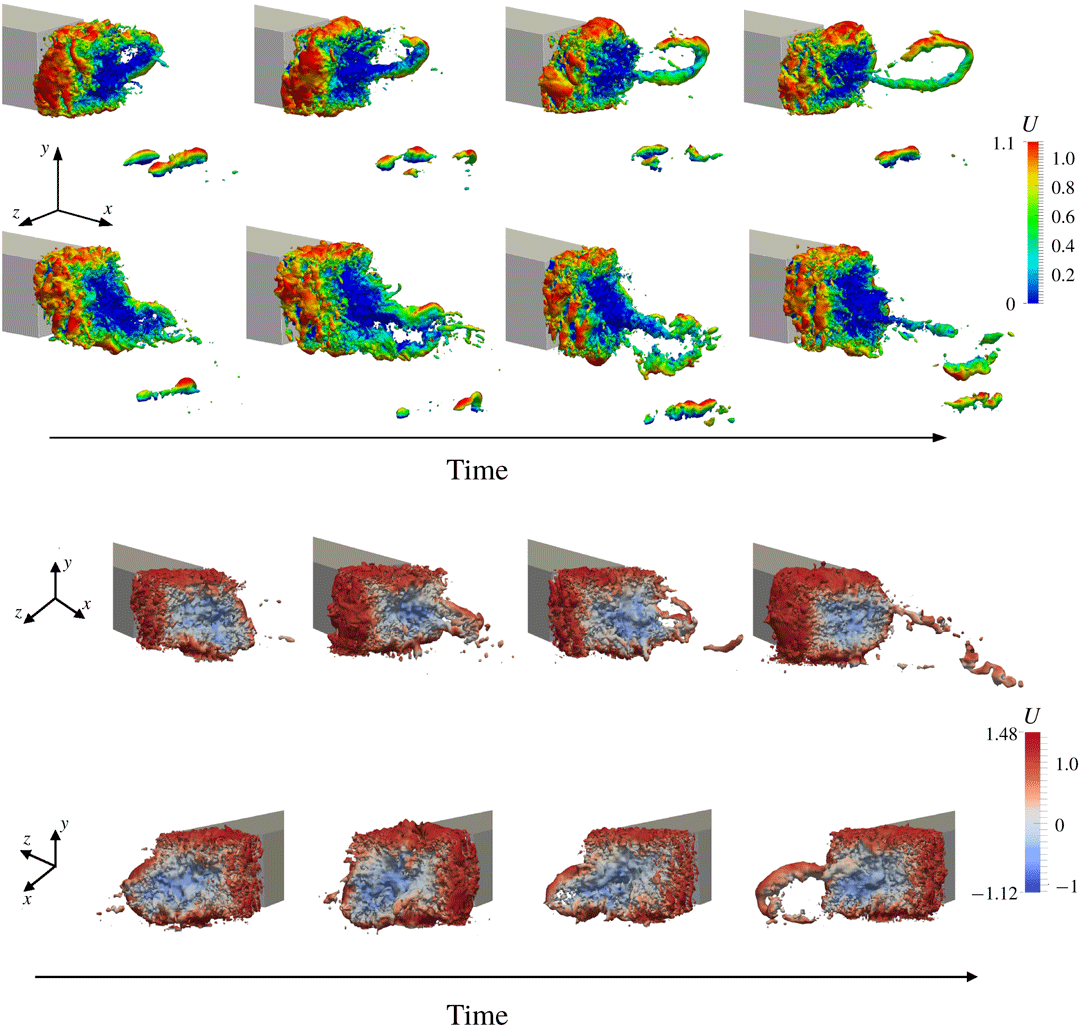
coloured by velocity. From top to bottom row: simplified lorry case – wake in ‘top’ state, simplified lorry case – wake in ‘bottom’ state, Ahmed body case – wake in ‘right’ state, Ahmed body case – wake in ‘left’ state.

For blunt bluff body flows, it is well known that a low-pressure toroidal vortex structure typically appears in the near wake, and can be visualised by considering iso-contours of negative pressure coefficient (Krajnović & Davidson Reference Krajnović and Davidson2003; Roumeas et al. Reference Roumeas, Gillieron and Kourta2009; Lucas et al. Reference Lucas, Cadot, Herbert, Parpais and Délery2017). Figure 9 shows high-frequency snapshots of these pressure iso-contours for the very fine grid simulations of the lorry and the baseline grid simulations of the Ahmed body, respectively exhibiting vertical and horizontal bi-modality. It is apparent that the toroidal structure is tilted depending on the asymmetric position of the wake. This observation differs from the schematic drawings of Evrard et al. (Reference Evrard, Cadot, Herbert, Ricot, Vigneron and Délery2016) and Perry, Pavia & Passmore (Reference Perry, Pavia and Passmore2016), who suggested that the toroidal structure was broken by bi-modality. The snapshots also reveal the presence of large hairpin structures being shed from the longest part of the wake (i.e. they originate from the wake edge located further from the body). These hairpin structures are different from the toroidal vortex structure located in the wake recirculation region, and are swept downstream.
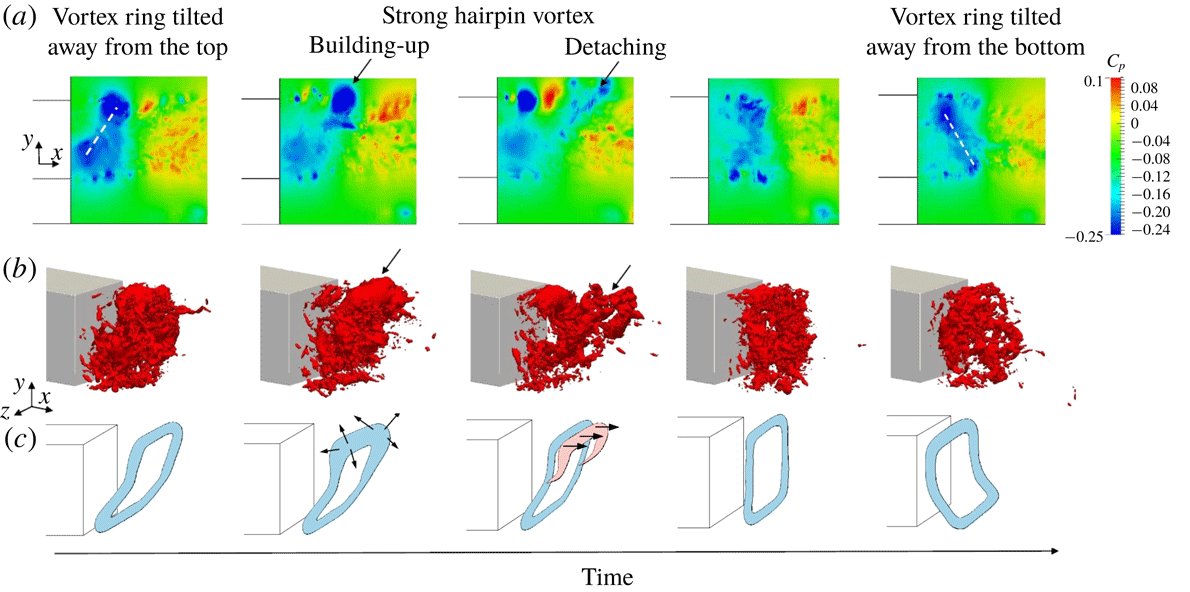
Case 1 (simplified lorry): bi-modal switching sequence. (a) Instantaneous snapshots of the wake pressure field in the vertical symmetry plane of the body (side view). (b) Instantaneous iso-contours of pressure taken at
 $C_{p}=-0.2$
. (c) Schematic of the toroidal vortex structure during the switch. The wake moves from ‘top’ to ‘bottom’ during the switch.

3.1 Wake switching event
In the current simulations, bi-modal switching is not triggered by artificial forcing but occurs randomly during the simulations. To further understand the bi-modal switching phenomenon, the flow field during a switch was investigated in more detail by taking very high-frequency snapshots and by placing probes downstream of the bluff body. The present analysis pertains to the very fine grid for the lorry case – this being the most refined and computationally expensive, exhibits the smoothest flow structures. The snapshot frequency is chosen as
 $St_{H\text{-}snapshot}=2.86$
so that the transition between two snapshots is visually ‘smooth’. Figure 10 shows the evolution of the pressure field in the vertical symmetry plane of the body (side view) as the wake moves from the ‘top’ to the ‘bottom’ location. It also shows the three-dimensional iso-pressure contours in the wake. We can see the toroidal low-pressure structure which is initially tilted away from the top. When the wake is in its top asymmetric state, the top of the toroidal vortex oscillates and its location is highly affected by the shedding of hairpin vortices shown in figure 9. These hairpin vortices randomly vary in size and strength. Large hairpin vortices pull the top boundary of the toroidal vortex downstream. Soon after, a new low-pressure core appears near the top part of the body base. Subsequently, the toroidal vortex splits and loses coherence before reconnecting with the new low-pressure core. In this simulation, the shedding of the hairpin vortices appears to be responsible for initiating the bi-modal switch. Indeed during the switch, a strong enough hairpin vortex pulls the wake downstream and as the vortex structure ‘reconnects’, the newly formed toroidal vortex is now tilted away from the bottom as in the sequence shown in figure 10. The sequence duration is very short (
 $\unicode[STIX]{x0394}t_{switch}^{\ast }\simeq 20$
) and occurs randomly which highlights the difficulty in visualising and investigating it.
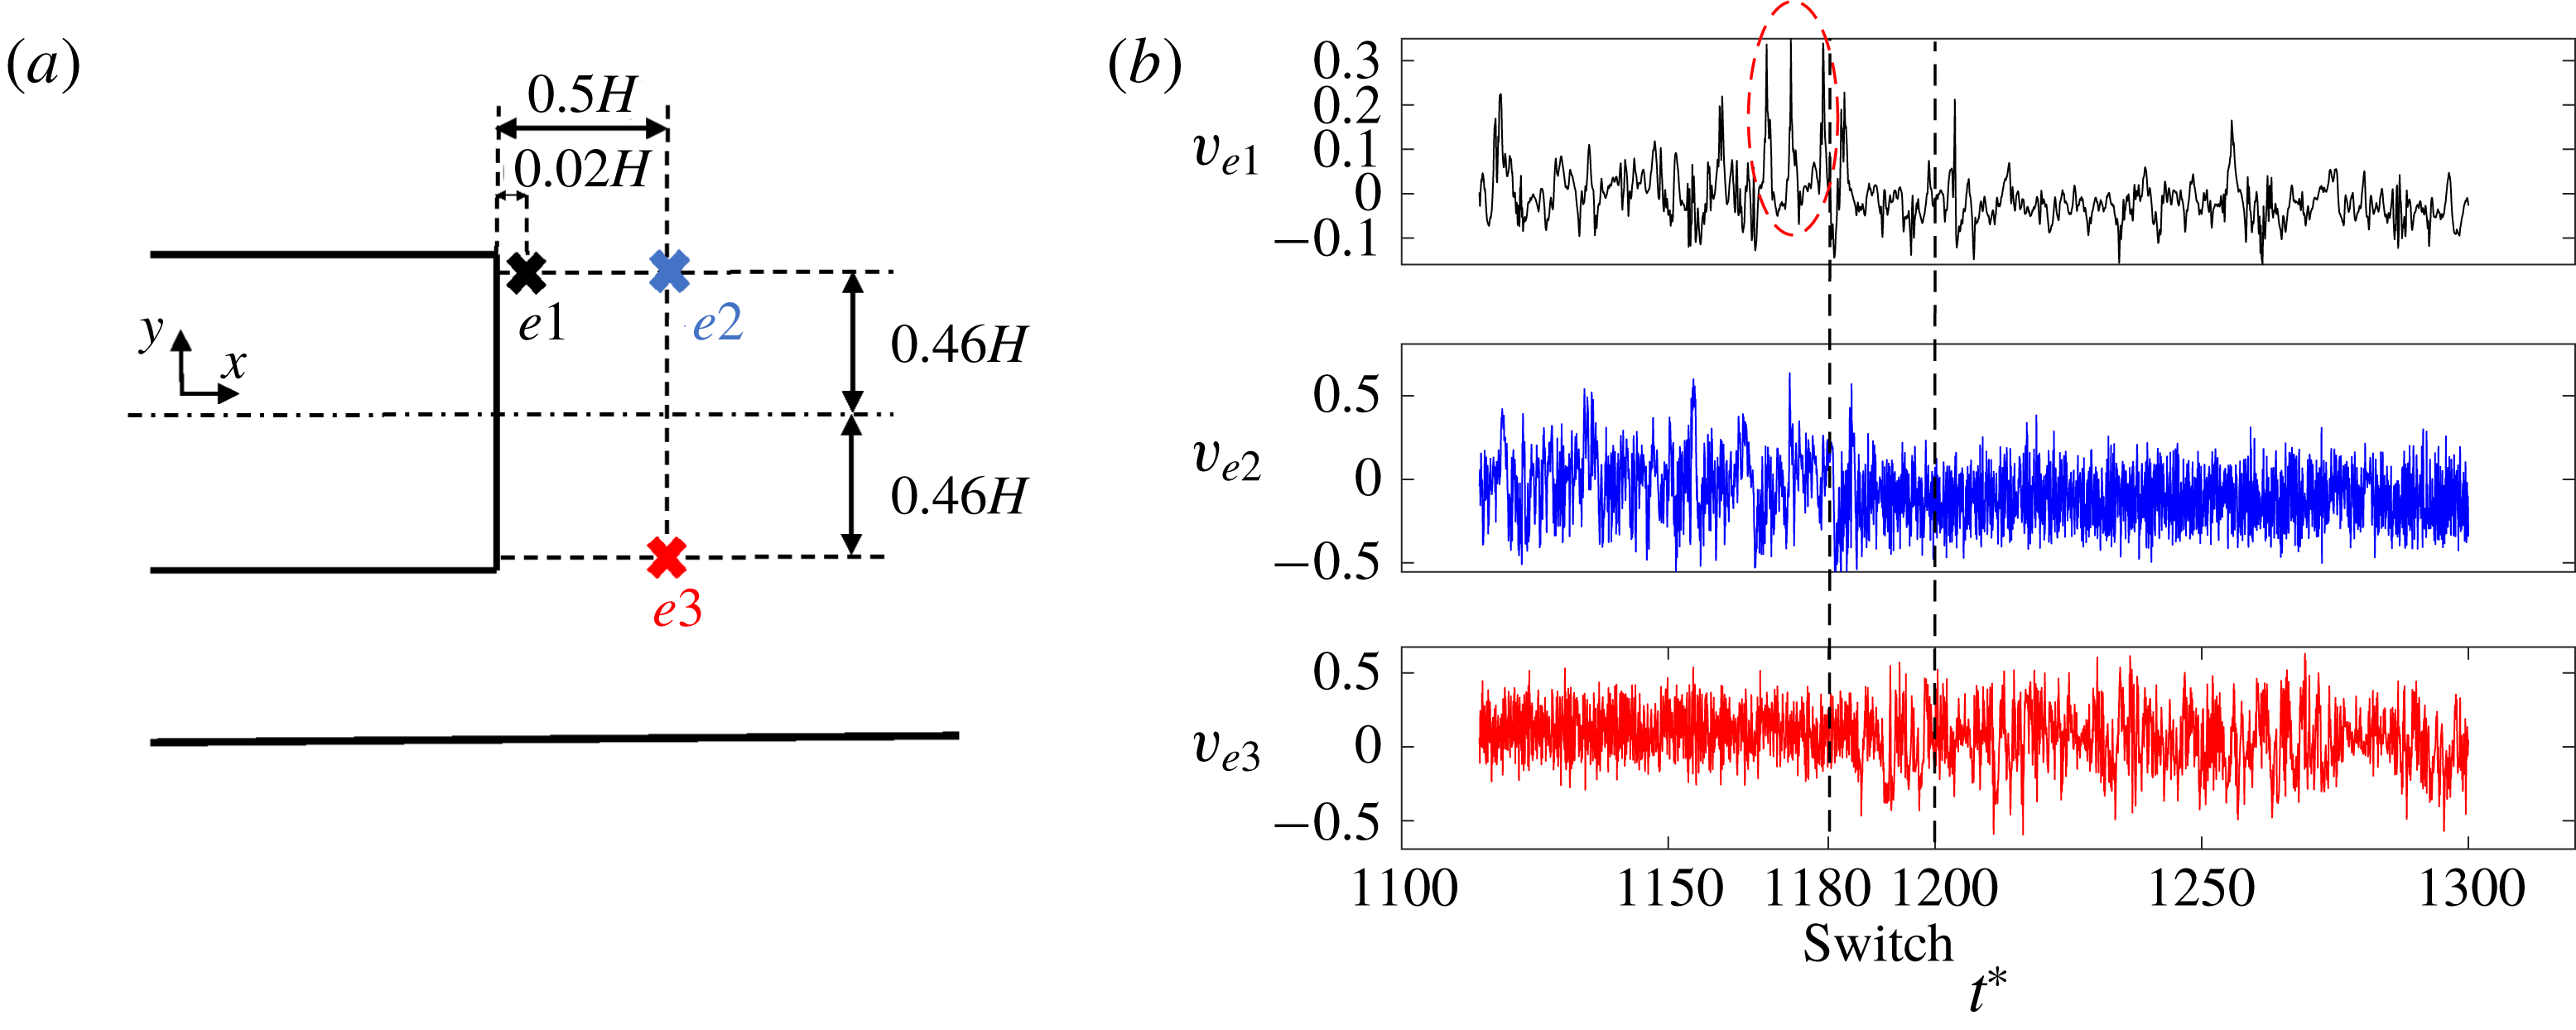
Additionally probes placed at different locations of the wake measured pressure and velocity components (figure 11). Before the switch occurs, the vertical component of the velocity (
 $v$
) near the top edge of the base (measured by the probe
 $e1$
) exhibits unusually large fluctuations, coinciding with the presence of a stronger hairpin vortex. The probes
 $e2$
and
 $e3$
located further downstream and near the top and bottom shear layers respectively, show the change in vertical velocity fluctuations once the switch occurs. The probe
 $e2$
located at the top was initially in the core of the low-pressure wake and recorded intense fluctuations. When the wake moves from top to bottom, the pressure fluctuation level drops. The sequence is the opposite for the sensor
 $e3$
located at the bottom.
Case 1 (simplified lorry): location of the velocity probes (
 $e1,e2,e3$
) in the bluff body symmetry plane
 $z=0$
(a). Vertical velocity
 $v$
measured by the probes during the switch (b). The red ellipse highlights the unusually large velocity fluctuations before the switch occurs caused by a large hairpin vortex.
The triggering event and switch sequence are reminiscent of the work of Podvin & Sergent (Reference Podvin and Sergent2017) who studied the bi-modal behaviour of a two-dimensional Rayleigh–Bénard cell. This flow also exhibits bi-modality in the form of random flow reversals. Their simulations showed that before a bi-modal switch, a precursor event ‘disconnects’ the core vortex region from the boundary layers. During the switch, this main vortex then splits before reconnecting into an oppositely rolled vortex corresponding to the second asymmetric state.
4 Modal analysis
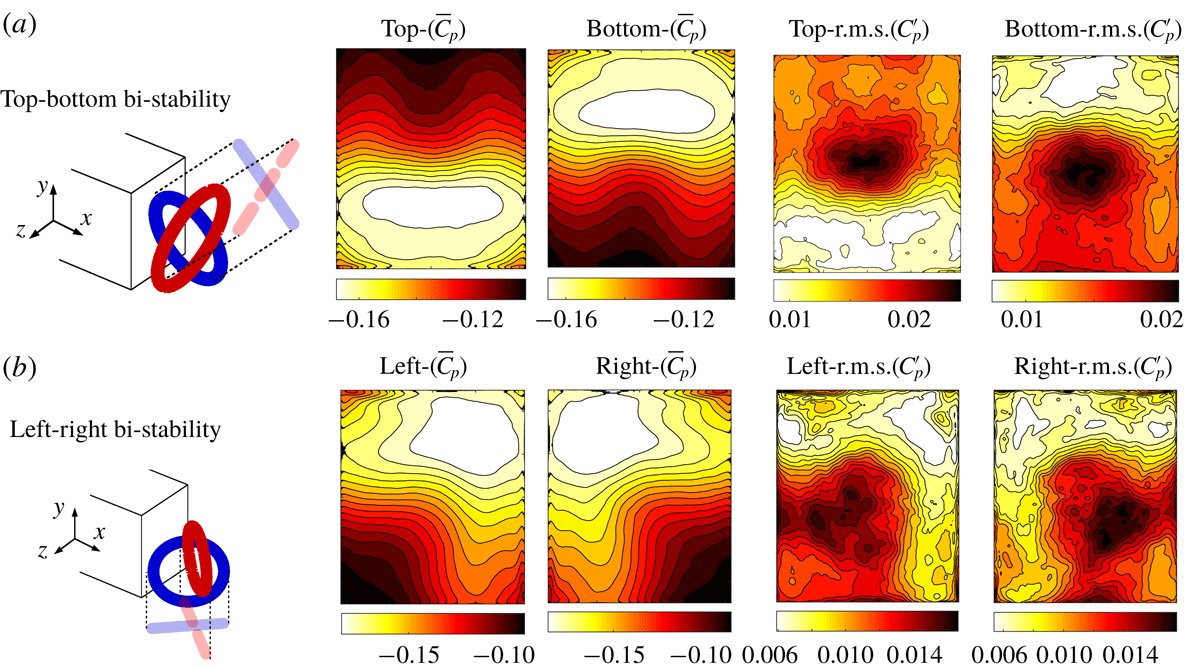
In order to further investigate changes in the wake dynamics and topology induced by bi-modality, modal decomposition is now applied to the asymmetric wake states of the flow past the lorry. Snapshots of the base pressure were taken for each wake state of the baseline and the very fine grid configurations. In total four samples of snapshots, representing the top, bottom, left and right configurations, were extracted. The mean and the root mean square of the pressure distribution for each state are represented in figure 12. We can see the strong gradient in the mean base pressure towards one of the sides, whereas the area of maximum pressure fluctuation is located at the centre of the wake.
Case 1 (simplified lorry): pressure distribution on the body base (time-averaged and root-mean-square of the fluctuations). (a) Vertical bi-modality. (b) Horizontal bi-modality. A schematic of the toroidal vortex structure is also presented for both bi-modal directions.

4.1 Proper orthogonal decomposition
Proper orthogonal decomposition (POD) was applied separately to the base pressure distribution for the ‘top’ and ‘bottom’ wake states, in order to extract the dominant coherent structures and their energy content. The mean component of the base pressure is removed from the samples. The POD modes for these two states are shown in figure 13. Most of the energy is contained in the first three modes – these represent up to 93 % of the total energy for both states. By projecting each mode onto the instantaneous pressure field (see figure 13), we observe that the first two POD modes correspond to anti-symmetric left and right states, both containing a similar amount of energy. The third mode represents a symmetric centred state which is less energetic. These POD modes are very similar to those observed by Rigas et al. (Reference Rigas, Oxlade, Morgans and Morrison2014) for the axisymmetric body configuration.
Case 1 (simplified lorry): first three base pressure POD modes and associated energy. (a) Wake in ‘top’ state, (b) wake in ‘bottom’ state.

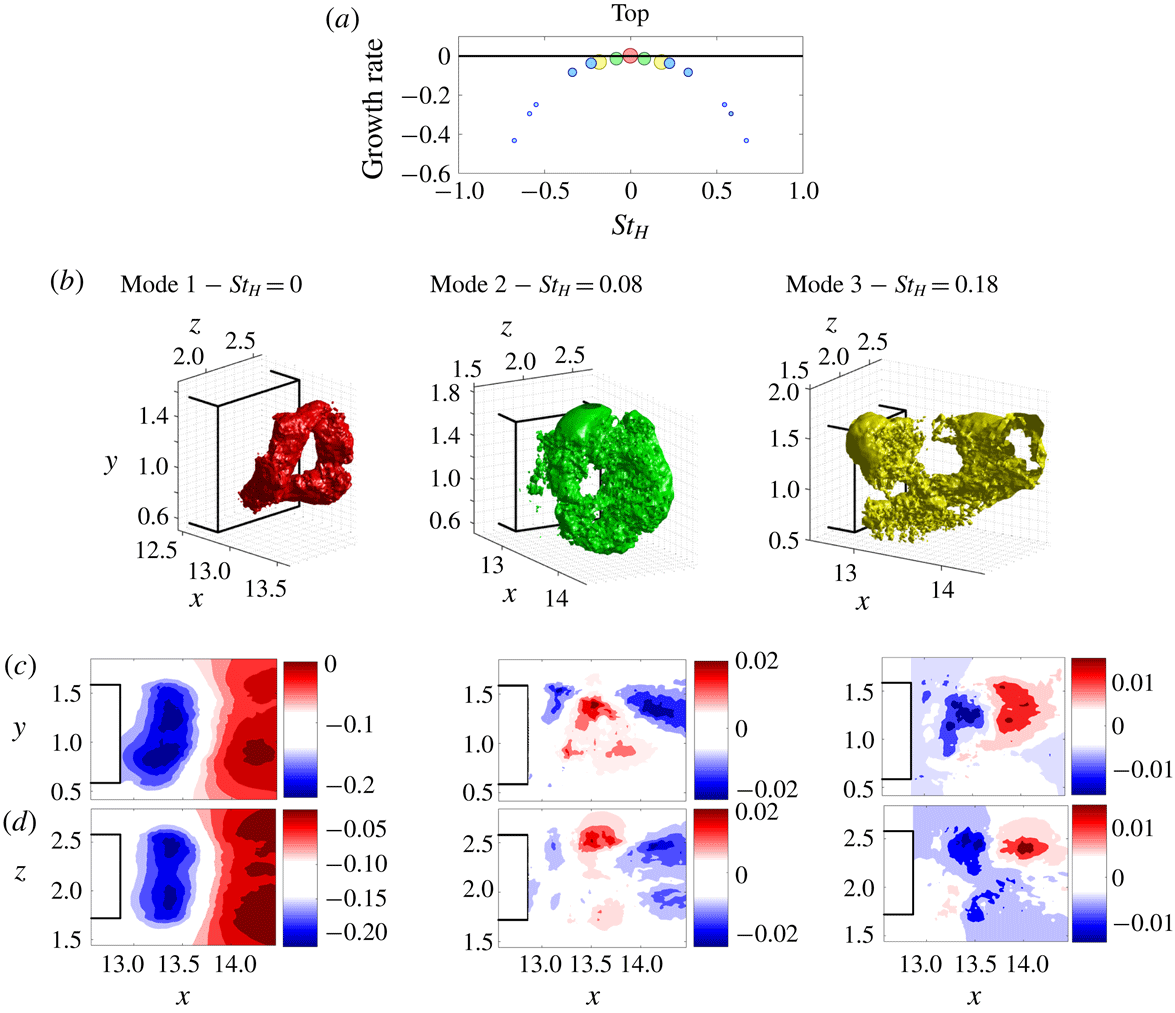
Case 1 (simplified lorry): wake in ‘top’ state. (a) Growth rate of the DMD modes in the wake; markers are sized according to the mode amplitudes. (b) The three main modes are coloured specifically and their corresponding spatial structures are plotted using the iso-contour of dominant amplitude. (c,d) For each DMD mode, its amplitude is plotted in the vertical (
 $xy$
) and horizontal (
 $xz$
) symmetry planes of the body.

Case 1 (simplified lorry): wake in ‘bottom’ state. (a) Growth rate of the DMD modes in the wake; markers are sized according to the mode amplitudes. (b) The three main modes are coloured specifically and their corresponding spatial structures are plotted using the iso-contour of dominant amplitude. (c,d) For each DMD mode, its amplitude is plotted in the vertical (
 $xy$
) and horizontal (
 $xz$
) symmetry planes of the body.

4.2 Dynamic mode decomposition
In order to analyse the three-dimensional wake structures, dynamic mode decomposition (DMD) was employed using three-dimensional pressure snapshots of the wake (Schmid Reference Schmid2010). As in the previous section, separate DMD analysis was performed for the wake in the ‘top’ and ‘bottom’ asymmetric positions. The frequencies and growth rates of the main DMD modes are shown in figures 14 and 15 for the top and bottom positions of the wake. The first mode, coloured in red, corresponds to zero frequency and is the mean mode. It is composed of a ring-shaped vortex, tilted either towards the top or bottom. The second mode, coloured in green, corresponds to the bubble pumping mode and consists of a larger toroidal structure extending further downstream. It represents the region where the toroidal vortex oscillates. The third mode, coloured in yellow, is the vortex-shedding mode. It highlights the shear layers merging together further downstream and creating a large bulk located either at the top or at the bottom of the base.
5 Conclusions
The present study has presented the first simulations of bi-modal switching in the wake behind square-back bluff bodies and provided a plausible explanation of the phenomenon triggering switches. The Reynolds numbers based on body height were
 $Re_{H}=33\,000$
for the Ahmed body configuration and
 $Re_{H}=20\,000$
for the simplified lorry, ensuring that the boundary layers at separation were fully turbulent.
The computations employed wall-resolved large eddy simulations. Due to the very long time scales associated with bi-modality, only one or two wake switches were captured in each simulation. Different simulation grids were used, and it was found that even when the mean and spectral features of the flow, including the turbulent boundary layer, were well resolved according to widely used benchmarks, the axis of the bi-modality remained grid-sensitive. This suggests either that more severe grid requirements are needed to accurately capture bi-modality, or that the level of numerical noise associated with spatial truncation varied enough to provide different excitation.
The simulations provided access to full flow-field data, allowing the wake structures associated with bi-modality to be investigated in a new level of detail. The toroidal vortex structure in the near wake was found to remain throughout bi-modality, but tilted according to the wake position. Large hairpin structures were identified as being shed from the longest part of the wake. These hairpin structures appear to be responsible for triggering bi-stable switches. Modal analysis of the asymmetric wake states provided further insight into the wake topology changes.
This work is a starting point for using simulation tools to investigate and potentially control reflectional symmetry-breaking wake modes at high Reynolds number.
Acknowledgements
The authors are grateful for the support from the Engineering and Physical Sciences Research Council, the Imperial College PhD Scholarships and Renault. The use of the Imperial College High Performance Computing facilities and ARCHER (the UK National Supercomputing service) are also acknowledged.









 Open access

