Introduction
The World Glacier Inventory (WGI), one of the activities planned for the International Hydrological Decade (1965–74), was established to obtain an accurate assessment of the amount, distribution and variation of all snow and ice masses. One of its main objectives was to better understand the role of snow and ice in the global water balance. To achieve this, the International Commission on Snow and Ice (ICSI) was asked to prepare guidelines for the compilation of a world inventory of perennial ice and snow masses. A Working Group, chaired by F. Müller, was established by ICSI to formulate standardized procedures (UNESCO/IAHS, 1970). To facilitate international participation in the WGI, a Temporary Technical Secretariat (TTS) for the World Glacier Inventory was established by UNESCO, the United Nations Environment Programme (UNEP) and the International Commission on Snow and Ice (ICSI) at the Federal Institute of Technology (ETH) in Zürich in 1973. The TTS was responsible for compiling, and archiving, data contributed by the participating national glacier-inventory groups. At the same time, the TTS organized training courses for personnel engaged in inventory work worldwide. Although WGI activities initially focused on smaller mountain glaciers and ice caps, the guidelines were written with a view to their future application to parts of Greenland and Antarctica. Further, it was planned to repeat similar inventories every half-century to record changes. To accelerate the inventory work, remote-sensing techniques and automated computer processing were adopted in the 1980s, laying the foundation for the Global Land Ice Measurements from Space (GLIMS) and GlobGlacier projects. The glaciological data obtained through the WGI are available from the World Glacier Monitoring Service (WGMS) in Zürich, Switzerland, and the National Snow and Ice Data Center (NSIDC) in Boulder, Colorado, USA.
Present Status of WGI
In the 40 years since the WGI was launched, and the 25 years since simplified inventory methods were introduced, both efforts have made good progress and contributed substantially to our knowledge of glaciology and its related sciences. Although inventory data are stored in identical formats at both the WGMS and NSIDC, access to these data differs. For the former, users must contact the WGMS to have the data forwarded electronically; data at NSIDC can be accessed directly through its website. The quantity of available data varies with time as new data are added. As of 1 September 2008, the WGI held information on about 107 000 glaciers in 28 countries; of these, 11 countries had complete inventories. Of the estimated 554.2 x10³ km2 total surface area of glaciers, the WGI covers 46%, GLIMS 34%, and 26% is covered by both projects; 54% of the glacierized area is covered by combining WGI and GLIMS data.
Although one of the data fields in the original inventory manual (Reference Müller, Caflisch and MüllerMüller and others, 1977) was mean depth, there is no column for volume or mean depth in the WGMS and NSIDC files. Some national inventories (e.g. Switzerland and China) have used their own methods for estimating volume. At some stage, possibly because of concerns over its accuracy, or lack of homogeneity in the different estimation techniques, volume was dropped from the world inventory dataset. However, for a number of critical questions (e.g. sea-level change), glacier volume is essential, so renewed efforts must be made to consider how glacier volume can be estimated with confidence.
Volume Estimation With WGI Data
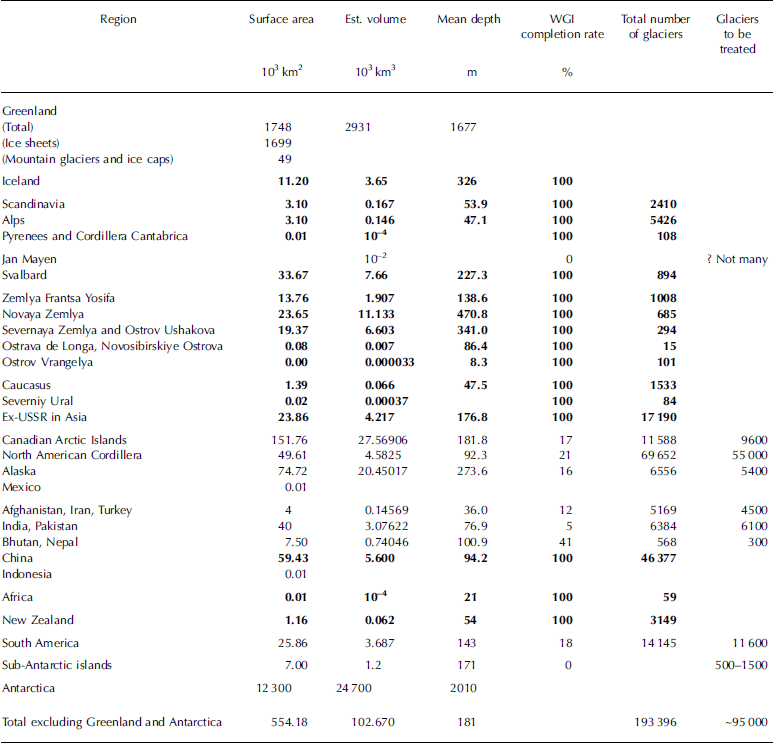
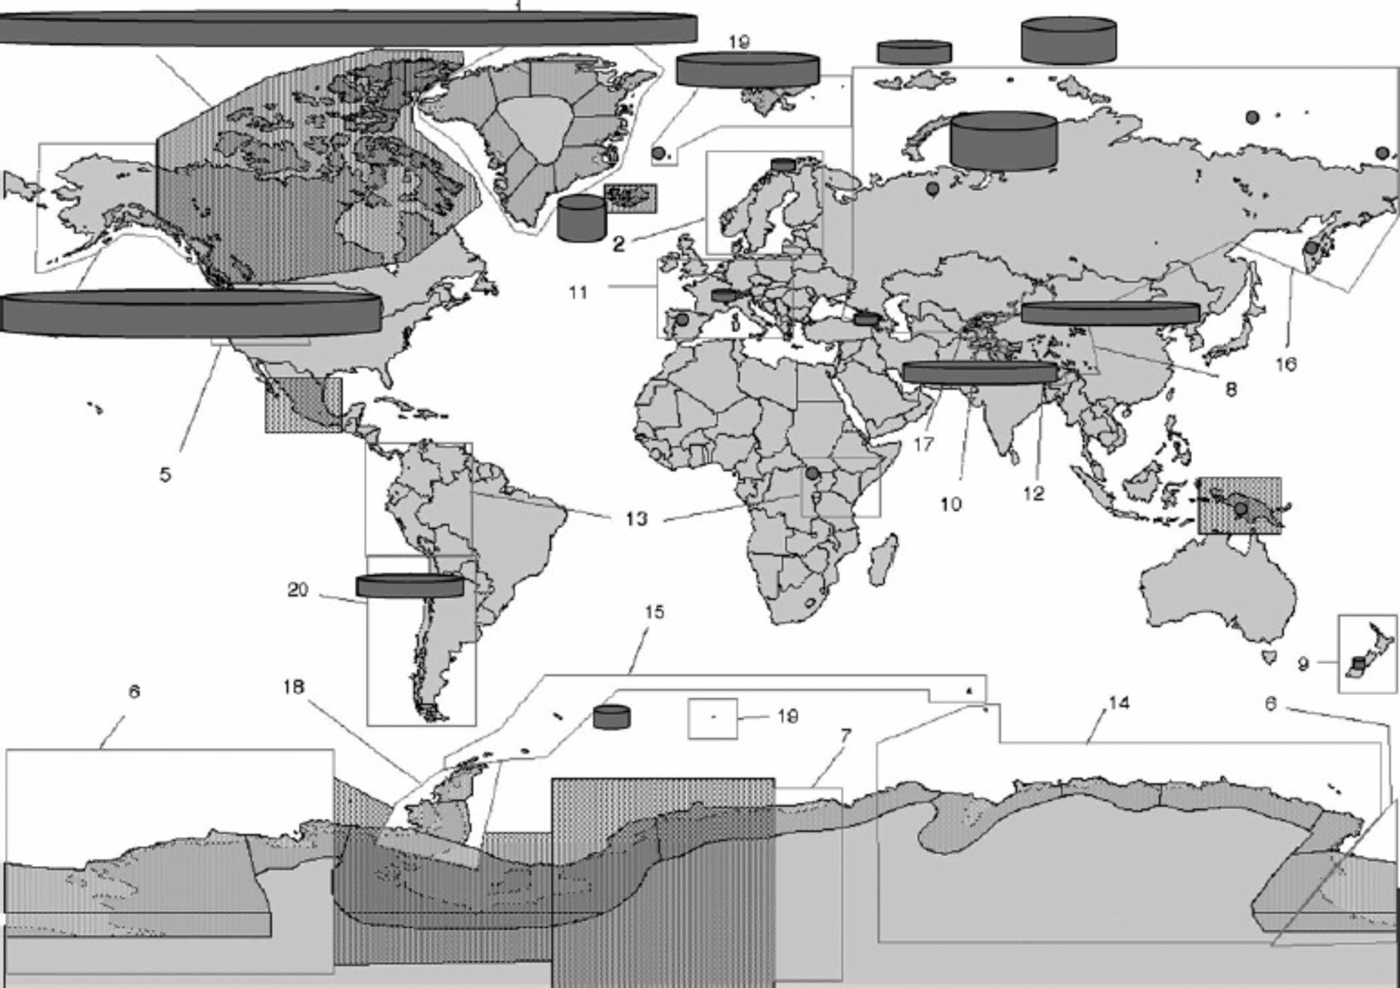
The WGI data are organized with respect to each country. However, the characteristics of the glaciers differ greatly within a country, especially when the country is large and the climatic conditions have large regional differences. Table 1 provides an overview of glacierization with respect to glacier area and volume; this is illustrated graphically in Figure 1. These summaries indicate where efforts are needed to complete the global inventory. Although volume can be estimated using the WGI glacier features (e.g. location, altitude and surface area), its accuracy is questionable.
Overview of glacier area and volume and WGI completion rate. Bold numbers are quantities from the completed national inventories. Italic numbers are completion rates (decimal)
Global distribution of glacier ice outside Greenland and Antarctica. The columns represent the total regional ice volume. The area of the column base represents the total surface area and the column height represents the mean glacier thickness. The numbers indicate the number of glaciers in each region.
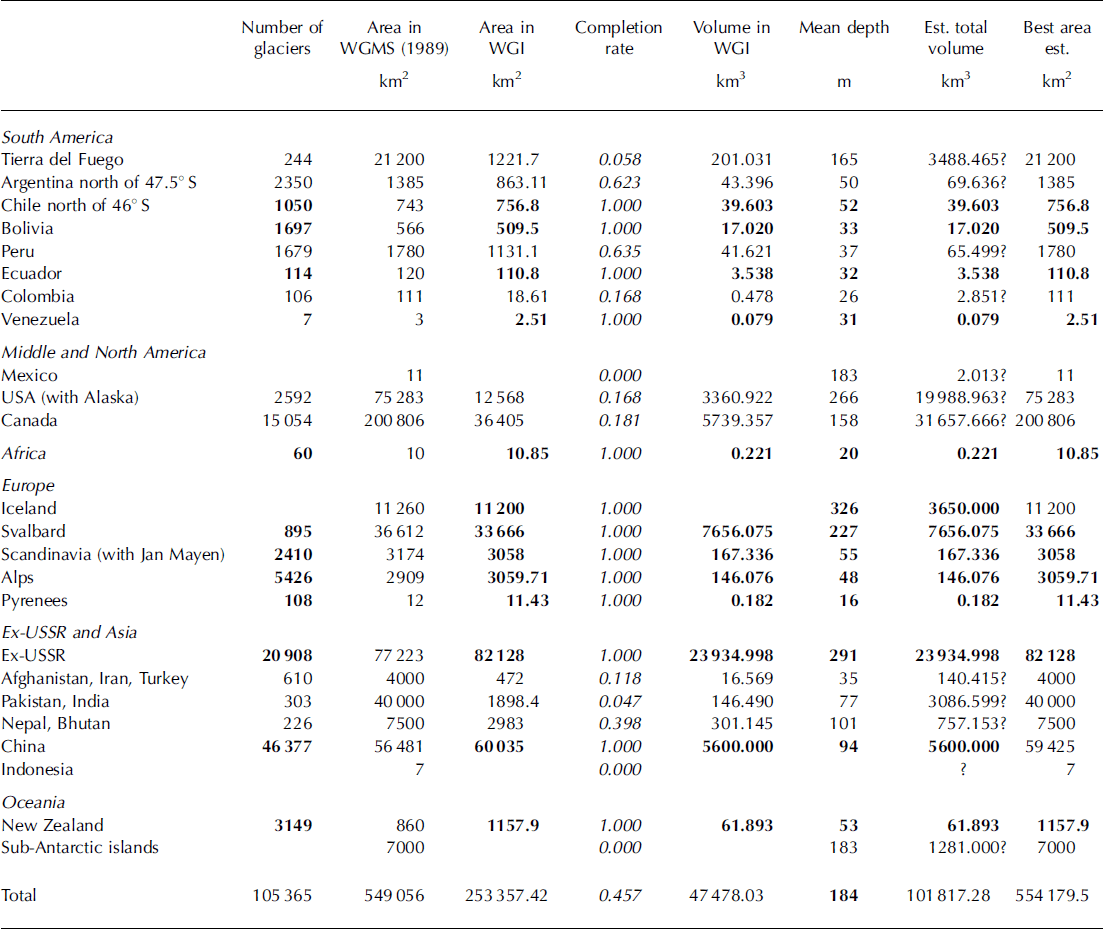
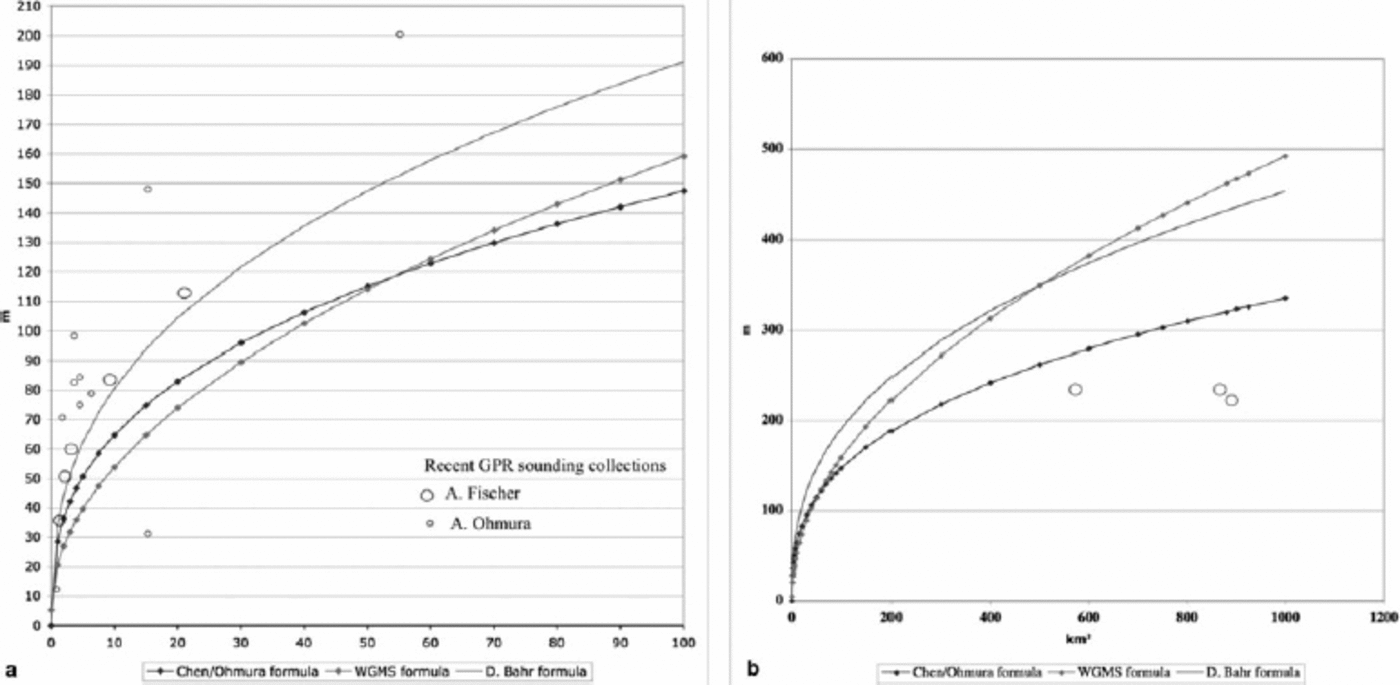
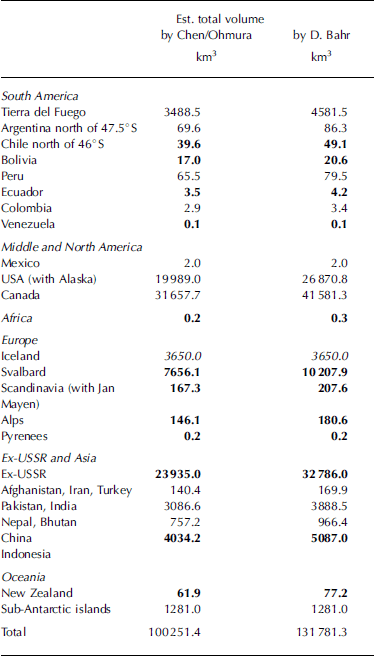
If the ultimate objective is to obtain a global ice volume, the WGI contains about the best data available. The advantage is its generally homogeneous nature and availability for computer processing. However, options for estimating volume are limited. With respect to those processes that determine the shape of the glacier, and hence its thickness and volume, some key information (e.g. mass balance, ice temperature and bottom topography) is not included in the inventory. It is also unrealistic to expect that the number of glaciers for which accurate ground surveys will be carried out will increase greatly in the near future. As a first step, we try to estimate the ice volume based solely on the information available in the WGI. The simplest approach is to exploit the relationship between mean depth and the surface area of each glacier, the latter being available for all glaciers. The mean depth, H, is defined as the ratio of the volume, V, to the surface area, S. In the present report, two different equations with different bases are used. Reference Chen and OhmuraChen and Ohmura (1990) derived a relationship between H and S using a statistical method based on data from 67 glaciers, which at that time had been well measured either by ground-penetrating radar (GPR) or seismic soundings. Reference Bahr, Meier and PeckhamBahr and others (1997) proposed a similar equation using dynamic considerations. This work was calibrated empirically with data from more recently sounded glaciers. The mathematical forms of these equations are shown inFigure 2; a similar relationship used at the WGMS is added for comparison. Figure 2a represents the range of glaciers smaller than 100 km2, while Figure 2b represents the relationship for larger glaciers up to 1000 km2. The circles show results of more recent high-resolution GPR soundings, but data from these glaciers were not used for deriving the present equations. The general trend is that for most small to medium glaciers the Bahr equation has a closer affinity to the recent soundings, while for larger glaciers the Chen/Ohmura equation has a better fit. Table 2 presents an estimate of volume for each region and the world. The total volume values for the regions are multiplied by the ratio of the total glacier area of the region to the sum of the surface areas of the inventoried glaciers, in an effort to simulate the volume for an entire region. This estimation can be justified only when the inventoried region represents the entire region concerned. The difference between the two equations is about 30%. To close the difference, one might use another influential variable (e.g. the mean surface gradient). To improve these equations it will be necessary to prioritize the glaciers by size, i.e. by those that are most influential on the total ice volume. For example, the Chinese Glacier Inventory shows that priority should be given to glaciers 1–30 km2 in area. Glaciers falling within this relatively narrow band contribute about 50% of the total ice volume, although only 25% of the glaciers belong in this range. This result also shows how important it is to establish the mean depth/surface-area ratio for glaciers with areas around 30 km2. At present the global glacier ice volume outside Greenland and Antarctica is estimated at 100–130x103 km3, corresponding to 25–32cm sea-level equivalent.
Relationships between glacier surface area and ice volume, for glaciers <100km2 (a) and >100 km2 (b). Curves represent the relationships as proposed by Reference Chen and OhmuraChen and Ohmura (1990) (dark, dotted), D. Bahr (personal communication, 2008) (light, no dots) and WGMS (1989) (light, dotted). Circles represent recent radio-echo sounding results compiled by A. Fischer (large circles) and A. Ohmura (small circles).
Comparison of volume estimations by two equations. Numbers in bold are volumes for regions with a completed inventory, the other numbers are for regions with partial inventories, while the line for Iceland has values computed by the Icelandic inventory team
Other Applications
The large number of glaciers registered in the WGI makes it possible to investigate statistical features of glaciers by region or hydrological basin. This is especially useful for estimating discharge from a glacierized basin and can be computed for individual glaciers. It is also possible to construct a generic glacier representative of a relatively large region (e.g. a drainage basin or a mountain range).Reference Shi, Liu, Ye, Liu and WangMüller and others (1976) constructed such a hypothetical glacier using an altitude vs area relationship. Reference Shi, Liu, Ye, Liu and WangShi and others (2008) also took a drainage basin, but expressed the glacier characteristics by number frequency, surface area and volume as a function of surface-area classes that are defined as an integer to the power of 2. The occurrence frequency distribution Shi and others scaled is extremely interesting, as multiplication of the frequency by S –α immediately gives a representation of the area and volume distribution, where α is a constant. α = 1 provides the area distribution, and α = 1.375 the volume distribution, after Bahr’s equation.
Conclusion and Recommendation
The most important task of the WGI is to complete the project at the global scale as soon as possible. The estimated number of glaciers still to be measured for each region is presented in Table 3. Progress on the inventory for the following regions is urgently needed: the Canadian Cordillera (~54 000 glaciers to be inventoried), followed by South America (11 600), the Canadian Arctic (9600), India and Pakistan (6100) and Alaska (5300). These regions should be given an especially high priority. The total number of uncatalogued glaciers in these five regions accounts for 90% of the glaciers still to be inventoried. After completion of inventories in these regions, the WGI would have information on >95% of the world’s glaciers. The inventory should be extended to Greenland and Antarctica. In fact such an inventory has already been done for Greenland and it only remains to incorporate these data into the existing WGI.There is also a partial inventory for some parts of Antarctica; future work here should concentrate initially on valley glaciers and the small ice caps. Consideration will need to be given to how the major ice streams and ice shelves can best be delineated and measured. Satellite remote sensing will be the key to completion of a comprehensive inventory and there may be some other components that can be adopted in future inventories. During the last half-century there has been a tremendous advance in glaciological knowledge and the supporting technology. Previously abandoned key components (e.g. the equilibrium-line altitude (ELA) and ice volume) may now be readopted with much higher confidence. In view of the rapid changes taking place in the cryosphere, the 50 years originally conceived as an appropriate re-inventory interval needs to be reconsidered. The rapid adoption of satellite-based techniques should allow for the much more frequent inventories that are now desired.
Estimation of the glaciers remaining to be inventoried. Bold indicates completed inventories