Introduction
Homalodisca vitripennis (Germar) (=H. coagulata (Say)) (Takiya et al., Reference Takiya, McKamey and Cavichioli2006), also known as the glassy-winged sharpshooter, was introduced into southern California in the late 1980s (or possibly earlier) from its native range in the southeastern USA. This insect is an important vector of the xylem-limited bacteria, Xylella fastidiosa Wells et al., which causes diseases on several crops and ornamentals, including Pierce's disease of grapes, phony peach disease, almond leaf scorch, alfalfa dwarf and oleander leaf scorch (Blua et al., Reference Blua, Phillips and Redak1999; UCOP, 2000; Varela et al., Reference Varela, Smith and Phillips2001). The closely related H. liturata Ball (=H. lacerta (Fowler)) (Burks & Redak, Reference Burks and Redak2003), commonly known as the smoke-tree sharpshooter, is native to California and is also a vector of Pierce's disease and oleander leaf scorch (Freitag et al., Reference Freitag, Frazier and Flock1952; Purcell et al., Reference Purcell, Saunders, Hendson, Grebus and Henry1999). Eggs of Homalodisca are laid just below the epidermis of leaves as a cluster of eggs oriented nearly parallel to one another.
The egg stage of leafhoppers is the stage of development most vulnerable to attack by natural enemies (Chandra, Reference Chandra1980; Waloff & Jervis, Reference Waloff and Jervis1987). Confirmed egg parasitoids exclusively attacking Homalodisca species in North America include Gonatocerus spp. (Hymenoptera: Mymaridae), Ufens spp. and Burksiella spirita (Girault) (latter two genera, Hymenoptera: Trichogrammatidae) (Turner & Pollard, Reference Turner and Pollard1959; Huber, Reference Huber1988; Triapitsyn et al., Reference Triapitsyn, Mizell, Bossart and Carlton1998; Triapitsyn, Reference Triapitsyn2003; Pinto, Reference Pinto2006). Other egg parasitoids that may opportunistically attack Homalodisca eggs in the Nearctic include Paracentrobia spp. (Hymenoptera: Trichogrammatidae), Oligosita spp. (Hymenoptera: Trichogrammatidae) and Anagrus spp. (Hymenoptera: Mymaridae) (Hoddle & Triapitsyn, Reference Hoddle, Triapitsyn, Tariq, Oswalt, Blincoe, Ba, Lorick and Esser2004; Tipping et al., Reference Tipping, Triapitsyn and Mizell2005; Krugner et al., Reference Krugner, Johnson, Russell and Morse2008). In addition, Grandgirard et al. (Reference Grandgirard, Hoddle, Triapitsyn, Petiti, Roderick and Davies2007) reported that in Tahiti (French Polynesia), egg masses of H. vitripennis (which was recently introduced there) were parasitized by Centrodora sp. (Hymenoptera: Aphelinidae) as well as by Palaeoneura sp. and Anagrus sp. (both Hymenoptera: Mymaridae).
Observations of Ufens species from southern California were made by a number of workers (Powers, Reference Powers1973; Pinto et al., Reference Pinto, Frommer and Manweiler1987; Al-Wahaibi & Morse, Reference Al-Wahaibi, Morse and Hoddle2000; Morgan et al., Reference Morgan, Triapitsyn, Redak, Bezark, Hoddle and Hoddle2000; Al-Wahaibi, Reference Al-Wahaibi2004; Al-Wahaibi et al., Reference AI-Wahaibi, Owen and Morse2005). Al-Wahaibi (Reference Al-Wahaibi2004) suggested that egg masses of Homalodisca on plants native to southern California (e.g. jojoba) were predominantly parasitized by two Ufens species. These Ufens parasitoids were also shown to be responsible for a large proportion of Homalodisca egg parasitism on cultivated plants such as citrus in the city of Riverside, California during late summer and autumn (Al-Wahaibi, Reference Al-Wahaibi2004). Al-Wahaibi et al. (Reference AI-Wahaibi, Owen and Morse2005) described, illustrated and indicated the geographical distributions of these Ufens spp. as two new species: Ufens principalis Owen and U. ceratus Owen. The searching, oviposition, emergence, mating and male competition behaviours of U. principalis were detailed by Al-Wahaibi et al. (Reference AI-Wahaibi, Owen and Morse2005). The same authors described the emergence, mating and male competition behaviours of U. ceratus. Of the two Ufens species, U. principalis is the more abundant and more commonly collected species in the city of Riverside (Al-Wahaibi, Reference Al-Wahaibi2004). Owen (Reference Owen2005) provided collection data indicating that in southern California, a third species of Ufens, U. simplipenis Owen, parasitizes eggs of H. liturata in the Coachella Valley, Riverside County. This species seems to be confined to some parts of the low desert of southern California, as it was not collected by Al-Wahaibi (Reference Al-Wahaibi2004) despite extensive surveys in the city of Riverside and in a jojoba field in Desert Center in eastern Riverside County.
Recently, there has been interest in introducing exotic Ufens species into California as part of a classical biological control effort against the glassy-winged sharpshooter involving a number of parasitoid species, most in the genus Gonatocerus (Triapitsyn & Hoddle, Reference Triapitsyn, Hoddle, Tariq, Oswalt and Esser2001, Reference Triapitsyn, Hoddle, Tariq, Oswalt, Blincoe and Esser2002; Triapitsyn et al., Reference Triapitsyn, Bezark and Morgan2002). Difficulties in rearing the introduced Ufens species in quarantine led to the formulation of the hypothesis that this species could be a hyperparasitoid attacking Gonatocerus species (primary parasitoids) inside Homalodisca eggs (Triapitsyn, Reference Triapitsyn2003). Data from Al-Wahaibi et al. (Reference AI-Wahaibi, Owen and Morse2005) clearly demonstrated that U. principalis (and likely U. ceratus) is a primary parasitoid of eggs of Homalodisca spp. and that the difficulty in rearing the species in quarantine was due to egg masses being attractive to ovipositing females for only several hours after they are laid.
Although the biology of the genus Trichogramma is known to a great extent, knowledge of the biology of other genera within the Trichogrammatidae is limited (Nagarkatti & Nagaraja, Reference Nagarkatti and Nagaraja1977; Owen, Reference Owen2005; Pinto, Reference Pinto2006). Despite the important ecological role Ufens species play in the regulation of populations of Homalodisca species, little is known about their ecology. This study was aimed at elucidating aspects of the biology of U. principalis not covered by Al-Wahaibi et al. (Reference AI-Wahaibi, Owen and Morse2005). In this paper, we investigated immature development and adult eclosion of U. principalis using laboratory experiments and observations based on field-collected host egg masses. Such knowledge will help expand our understanding of the biology of Trichogrammatidae, in particular, and of egg parasitoids in general.
Materials and methods
Source of insects
Homalodisca egg masses parasitized by Ufens principalis were obtained from jojoba plants in Field 7E, Agricultural Operations, University of California, Riverside, CA, for use in experiments and observations detailed below.
Stages of immature development
In early October 2003, four field-laid egg masses of H. vitripennis were collected. Each egg mass was observed to have an aggregation of ovipositing U. principalis females on them. These egg masses were about 30–60 min old when collected (we observed female H. vitripennis producing the egg mass and collected each without parasitoids 30–60 min after sharpshooter oviposition began). The collected egg masses were immediately placed in Petri dishes (100 mm diameter) containing moistened tissue paper. The Petri dishes were then incubated inside a Percival growth chamber (Percival Scientific, Inc., Perry, IA) at 26.7°C (temperature measured using a HOBO data logger; Onset Computer Co., Bourne, MA), 50–60% RH and 14:10 L:D. The development of immature U. principalis within the host eggs was checked 1, 2, 3, 5, 8, 12 and 16 days after initial parasitism. To aid in clearly observing developmental changes, the leaf epidermis covering each egg mass was removed using a pair of forceps while viewing the egg mass under a dissecting microscope, and the stages of immature development were observed. Two of the egg masses served as sources of U. principalis immature stages. These were carefully dissected out of host eggs using forceps and were preserved in 80% ethanol. Morphological features of immature U. principalis at the above ages were noted from live specimens and/or from photographs taken with a Nikon Cool Pix 990 digital camera (Nikon USA, Melville, NY).
Effect of temperature on immature development
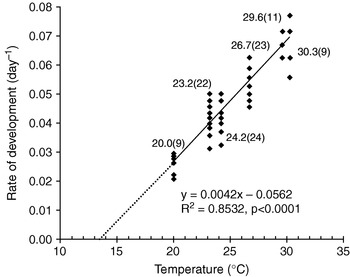
Egg masses of Homalodisca with aggregates of ovipositing U. principalis females were collected during the summers of 2002 and 2003. These freshly-parasitized egg masses were taken to the lab and immediately incubated in Petri dishes (100 mm) containing moistened tissue paper placed inside Percival growth chambers at the following temperatures (egg mass replicates in parentheses): 20 (9), 23.2 (22), 24.2 (24), 26.7 (23), 29.6 (11) and 30.3°C (9) (actual temperatures measured using HOBO data loggers). The relative humidity and light regime for the six temperature treatments was 50–60% RH and 14:10 L:D. Egg masses were checked daily and the general features of development of undisturbed and intact egg masses were noted. The number of days from the start of incubation until the first U. principalis adults emerged from each egg mass was recorded. This duration of immature development was converted into a developmental rate (duration−1), which was plotted against the corresponding temperature treatment. Linear regression analysis was conducted to arrive at the theoretical minimal threshold of immature development and degree-days required for development from egg to adult.
Temporal distribution of adult emergence
Field Ufens-parasitized egg masses (distinguished from unparasitized egg masses by their different colouration) were collected during late August and early September 2003. These parasitized egg masses were incubated in a Percival growth chamber at 26.7°C, 50–60% RH and 12:12 L:D (lights on at 0600 h, off at 1800 h). Each egg mass was placed in a 50×9 mm diameter, tightly-closing Petri dish without within-dish moisture. Four cohorts of egg masses were monitored for emergence. Each cohort had egg masses with Ufens adults initially emerging on the same day (the four cohorts of Ufens adults initially emerged on September 1, 4, 8 and 11, 2003) and each consisted of 7–11 egg masses. No egg mass had mixed emergence of U. principalis and U. ceratus. Because U. ceratus adults emerged from only three egg masses which were excluded (out of a total of 35), the following methods apply to egg masses from which only U. principalis emerged (32 egg masses), and data presented below pertain only to this latter species.
Each cohort of egg masses was checked on the first three days after initial emergence at three times during each day: 0600, 1200 and 1800 h. This resulted in three possible ‘day-periods’ of emergence: night (emergence between 1800 and 0600 h), morning (emergence between 0600 and 1200 h) and afternoon (emergence between 1200 and 1800 h). Each cohort of egg masses was then assessed for emergence on the afternoon of the seventh day after initial emergence, yielding the sum of adults emerging on the fourth to seventh days post initial emergence. At the end of the monitoring period (afternoon of the seventh day), the number of dead and unemerged individuals within each egg mass, and the number of eggs per egg mass were determined for all four egg mass cohorts. ANOVA was used to compare the proportion of emerged adults among the four emergence day categories (days 1, 2, 3 and 4–7). After a plot of residuals confirmed data were normal, Tukey-Kramer HSD was used to separate means. Additionally, for the September 8 and 11 cohorts, counts of emerged adults were done separately for females and males for each of the three daily periods on the first three days of emergence. Because the two Ufens species are gregarious (as immatures) per host egg (Al-Wahaibi, Reference Al-Wahaibi2004), we wanted to assess to what degree adult U. principalis shared exit holes. Therefore, the total number of exit holes per egg mass was assessed at the end of the monitoring period (afternoon of the seventh day) for two cohorts (September 8 and 11 cohorts). Then, the ratio of the number of exit holes to the number of emerged adults was tested for a difference from unity using a two-tailed t-test.
We also wished to test for the effects of emergence day (data from only days 1–3 were included due to the low emergence on days 4–7 combined), day-period (morning, afternoon or night) and sex of emerged adults on emergence. Based on a plot of the residuals, data were not normally distributed; and, thus, a logistic regression model was used (Hosmer & Lemeshow, Reference Hosmer and Lemeshow2000). Data were converted to a binary response, i.e. emergence of a wasp was coded as a 1 and non-emergence as a 0. The estimated proportion of emergence was then calculated under each of 18 possibilities (three possible emergence days×two sexes×three day-periods) and a Wald Chi-square test was used to test for the effect of each factor, all interactions and appropriate contrast pairs. Egg mass cohorts from September 8 and 11 were used for this analysis.
Effect of degree of immature gregariousness on U. principalis adult size
For this assessment, width of the exit hole (made by adult U. principalis as they emerged from host eggs) was used as a proxy for head width (U. principalis adult cuts a hole large enough to barely allow the head to protrude out of the leaf surface), which in itself is a good predictor of adult size for many parasitic Hymenoptera (Jervis & Copland, Reference Jervis, Copland, Jervis and Kidd1996). The number of U. principalis individuals successfully developing within a host egg was approximated by the number of exit holes per host egg. This was based on two assumptions: (i) a majority of individuals successfully emerged from eggs of Homalodisca and (ii) the ratio of the number of emerged adults to exit holes was close to unity.
Ufens-parasitized egg masses were collected from jojoba during September 2003 and then incubated as detailed above. Adult U. principalis were allowed to emerge for at least a week before assessment. A sample of 20 egg masses with extensive emergence (i.e. riddled with exit holes) was randomly selected for assessment. Each egg mass was viewed through a dissecting microscope equipped with an ocular micrometer. Each egg within an egg mass was examined for the number of exit holes made by emerging adult U. principalis and the size of each exit hole. Size of an exit hole was defined as the maximum width (or diameter) across the usually round hole. Measurements were done at 42X. Ocular micrometer units were converted to actual measurements in μm units by calibration to a stage micrometer (ruler divided into mm units). Mean width of exit holes in each egg of the 20 egg masses was calculated. Linear and curvilinear regression analysis (based on a power function) was conducted for data pooled from all 20 egg masses with the mean width of exit holes per egg used as the dependent variable (y) and the number of exit holes per egg as the independent variable (x).
Results
Stages of immature development
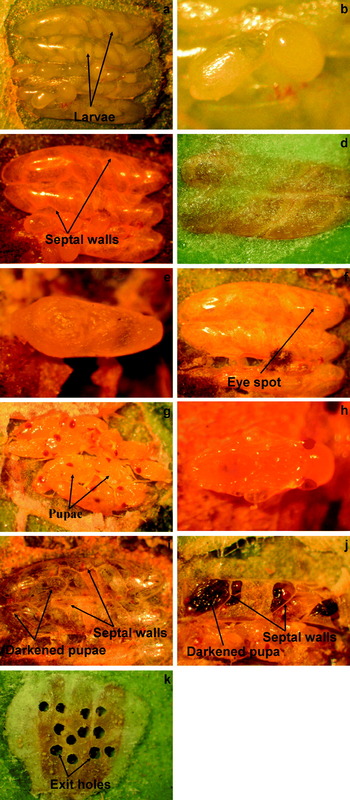
From the first to the third day after incubation at 26.7°C, white, round, sacciform larvae of U. principalis could be seen packing the length of each host egg (fig. 1a, b). The larvae were tightly in contact with each other. No structures could be discerned on the smooth, rounded bodies of the larvae. At this stage, the larvae displayed slow peristaltic movement (akin to those made by a caterpillar in motion). On the fifth day, the larvae reached their maximum size, and septal walls could be seen clearly separating one larva from another within an egg (fig. 1c). Around the fifth day, the shell of the host egg started to attain a characteristically yellow-orange tint (fig. 1d) and was rendered hard and brittle with the feel of the shell of a bird egg when probed with a pair of forceps. Larvae at this stage failed to show any signs of activity or movement. However, multiple yellow, dot-like objects were observed scattered throughout the body of the larvae (fig. 1e). On the eighth day of incubation, faint eye-spots indicative of the early pupal stage could be discerned through the chorion of the host egg (fig. 1f). The head region of these early pupae was not completely distinct (as discerned by dissection of a few pupae). On the twelfth day, the pupae were white-yellow with the head region, thorax and abdomen clearly defined (fig. 1g, h). The compound and simple eyes were red and fully formed. The wings could be discerned as a triangular region on the dorsal side of the thorax. The legs were still fused to each other and the remainder of the body. On the sixteenth day of incubation, the body of the pupa was generally dark brown to black and the legs were not fused to the rest of the body (fig. 1i, j). The thorax, which was generally yellow-orange, had two characteristic parallel dark lines (diverging slightly anteriorally and converging posteriorally) on the dorsum running from the anterior margin of the prothorax to about the center of the thorax. The wings were folded, but had the veins and setae clearly formed. Some adult-like, fully-developed individuals were observed to be active inside the host eggs prior to emergence and readily crawled out of dissected eggs. On the eighteenth day, adults started to emerge, producing multiple exit holes per host egg (fig. 1k).
a–k. Images showing immature stages of U. principalis at 26.7°C and exit holes produced by emerged adults: (a) numerous engorged larvae two days after parasitism, note the tight packing of larvae; (b) larva dissected out three days after parasitism; (c) change in colour and structure of parasitized eggs and appearance of septal walls separating larvae, five days after parasitism; (d) yellowish-orange colour typical of U. principalis parasitized eggs, seven days after parasitism; (e) mature larva, note the yellowish dot-like particles inside the body, 5–7 days after parasitism; (f) early pupal stage, note the faint reddish eye spots, eight days after parasitism; (g) group of early stage pupae dissected out of host egg, 12 days after parasitism; (h) close-up of early stage pupa, note yellow-white colour, 12 days after parasitism; (i) darkened late stage pupae (dark brown to black) showing through host chorion, 16 days after parasitism; (j) close-up showing a mixture of darkened and unmelanized pupae with septal walls distinctly separating pupae from one another, 17 days after parasitism; (k) exit holes produced by emerged adults (four holes per egg), 18 days after parasitism.

Effect of temperature on immature development
Across the range of temperatures tested, the development of immature U. principalis showed a strong positive, linear relationship with temperature as determined by regression analysis (r2=0.853, P<0.0001, n=98) (fig. 2). From the linear regression, the minimum theoretical threshold for development was 13.54°C while the heat units required for development was 240.96 degree-days above this threshold. Egg masses that were whitish-cream at the beginning of incubation attained a yellowish-orange colour a few days after the start of incubation and remained that colour until close to emergence of adults, when dark patches could be seen within the generally yellow-orange eggs.
Relationship between temperature and rate of development from egg to adult for U. principalis. All temperatures tested were used to produce a linear regression between the two variables. The regression significance value (P), degree of fit (R2) and regression equation are shown inside the figure. The solid line is the regression line fitting the points, while the dashed line is the extrapolation of the regression line to the minimum threshold of development at which the rate of development equals zero. Each point represents a single egg mass. The temperature of each treatment is shown above the band of points followed by the number of egg masses in brackets.

Temporal distribution of adult emergence
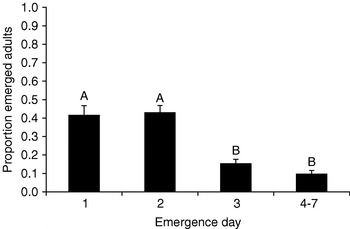
Most adult U. principalis emerged during the first and second days (fig. 3). The number of adults emerging during the first and second days were not significantly different from one another; and, on both of these days, significantly more adults emerged than on the third day and days 4–7 combined. Emergence levels during the third day and days 4–7 combined were not significantly different from each other (fig. 3).
The distribution of emergence (mean proportion emerged) of U. principalis adults on the first three days and on days 4–7 combined, after initial emergence from field-parasitized egg masses. ANOVA was performed to compare the proportion of emerged adults among the four emergence day categories. Upper-case letters above columns indicate Tukey-Kramer HSD mean separations (P<0.0001). Means for columns with the same letter are not significantly different. Standard errors of the mean are presented as error bars at the top of columns. The number of egg masses used for emergence day category observations was 32.

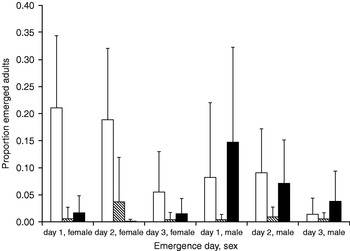
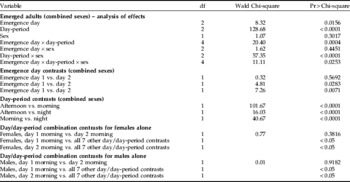
The logistic regression model used to test for the effect of emergence day, day-period and sex on Ufens principalis emergence produced the analysis shown in table 1. Both emergence day (n=17 egg masses, 469 emerged adults in total) and day-period were significant as main effects as were all interactions except emergence day×sex. Sex was not significant as a main effect. More adults (for both sexes combined) emerged on days 1 and 2 than on day 3 (table 1). More adults emerged in the morning than in the afternoon and more in the afternoon than at night. Of the 469 adults that emerged, 267 were females and a similar and higher number of females emerged during the morning of day 1 and the morning of day 2 in contrast to all other day and day-period combinations (table 1, fig. 4). Of the 202 males that emerged, more emerged during the night of the first day and during the morning of the second day.
The distribution of emergence (mean proportion emerged) of U. principalis adults as affected by emergence day, day-period and sex. Columns represent means for observations combining the three effects and are based on 17 egg masses parasitized by U. principalis. Emergence days are days relative to initial emergence. Standard deviations are presented as error bars at the top of columns. See text for further details (□, morning;  , afternoon; ▪, night).

Probabilities associated with main effects and interactions produced from a logistic regression model involving the effect of emergence day, day-period and sex on the emergence of adult Ufens principalis.

The proportion of adults that managed to successfully emerge (calculated by dividing those that emerged by the sum of emerged plus dead parasitoids inside host eggs) was 0.884±0.015 (SD) (n=32 egg masses). The number of adults emerging from each host egg averaged 5.52±0.35 (n=32). The ratio of the number of successfully emerged adults to the number of exit holes was 1.18. This ratio was significantly different from unity as shown by a two-tailed t-test (P=0.0008, n=16). This indicates that at least some individuals emerged through the same exit holes.
Effect of degree of immature gregariousness on adult size
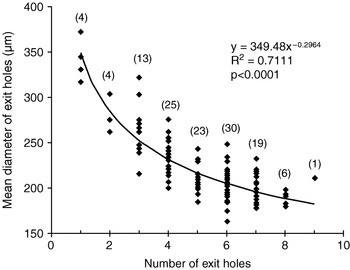
There was a strong negative correlation between the mean diameter of U. principalis exit holes and the number of exit holes per host egg (r=–0.7978, P<0.0001, n=125). When the fit of data using linear regression was compared to that using a power function, the power function fit the data better. Figure 5 shows a plot of the mean diameter of exit holes per egg vs. the number of exit holes per egg and indicates the power function regression fit. There was an average of 5.1±0.2 exit holes per host egg, and the pooled mean exit hole diameter was 223.2±3.3 μm (n=125).
Relationship between mean diameter of exit holes and number of exit holes in U. principalis parasitized eggs. The diameter of exit holes was used as a proxy for head width (which in turn is a good index of adult size), and the number of exit holes was used as an estimate of gregariousness (number of individuals developing) per host egg. Curvilinear regression based on a power function was used to relate the two variables. The regression significance (P), degree of fit (R2) and regression equation are shown inside the figure. Each point represents the first adult eclosed from an egg mass. The number of eggs used as replicates to calculate the mean diameter of exit holes for each level of exit holes is shown above each of the levels.

Discussion
Stages of immature development
A characteristic feature of immature development in U. principalis (and also U. ceratus; AKA, personal observation) is the formation of cells separating late stage larvae and pupae from one another. These cells appeared as whitish walls (septa), usually stretching from one side of the host egg to the other. These cell walls usually extended at an oblique angle across a host egg if only a few (2–4) individuals developed per egg, but occurred as circular or semicircular walls in the center or one side of the host egg when large aggregates (4–13) of Ufens occupied the host egg (AKA, personal observation). Bakkendorf (Reference Bakkendorf1934) described and illustrated a similar phenomenon in Chaetostricha pulchra Kryger. He stated that, when two individual, fully-grown larvae of this parasitoid share a single egg of Cicadella viridis (L.), ‘the host-egg seems to be divided in two parts, separated by an oblique circular line’. Ceresa-Gastaldo & Chiappini (Reference Ceresa-Gastaldo and Chiappini1994) reported what they termed ‘cocoons’ made by late instar larvae of Oligosita krygeri Girault inside eggs of C. viridis. According to Ceresa-Gastaldo & Chiappini (Reference Ceresa-Gastaldo and Chiappini1994), cocoons of O. krygeri serve as protection from moldy and collapsing leaf tissue over the winter, and such cocoons gave larvae of this species greater overwintering vitality compared with other egg parasitoids of C. viridis. Ceresa-Gastaldo & Chiappini (Reference Ceresa-Gastaldo and Chiappini1994) claimed that septa form by the meeting of adjacent walls of cocoons of O. krygeri inside host eggs. These cocoons formed due to some secretion by the mature larvae of this parasitoid. Although no cocoons were observed during the investigation of immature development of U. principalis, it is possible that cell or septal walls observed in eggs parasitized by this species could possibly be part of the joining of adjacent ‘cocoons’. However, mature larvae and pupae of U. principalis can be dissected intact without any apparent attachment of these stages to the cell walls. It is possible that the larva or pupa within the ‘cocoon’ detaches from the wall after the wall is formed. In any case, there is no direct evidence of a cocoon in U. principalis. In Metaphycus species (Hymenoptera: Encyrtidae) attacking soft scales (Hemiptera: Coccidae), septal walls appeared once larvae have grown considerably in size and have begun to touch each other (Bartlett & Ball, Reference Bartlett and Ball1964; Kapranas, Reference Kapranas2002). The formation of septal walls in Metaphycus species may serve to prevent cannibalism among developing larvae (Kapranas, Reference Kapranas2002) or to protect scale resources from use by adjacent larvae. It is possible that in Ufens species, walls start appearing early in the larval stage but become more distinct as the larvae mature. As in Metaphycus species, walls formed by larvae of Ufens species could act as structures allowing partitioning of host egg resources but also could act as pupation chambers that ultimately organize the emergence of adults from generally separate exit holes, or perhaps these walls serve both functions.
Ufens principalis larvae were generally sacciform in shape without segmentation and it was difficult, without more detailed observation, to distinguish instars, except to state that there was a shiny and relatively transparent early-stage larva with some mobility, and there was a later-stage larva that was sessile, yellowish and opaque. The shape of the larvae of U. principalis is similar to that of many other trichogrammatids described in the literature (Bakkendorf, Reference Bakkendorf1934; Taylor, Reference Taylor1937; Vungsilabutr, Reference Vungsilabutr1978; Hutchison et al., Reference Hutchison, Moratorio and Martin1990; Jesu & Laudonia, Reference Jesu and Laudonia1997; Takada et al., Reference Takada, Kawamura and Tanaka2000; Wu et al., Reference Wu, Cohen and Nordlund2000). The shape of the majority of the described larvae of Trichogrammatidae contrast with a few other trichogrammatids with extraordinarily-shaped larvae, such as Poropoea species (Clausen, Reference Clausen1940) and Ophioneurus signatus Ratzeburg (Bakkendorf, Reference Bakkendorf1934).
No distinct structures were apparent on the U. principalis larvae. This is in contrast to the observation of structures such as mouthparts and mandibles in other trichogrammatids (Bakkendorf, Reference Bakkendorf1934; Taylor, Reference Taylor1937; Vungsilabutr, Reference Vungsilabutr1978; Hutchison et al., Reference Hutchison, Moratorio and Martin1990; Jesu & Laudonia, Reference Jesu and Laudonia1997; Takada et al., Reference Takada, Kawamura and Tanaka2000; Wu et al., Reference Wu, Cohen and Nordlund2000). Bakkendorf (Reference Bakkendorf1934) observed the tiny, pale-coloured mandibles of C. pulchra only with great difficulty. Mouthparts and mandibles of U. principalis could be too small to be easily detected without high magnification and/or special preparation and staining. Such small or possibly absent mandibles in larvae of U. principalis could be an adaptation to resource utilization based on scramble rather than contest competition. Scramble competition is associated with division of host egg resource into a number of partitions that depend on the number of competing larvae (Waage, Reference Waage, Waage and Greathead1986). This division of host egg resource could in turn have resulted in the formation of the septal or cell walls separating larvae and pupae from one another (see above).
Effect of temperature on immature development
The egg stage of U. principalis is extremely short, lasting less than a day at all tested temperatures. This is inferred from the observation that one day after parasitism, early stage larvae could be seen within host eggs. This is similar to what was observed in other trichogrammatids, such as Trichogramma brassicae Bezdenko, where first stage larvae initially appeared 25–26 h post oviposition in host eggs (Wu et al., Reference Wu, Cohen and Nordlund2000). In Paracentobia andoi (Ishii), the egg incubation period lasted 14–20 h (Vungsilabutr, Reference Vungsilabutr1978). The immature development period of U. principalis was about equally divided between larval (7 days) and pupal stages (9 days). The early stage larvae were mobile, to some degree, showing slow movements while the later larval stage failed to display mobility. We hypothesize the spots that were commonly seen inside the body of late stage larvae may be fat particles. Similar spots were observed by Taylor (Reference Taylor1937) in well-developed larvae of Oligosita utilis Kow.
Development from egg to adult for U. principalis takes considerably longer than for other egg parasitoids of H. vitripennis. For example, at 24°C, Gonatocerus ashmeadi Girault and G. triguttatus Girault took 18 days to develop to adulthood (Leopold, Reference Leopold, Tariq, Oswalt, Blincoe, Spencer, Houser, Ba and Esser2003) while U. principalis took at least 23 days. Still, relative to the time it takes its host, H. vitripennis, to develop from egg to adult (ca. 38 days at 26.7°C: Lauziere et al., Reference Lauziere, Ciomperlik, Wendel, Tariq, Oswalt, Blincoe and Esser2002; and ca. 64 days at 27°C: Setamou & Jones, Reference Setamou and Jones2005), about two to three generations of U. principalis (at 26.7°C, the Ufens immature period is 18 days) can be produced for every generation of its host. However, the period of immature development of U. principalis at 24°C is very close to that of the closely related (within the family Trichogrammatidae) Zagella delicata De Santis, which took 23.5 days at 24.5°C to develop from egg to adult (Logarzo et al., Reference Logarzo, Virla, Triapitsyn and Jones2004).
The chorion of Homalodisca eggs parasitized by U. principalis becomes harder and more brittle and changes from the whitish, cream colour to a yellowish, orange colouration at ca. 4–5 days post parasitism at 26.7°C. Incidentally, eggs parasitized by U. ceratus showed this same transformation of colour (AKA, personal observation), although their immature development was not investigated in detail. Such changes in colour and structure can be used to identify Homalodisca eggs parasitized by Ufens spp. The structural and colour transformation induced by Ufens spp. in the present study resembles mummification of aphids due to parasitization by aphidine braconids and aphelinids, and mummification of caterpillars parasitized by rogadine braconids (Quicke, Reference Quicke1997). It is also similar to changes caused by egg parasitoids, such as Fidiobia dominica Evans & Pena and Brachyufens osborni (Dozier), attacking several Curculionidae (Jacas et al., Reference Jacas, Pena and Duncan2007, Reference Jacas, Pena and Duncan2009).
In Trichogrammatidae, immature development is often accompanied by changes in the structure and colouration of the host egg, unlike host eggs parasitized by mymarids which retain approximately the same colour and structure of unparasitized eggs (Bakkendorf, Reference Bakkendorf1934; AKA, personal observation). Tothill et al. (Reference Tothill, Taylor and Paine1930), cited in Clausen (Reference Clausen1940), described blackening of host eggs parasitized by Trichogramma nana Zehnt. Due to the deposition of minute dark granules on the inside of the chorion; and Clausen (Reference Clausen1940) stated that parasitism by Poropoea species (Trichogrammatidae) caused eggs of their coleopterous host to become reddish. According to Rojas-Rousse et al. (Reference Rojas-Rousse, Gerding and Cespedes1996), host eggs parasitized by Uscana senex (Grese) (Hymenoptera: Trichogrammatidae) go through five colour changes (light yellow, green, orange, brown and gray) before emergence. Host eggs parasitized by Paracentrobia species assume a brown colouration, as observed with P. andoi during its pupal stage (Vungsilabutr, Reference Vungsilabutr1978). Bakkendorf (Reference Bakkendorf1934) reported that host eggs parasitized by C. pulchra became increasingly grayish and opaque. More recently, Logarzo et al. (Reference Logarzo, Virla, Triapitsyn and Jones2004) stated that eggs of Tapajosa rubromarginata (Signoret) (Hemiptera: Cicadellidae) parasitized by Z. delicata attained a brownish or reddish colouration 5–7 days after parasitism.
The transformation in the structure of the host eggs of Ufens spp. involving hardening of the chorion could serve two purposes: (i) protection of the late larval and pupal stages from desiccation due to hot and/or dry weather and (ii) protection of the same stages from collapse of the surrounding plant tissue with desiccation of the leaf tissue. Eggs parasitized by U. principalis are quite hardy with respect to desiccation, as many eggs in dried and collapsing plant tissue were observed to retain their shape and, surprisingly, to successfully yield emerged adults (Triapitsyn, Reference Triapitsyn2003; AKA, personal observation). Huffaker et al. (Reference Huffaker, Holloway, Doutt and Finney1954) and Flock et al. (Reference Flock, Doutt, Dickson and Laird1962) indicated that trichogrammatids are hardier than mymarids parasitizing eggs of the beet leafhopper. According to Flock et al. (Reference Flock, Doutt, Dickson and Laird1962), trichogrammatid egg parasitoids of the beet leafhopper are adapted to dry desert conditions, whereas Huffaker et al. (Reference Huffaker, Holloway, Doutt and Finney1954) stated they were capable of surviving inside dry plant tissue in the insectary or in the field in winter and summer. The hardening of the chorion could also afford some protection against small predators with weak mouthparts.
The brittleness of the chorion could also make it easier for emerging adults to chew their way out of the egg. After emergence of adult Ufens spp., Homalodisca eggs retain their ‘mummified’ structure. Bakkendorf (Reference Bakkendorf1934) noted that the eggs of Cicadella viridis did not collapse after emergence of the trichogrammatid C. pulchra. He stated, however, that host eggs of the same species collapsed following Anagrus incarnatus Haliday emergence.
Adult emergence
Most emergence by U. principalis occurred on the first two days after initiation of eclosion; and, on each day, adults emerged mostly in the morning, less so in the afternoon and, to a still lesser extent, at night. The temporal pattern of emergence seen in U. principalis is similar to that of other trichogrammatids. Van Huis & Appiah (Reference Van Huis and Appiah1995) reported that most adult Uscana lariophaga Steffan, a tricogrammatid egg parasitoid of Callosobruchus maculates Fabricius (Coleoptera: Bruchidae), emerged during the first two days of a four-day eclosion period, with approximately equal emergence during the first two days. According to Van Huis & Appiah (Reference Van Huis and Appiah1995), the number of adults emerging during the photophase was similar to that emerging during the scotophase (based on a 12:12 L:D light-dark regime). Emergence occurred during the second half of the scotophase and first half of the photophase. Rounbehler & Ellington (Reference Rounbehler and Ellington1973) observed that the eclosion of Trichogramma semifumatum (Perkins) adults, reared at light regimes of 10:14 L:D and 14:10 L:D, started in the dark period just before dawn and continued into the light period. Hoffmann et al. (Reference Hoffmann, Walker and Shelton1995) stated that most adult Trichogramma ostriniae Pang & Chen emerged on the first day (68%) of three days of emergence and 83.2% of the adults tended to emerge between 0700 h (start of photophase) and 1300 h. Using a 14:10 L:D regime, Vungsilabutr (Reference Vungsilabutr1978) observed P. andoi adults emerging mostly (about 80%) in the morning (0600–1200 h), with some emerging throughout the rest of the light period (1200–2000 h) and no emergence during the dark period (2000–0600 h). However, Vungsilabutr (Reference Vungsilabutr1978) reported a surprisingly high (41.7%) successful emergence of adults (by inference from a reported 58.3% mortality) of this trichogrammatid in a totally dark regime. Hutchison et al. (Reference Hutchison, Moratorio and Martin1990) stated that 83.7% (an average of several temperature treatments) of total adult Trichogrammatoidea bactrae Nagaraja emerged within three hours of the onset of light (0600–0900 h) in growth chambers.
Ufens principalis females emerged mostly in the morning, with about equal emergence at night and during the afternoon. More males emerged at night during the first day and during morning of the second day of emergence. Most males probably started to emerge in the latter part of the night period, possibly not more than 2–3 h prior to the lights coming on in the growth chambers at 0600 h. This inference is supported by the observation at 0600 h of most, if not all males, with two black lines dorsally in the middle of the yellowish thorax. These black lines on a yellow thorax indicate freshly emerged adults because by 2–3 h after emergence, the thorax darkens, making the two black lines indistinguishable from the background colour of the thorax (Al-Wahaibi et al., Reference AI-Wahaibi, Owen and Morse2005). Another piece of evidence supporting this ‘before dawn’ starting of emergence comes from recordings of emergence and mating behaviours of U. principalis and U. ceratus using egg masses exposed, for the most part, to ambient light conditions (Al-Wahaibi et al., Reference AI-Wahaibi, Owen and Morse2005). It was difficult to start observations over 0600–0700 h from late August to early October in Riverside, California without the prior emergence of at least one male (AKA, unpublished data). These early emerging males needed an average of an hour to complete emergence, so they likely initiated emergence sometime between 0500 and 0600 h, at dawn or just before dawn. From these same recordings of emergence and mating behaviours, it was observed that the initiation of U. ceratus emergence generally tended to start earlier than for U. principalis (AKA, unpublished data). Early emerging males of the two Ufens species probably have the advantage of out-competing rival late-emerging males for potential females, and this habit of late night-very early morning emergence of males is possibly related to the phenomenon of aggressive male competition for mates in both Ufens spp. (Al-Wahaibi et al., Reference AI-Wahaibi, Owen and Morse2005).
Henriquez & Spence (Reference Henriquez and Spence1993) reported that males of an undescribed (at the time) Lathromeroidea species (Trichogrammatidae), a parasitoid of gerrid eggs (Heteroptera), emerged 24 h before females. Hoffmann et al. (Reference Hoffmann, Walker and Shelton1995) stated that only one female T. ostriniae was observed emerging during the dark period (2300–0700 h) and that the proportion of females (out of all adults) was relatively low during the first hour of emergence. Van Huis & Appiah (Reference Van Huis and Appiah1995) reported that the percentage of female U. lariophaga tended to increase linearly toward later emergence days. These authors attributed more females emerging in the later stages (days) of emergence to more males completing development earlier (males eclosed 6–8 h before females) and eclosing in higher number early during the eclosion period. In general, these reports of adult eclosion of other trichogrammatids agree with observations made in the present study.
The stimuli that initiate the pre-dawn eclosion process for male U. principalis (and possibly other trichogrammatids) in the absence of a light stimulus are not known but could possibly be internally driven by a clock set by the light regime prior to the completion of immature development. Light perceived through the chorion of host eggs could play a role in initiating eclosion for adults (including females) emerging in the morning and afternoon. These late-emergers (relative to the pre-dawn emergence of some males) might also be stimulated by sensing the sounds of other adults chewing their exit holes, resulting in what could initiate a chain reaction of emerging adults.
The rate of successful emergence (i.e. adults able to completely move out of the confines of the host egg and leaf into the outside environment) of U. principalis was relatively high (88%). In the literature, there are similar records for other trichogrammatids. Vungsilabutr (Reference Vungsilabutr1978) reported that 89.4% of P. andoi successfully emerged at 25°C (inferred from a 10.6% mortality rate with a 14:10 L:D regime). Hutchison et al. (Reference Hutchison, Moratorio and Martin1990) reported a 71.8 to 88.8% successful emergence rate for T. bactrae at temperatures over 22.5–25.0°C (inferred from their stated 28.2% and 11.2% mortality rates at these temperatures). On average, the rate of successful emergence of Lathromeroidea sp. (Henriquez & Spence, Reference Henriquez and Spence1993) on the least suitable host was 74.1% at 24°C and 19:5 L:D. On the more suitable host, the emergence rate of this parasitoid was about 89%.
In some cases, U. principalis adults tended to use previously cut exit holes to emerge. However, the ratio of the number of emerged adults to exit holes was relatively small (1.18) suggesting that most adults cut their own exit holes. This was confirmed via video recordings of a number of emerging adult U. principalis and U. ceratus (Al-Wahaibi et al., Reference AI-Wahaibi, Owen and Morse2005). This generally independent emergence of adult U. principalis and U. ceratus stands in contrast with a related Burksiella sp. (beneficus group as defined by Pinto (Reference Pinto2006)) (Trichogrammatidae) known to attack citrus katydid eggs (Scudderia furcata Brunner von Wattenwyl (Orthoptera: Tettigoniidae)) in southern California. In this species, a single hole is used for emergence by many adults (AKA, personal observation). This also contrasts with observations by Triapitsyn et al. (Reference Triapitsyn, Morgan, Hoddle and Berezovskiy2003) of Gonatocerus fasciatus Girault, where 6–7 adults of this species emerged through 2–3 exit holes.
Immature gregariousness: effects on adult size
The two assumptions underlying this part of the present study, (i) a majority of U. principalis adults successfully emerge from eggs of Homalodisca spp. and (ii) the ratio of the number of emerged adults to exit holes is close to unity, were verified by the results mentioned above. In many gregarious parasitoids, the size of adults is dependent upon host size and on the clutch size developing per host (Waage, Reference Waage, Waage and Greathead1986). In this study, host size was not investigated as a determinant of adult size. However, we indirectly investigated the effect of clutch size per host on adult size. The size of adult exit holes of insects can be a useful indicator of adult size and as a tool suggesting species identification. Williams et al. (Reference Williams, Barnes and Yates1979) and Cabrera et al. (Reference Cabrera, Marsh, Lewis and Seybold2002) measured exit holes of wood-infesting pest insects and their parasitoids in order to determine the species-specific size range of emergence holes. In contrast, in the present study, emergence hole size of U. principalis was utilized as an index for adult size.
This study provides evidence that adult size of U. principalis, estimated from the size of exit holes made by emerging adults in the field (which approximates the head width, a reliable indicator of adult size), results in a negative, curvilinear relationship with the number of U. principalis developing per host egg (i.e. the U. principalis clutch size). The size of U. principalis females was shown by Al-Wahaibi (Reference Al-Wahaibi2004) to be significantly and strongly related to their egg load. Similarly, adult size of other trichogrammatids has been shown to affect fitness parameters such as egg load (Hohmann et al., Reference Hohmann, Luck and Oatman1988; Pavlik, Reference Pavlik1993; Mills & Kuhlmann, Reference Mills and Kuhlmann2000). In turn, fitness of egg parasitoids is expected to play a role in their host parasitization efficiency.
Jervis & Copland (Reference Jervis, Copland, Jervis and Kidd1996) listed clutch size among the factors influencing progeny body size. Schmidt (Reference Schmidt, Wajnberg and Hassan1994) stated that for gregarious parasitoids such as Trichogramma spp., as clutch size increases in hosts of similar volume, the size of progeny decreases. Waage (Reference Waage, Waage and Greathead1986) noted that, in gregarious species, there exists a paradox of optimization of clutch size per host in which increasing the number of progeny is in conflict with the consequent reduction in fitness per individual resulting from the large number of relatively small-sized progeny. However, this clutch optimization notion is complicated in U. principalis by the high rates of superparasitism affected by the number of females visiting Homalodisca egg masses in the field, especially at times of large aggregations of ovipositing U. principalis females in summer (Al-Wahaibi et al., Reference AI-Wahaibi, Owen and Morse2005).
Acknowledgements
We thank Drs Gregory P. Walker and Mark S. Hoddle for their review of an earlier draft of the manuscript and for their guidance and support during AKA's PhD research. We acknowledge the assistance of current and former members of JGM's laboratory, including Alan Urena and Pamela Watkins. We also appreciate the assistance of Dr Imad Bayoun and Dr Daniel Gonzales for use of experimental equipment and room space and statistical assistance provided by Dr Karen Xu, Associate Director, UCR Statistical Collaboratory. This work was part of AKA's PhD research and was supported in part through a scholarship from Sultan Qaboos University, Sultanate of Oman.