


According to conventional wisdom, democratic consolidation depresses electoral participation because by the time democracy is consolidated, voters have become disillusioned with democracy or are apathetic in the face of reduced electoral stakes. This belief receives support from a number of impressive voter turnout declines recorded in newly consolidated democracies all over the globe. To cite just a few cases, less than 20 years after democratization, voter turnout fell by 17.5 percentage points (pp) in Portugal (which has held democratic elections since 1975), 29 pp in El Salvador (1982), 30 pp South Korea (1988), and 47 pp in Romania (1990). The size and speed of these declines are unparalleled in established democracies, where turnout tends to fluctuate by an average of 3 pp from one election to another (Blais Reference Blais, Klingemann and Dalton2007, 622), and where it decreased in legislative elections by approximately 7 pp between the 1960s and late 1990s (Norris Reference Norris2002, Chapter 3; Gray and Caul Reference Gray and Caul2000, Footnote 31; Franklin Reference Franklin2004, 120; Blais Reference Blais, Klingemann and Dalton2007, 628).
However, drastic voter turnout decline did not occur in all new democracies. Interestingly, in some of these countries, the decreasing dynamic was markedly less spectacular. For instance, in Spain, which, like neighboring Portugal, experienced a military dictatorship that lasted several decades before democratizing in the mid-1970s, turnout decreased by only 2.6 pp: 7 times less than in Portugal. A systematic overview of all 91 democratic consolidations that took place between 1939 and 2015, presented graphically in Figure 1, shows that, contrary to the usual expectations, a substantial decline in voter turnout occurred in only one out of every two democratic consolidations. In fact, voting rates decreased by less than 5 pp in 16% of cases, and in 34% of cases they did not decrease at all.
Total Voter Turnout Change over the First Six Democratic Elections Since 1939

The present article tackles the puzzling variation of post-democratization voter turnout dynamics. It contributes meaningfully to the political science literature on voter turnout, elections, and democratization in the following ways.
The article proposes a new theoretical framework that outlines the commonalities and differences between new and established democracies in terms of voter turnout drivers. It then further elaborates on factors that are specific to new democracies, which may account for the exceptionally dramatic shifts in voting rates that sometimes occur after democratization. Building on earlier works (Kostadinova Reference Kostadinova2003; Pacek, Pop-Eleches, and Tucker Reference Pacek, Pop-Eleches and Tucker2009), it identifies two possible causal mechanisms behind steep voting rate declines, which reflect two types of contexts: the democratization context and the consolidation context.
To test my new theory, the article conducts what I believe is the most comprehensive empirical analysis of voter turnout to date, covering most of the legislative elections held in consolidating and consolidated democracies between 1939 and 2015.
The results untangle the complexity of voter turnout dynamics in new democracies. They suggest that, contrary to conventional expectations, democratic consolidation as such does not depress voter turnout. The spectacular declines of electoral mobilization in new democracies are largely accounted for by the democratization context, which in certain circumstances strongly boosts voter turnout in the founding democratic elections. This depends essentially on two factors: the degree of electoral mobilization under the preceding dictatorship and the country's democratization path. For instance, the stark contrast between Portugal and Spain can be, in large part, attributed to the fact that the democratization process was mainly driven by the democratic opposition in Portugal, which rendered the Portuguese founding election particularly mobilizing, and by the authoritarian regime in Spain, which limited the euphoria and stakes in the Spanish founding election. Furthermore, the turnout-reducing effect of the democratic consolidation context is empirically supported only in post-Communist democracies. Even in these countries, however, the impact of the consolidation context is weaker than that of the democratization context. Hence, whether a dramatic decline in voter turnout occurs depends, ceteris paribus, much more on what happened before and during the regime change than after it. Furthermore, when the effects of the democratization and consolidation contexts are accounted for, voter turnout patterns in new democracies display tendencies similar to those in their established democratic counterparts. Accordingly, voting rates in new democracies are more likely to have decreased since the 1970s regardless of the democratization and democratic consolidation contexts.
When these findings are put together, they show that a single occurrence of a voter turnout decline in new democracies may stem from one to three sources. In combination, these sources can contribute to particularly sharp drops in electoral participation, such as that observed in Romania. They also explain why we have seen so many dramatic declines since the beginning of the third wave of democratization in 1974: prior to the third wave, opposition-driven democratizations from electorally mobilized dictatorships were rare, no consolidating democracy had to cope with Communist legacies, and the global environment was pushing turnout up in all democracies.
ELECTORAL PARTICIPATION AND THE PROCESSES OF DEMOCRATIC TRANSITION AND CONSOLIDATION
In the political science literature on voter turnout in new democracies, democratic consolidation is not often explicitly distinguished from democratization. However, this distinction is crucial for the theoretical developments that follow. Therefore, in the rest of the article, “democratization” (a phrase I use interchangeably with “democratic transition”) refers to the processes through which an authoritarian regime gives way to a democratic alternative. It ends after the first (i.e., founding) democratic election, when a democratically elected government takes over (Linz and Stepan Reference Linz and Stepan1996, 3). Democratic consolidation describes the “habituation phase” (Rustow Reference Rustow1970, 358) that follows democratization. It is a process during which the new democratic rules of the game become progressively routinized and embraced by the relevant political actors. Democratic consolidation reduces the chances of democratic reversal and ends—that is, democracies are consolidated (or established)—when the chance of reversal is very low and is no longer decreasing significantly (Gasiorowski and Power Reference Gasiorowski and Power1998). I therefore adhere to the “prospective” approach to democratic consolidation (Svolik Reference Svolik2015). Since the probability of democratic breakdown is significantly reduced by the end of the second democratic decade (Svolik Reference Svolik2008; Reference Svolik2015), in this study, democracies cease to qualify as “consolidating” (i.e., “new”) after six democratic elections. This generally corresponds to 20 years of democratic politics.Footnote 1
Having clarified the key terms, what is the impact of democratization and democratic consolidation on electoral participation? Most authors, with a few rare exceptions (Turner Reference Turner1993; Norris Reference Norris2002; see below),Footnote 2 concur that the latter typically reaches its peak in an early stage of democratization and then decreases over time in the consolidation stage (O'Donnell, Schmitter, and Whitehead Reference O'Donnell, Schmitter and Whitehead1986, 62; Kostadinova Reference Kostadinova2003; Rose and Munro Reference Rose and Munro2003, 26; Fornos, Power, and Garand Reference Fornos, Power and Garand2004; Kostadinova and Power Reference Kostadinova and Power2007; Pacek, Pop-Eleches, and Tucker Reference Pacek, Pop-Eleches and Tucker2009). Two different but largely compatible theoretical explanations can account for this pattern (see also Hughes and Guerrero Reference Hughes and Guerrero2009, 355).
The so-called “stakes-based” hypothesis of electoral turnout (notably Pacek, Pop-Eleches, and Tucker Reference Pacek, Pop-Eleches and Tucker2009) relies on a straightforward claim that people participate when it matters most. Electoral participation matters the most at the beginning of a transition (i.e., when the authoritarian regime is breaking down), because the form of the new political regime has yet to be decided. In contrast, once the new (democratic) regime is in place, the stakes are no longer as high. The nature of the main political issues usually ceases to be constitutional (or constitution-like), which kicks off the start of less-mobilizing, business-as-usual politics. This, in turn, translates into lower turnout levels.
The “disenchantment” hypothesis (Kostadinova Reference Kostadinova2003; Kostadinova and Power Reference Kostadinova and Power2007), in contrast, views high initial electoral participation rates as the result of generalized enthusiasm and citizens’ unrealistically raised expectations for the new democratic regime. The subsequent decline in voter turnout is then due to a democratic disenchantment caused by the confrontation with “real” democratic political life, in which many of citizens’ expectations are not—and cannot–be met. In the context of new democracies, this disenchantment has been given different names: “El desencanto” (“disillusion” in Spanish, Huntington Reference Huntington1991, 254), “post-totalitarian blues” (Rupnik Reference Rupnik, Diamond and Plattner1996), “euphoria-deflation effect” (McDonough et al. Reference McDonough, Shin and Álvaro Moisés1998, 21), and “post-honeymoon effect” (Inglehart and Catterberg Reference Inglehart and Catterberg2002, 9).
The practical implication of the two hypotheses is the same. Whatever the democratization context, democratic consolidation—understood as a process, not a final state—will always tend to decrease electoral participation. From an empirical perspective, this claim is supported by a number of qualitative case studies (Lehoucq and Wall Reference Lehoucq and Wall2004; Carlin Reference Carlin2006; Hughes and Guerrero Reference Hughes and Guerrero2009). However, in comparative terms, this claim was tested on a rather limited number of third-wave (i.e., post-1974) democratizers, namely select countries in either the post-Communist region (Rose and Munro Reference Rose and Munro2003, 26; Kostadinova Reference Kostadinova2003; Pacek, Pop-Eleches, and Tucker Reference Pacek, Pop-Eleches and Tucker2009), Latin America (Fornos, Power, and Garand Reference Fornos, Power and Garand2004), or in both (Kostadinova and Power Reference Kostadinova and Power2007). Interestingly, the findings of the only two studies with more diverse case selection questions the inevitability of the post-democratization decline in voter turnout. In his 1993 article, Arthur Turner compares voter turnout dynamics in a mix of pre-third-wave and third-wave democracies and concludes that “despite common expectations to the contrary, turnout in [. . .] [founding] parliamentary elections is lower than turnout in [. . .] subsequent parliamentary elections” (Turner Reference Turner1993, 36). Nevertheless, this conclusion draws on a very small sample (10 democratic transitions) and short timespans (the first two democratic elections in each country). Finally, in her 2002 book on political activism, Pippa Norris briefly mentions voter turnout trends in newly democratized polities. Drawing upon data from 39 “newer” (mostly third-wave) democracies but eschewing a theoretical discussion, she suggests that democratization (i.e., democratic consolidation) leads to increases and not declines in voter turnout (Norris Reference Norris2002, 56).
In summary, the available empirical evidence is mixed and lends frail support to the two aforementioned hypotheses. It suggests that voter turnout declines may occur in only some cases of democratic consolidation. Such a conclusion is corroborated in this article by the systematic overview of voter turnout in all new democracies between 1939 and 2015. As mentioned in the introduction, in almost one-third of the cases, voter turnout did not decline. Moreover, when it did, the magnitude of the decline varied widely. This puzzling variation cannot be explained by the existing accounts. The next section demonstrates theoretically that, in order to solve the puzzle of why we see such variation in voter turnout dynamics, the stakes-based and disenchantment accounts must be broken down into two distinct causal mechanisms and combined with a third causal mechanism that is not specific to new democracies.
THEORY AND HYPOTHESES: THREE CAUSAL MECHANISMS IN NEW DEMOCRACIES
The existing accounts agree that the uniqueness of new democracies, in terms of voter turnout, has to do with the dynamic of regime change, which potentially first increases (democratization stage) and then depresses (consolidation stage) voting rates. While this is a perfectly cogent claim, it dodges two theoretical issues.
The first issue pertains to the baseline level of voter turnout. If we were to discard the positive effects of democratization and the negative effects of democratic consolidation on voter turnout, what level of turnout would we see? The logical answer, embraced by this article, is that the baseline voter turnout level is the turnout level that would be observed if no regime change were in progress. In other words, the baseline electoral participation level in new democracies is determined by the factors at play in the rest of the democratic world, where democracy is established and regime change is but a distant memory.
Political science literature clearly shows that, in established democracies, the strongest predictors of voter turnout are political (e.g., margin of victory), institutional (compulsory voting) and socio-demographic (population size) factors, which create positive and negative incentives for participation. According to most extensive analyses, these classic voter turnout predictors can explain between 60 and 90% of the cross-national and over-time variance (Blais Reference Blais2000; Gray and Caul 2002; Franklin Reference Franklin2004). Numerous empirical studies confirm that these effects are consistent across democratic nations (see Geys Reference Geys2006; Blais Reference Blais, Klingemann and Dalton2007; Stockemer Reference Stockemer2016 for overviews). They can be weakened or magnified, to a limited extent, by another set of factors: citizens’ attitudinal characteristics (political interest, sense of civic duty, or political efficacy). These other factors, which have substantially weaker effects on aggregated voter turnout (Franklin Reference Franklin, LeDuc, Niemi and Norris2002, 151), vary not only across countries but also, in the mid- to long-term, over time. This temporal variation is due to processes such as generational replacement. According to the dominant explanation in the scientific literature, it is these factors that are responsible for the observed progressive voter turnout decline in established democracies (see below). Drawing on these findings, the present article postulates that the baseline level of voter turnout, from which voter turnout in new democracies increases or decreases, and which I refer to in this article as the standard voter turnout rate, is largely determined by the classic voter turnout predictors and, to a minor extent, by citizens’ attitudinal characteristics.
The second theoretical issue that is not addressed by the existing accounts of voter turnout in new democracies is their degree of compactness. Are the increases and decreases in voter turnout that occur during democratization and democratic consolidation necessarily part of a single, indivisible, causal mechanism? Or can these dynamics be driven, at least in some cases, by only one of the two stages of regime change, that is, by either democratization or democratic consolidation, but not both? This article answers this question with a resounding “yes,” thereby breaking down the existing accounts in favor of two distinct causal mechanisms. Distinguishing between these two separate mechanisms is necessary since, as the following paragraphs show, each mechanism represents a conceptually different source of decline, is independent from the other mechanism, and is driven by different causal factors.
The Mobilizing Mechanism
The first mechanism I discuss, the mobilizing mechanism (see Graph A1 in Figure 2), is well reflected in both the stakes-based hypothesis and the first part of the disenchantment hypothesis. It refers to factors that augment voter turnout at democratization but that vanish at the consolidation stage. For example, revolutionary euphoria or an uncertain election outcome, particularly when the fate of the regime is at stake, may boost citizens’ willingness to participate in the founding democratic election. This enthusiasm increases voter turnout above its standard level, that is, the counterfactual rate that would be observed had there been no democratization. However, later on in the consolidation process, the mobilizing factors are no longer present, causing the “democratization bonus” (i.e., the positive differential between the actual and unobserved standard turnout rates) to disappear. Following this line of thought, explaining post-democratization turnout decline hinges on accounting for variation in the initial mobilization phase of the founding election.
Illustration of the Causal Mechanisms: Without Any Trend in the Standard Voter Turnout Rate

The degree of initial electoral mobilization is likely to reflect the democratization context, which I suggest is made up of two principal factors. The first is the way the democratic transition occurred (i.e., the democratization path). Although there are many different ways to democratize, the particularly salient element for examining initial mobilization is how involved the opposition and citizenry are in the demise of the ancient regime. For example, in cases where the regime surrenders to pressure from the street, we are likely to see very different initial electoral turnout levels than in cases where a dictatorship is ended by foreign military intervention or at the discretion of the authoritarian ruler(s). I posit that the more that oppositional forces are involved in the regime change, the stronger the initial electoral mobilization. This can be attributed to revolutionary euphoria (i.e., citizens’ increased political efficacy and social connectedness) and/or high electoral stakes (i.e., the risk of a victory or return on the part of the autocrats).
Democratization Path Hypothesis (H1): The higher the involvement of the opposition in the democratic regime change, the stronger the participation bonus in the founding election.
The second type of contextual factors that may increase participation in the founding election relate to the voting act itself. Many scholars agree that voting is essentially a habit (Campbell et al. Reference Campbell, Converse, Miller and Stokes1960, 92; Plutzer Reference Plutzer2002; Gerber, Green, and Shachar Reference Gerber, Green and Shachar2003; Franklin Reference Franklin2004). Hence, the way that elections were conducted before democratization may help determine democratic electoral participation behavior. The more electorally mobilized that citizens were in the non-democratic period, the more they are socialized into voting, and the more likely they are to participate in the first democratic elections. These individuals face few administrative and practical obstacles to voting (e.g., registration is automatic and/or even the least educated people know the voting procedure), and there are good reasons to participate (the stakes seem high). However, because participation in democratic elections is not the same as participation in the context of non-democratic forced mobilization, the founding democratic elections may start a period of electoral re-socialization, during which citizens discover the role of the voting act in democratic politics (Franklin Reference Franklin2004, 199). As a result of this re-socialization process, people may either continue participating or cease doing so, depending on their experience with and interpretation of the democratic political developments. A substantial share of these people, especially those with fewer socio-economic resources, are likely to find democratic politics too complex and/or of little salience to their personal lives. Given the absence of electoral compulsion, they will decide to stop participating in the electoral process and thus contribute to the voter turnout decline.
Non-Democratic Electoral Mobilization Hypothesis (H2): The stronger the degree of electoral mobilization before democratization, the higher the turnout rate in the founding elections.
The Demobilizing Mechanism
The second causal mechanism that may be responsible for voter turnout dynamics in new democracies is the demobilizing mechanism (see Graph A2 in Figure 2). This mechanism accounts for the second part of the disenchantment hypothesis. It also captures the impact of factors that depress turnout, are absent at the start of democratic regime change, and then intervene during the consolidation process (i.e., the democratic consolidation context). Most typically, this demobilizing mechanism acts to decrease turnout below its “standard” level if citizens become dissatisfied with the reality of democratic politics. In other words, dissatisfaction is nonexistent at time 1 (democratization), but it emerges at time 2 (consolidation), which, all else being equal, results in a declining turnout trend. Although the demobilizing and mobilizing mechanisms operate in opposite directions, they can both be in play at different points in time in a single case of regime change. The combination of these two factors may account for particularly strong post-democratization voter turnout declines (see Graph A3 in Figure 2).
As outlined above, many studies assume that democratic consolidation always tends to depress voter turnout. This proposition is not theoretically implausible if one accepts that the appeal of democracy is based, to some extent, on an illusion (Schumpeter Reference Schumpeter1942, 264), which few people realize before living in a democratic polity themselves. Even though real-world democracies—or polyarchies, to quote Robert Dahl (Reference Dahl1971)—are superior to autocracies in many respects (Przeworski et al. Reference Przeworski and Michael2000), they lag considerably behind the democratic ideals that most people envision when participating in the demise of dictatorship and the establishment of democratic rule (Huntington Reference Huntington1991, 255, 263). When people realize that democracy is a not a panacea for all social and economic problems and that the power of the people to affect decision-making is limited, their political efficacy and their willingness to vote will decrease. Because of this psychological mechanism, decreasing voter turnout tendencies might be inherent to any democratic consolidation and should be observable once the effects of the classic voter turnout predictors and initial mobilization are taken into account.
The Democratic Illusion Hypothesis (H3): Since citizens’ democratic disenchantment is an inherent element of democratic consolidation, voter turnout tends to decrease after democratization.
However, democratic consolidation disenchantment may not be driven solely by the psychological mechanism. It may also depend on the realities faced by citizens in new democracies. The worse the new regime performs, especially in economic terms, the stronger citizens’ disenchantment, and thus the decline in voter turnout should be even greater. Conversely, if the new regime performs well, disenchantment and turnout decline may be limited or even nonexistent. Here, economy is considered to be a valence issue, where the desirable property is overall economic prosperity.
The Democratic Regime Performance Hypothesis (H4): The worse the economic performance of the new democratic regime, the greater the decline in voter turnout.
The Standard Voter Turnout Rate
In addition to the mobilizing and demobilizing mechanisms, which are specific to new democracies, there is a third potential source of voter turnout variation: the standard voter turnout rate. This is a function of classic voter turnout predictors and citizens’ characteristics, and it is a main contributing factor to setting the voter turnout rate in established democracies. Unless it remains stable or varies randomly, then it, too, may have a significant effect on the voter turnout dynamics in new democracies. If it follows a negative trend, as illustrated by graphs B1, B2, and B3 in Figure 3, it would reinforce the depressing effect of the mobilizing and/or demobilizing mechanisms. In contrast, if the trend of the standard rate is positive (Graphs C1, C2. and C3 in Figure 3), it could partly or entirely offset the effects of demobilization. If neither the mobilizing nor the demobilizing mechanisms are at work in a country, then the direction of the voter turnout trend is, as in established democracies, entirely responsible for the post-democratization voter turnout dynamic.
Illustration of the Causal Mechanisms: With Negative and Positive Trends in the Standard Voter Turnout Rate

From this point of view, it is important to remember that, in established democracies, voter turnout has been declining since the 1970s or 1980s. Most scholars attribute this to changes in citizens’ characteristics and generational replacement (Miller and Shanks Reference Miller and Merrill Shanks1996; Lyons and Alexander Reference Lyons and Alexander2000; Putnam Reference Putnam2000; Wattenberg Reference Wattenberg2003; Blais, Gidengil, and Nevitte Reference Blais, Gidengil and Nevitte2004; Wass Reference Wass2007; Blais and Rubenson Reference Blais and Rubenson2013; for a more nuanced picture see Franklin Reference Franklin2004; Gallego Reference Gallego2009; and Konzelmann, Wagner, and Rattinger Reference Konzelmann, Wagner and Rattinger2012). Because of technological, economic, social, and geopolitical transformations, citizens across the globe have become increasingly more educated, better able to decode the political game, and more demanding vis-à-vis their governments (Inglehart Reference Inglehart1990; Dalton Reference Dalton2000; Klingemann and Dalton Reference Klingemann, Dalton, Dalton and Klingemann2007; Norris Reference Norris2011; Klingemann Reference Klingemann, Dalton and Welzel2014). These “critical citizens” (Norris Reference Norris2011) or “dissatisfied democrats” (Klingemann Reference Klingemann, Dalton and Welzel2014) have also been increasingly exposed to the failures and deficiencies of the political sphere thanks to the development of investigative journalism, private media, and technological advances such as the Internet.
The shifts in citizens’ cognitive skills and the amount of information at their disposal weaken the appeal of ideologies and strengthen citizens’ independence from political parties, trade unions, and social groups (Knutsen Reference Knutsen2007). More importantly, these global factors also seem to have affected citizens’ attitudes towards political engagement, rendering the conventional forms (including electoral participation) less appealing and raising interest in non-conventional forms of participation, such as demonstrations or boycotts (Dalton Reference Dalton2000, 933; Inglehart and Catterberg Reference Inglehart and Catterberg2002; Norris Reference Norris2002; Mayer Reference Mayer2010, 282).
These changes in the global context, particularly rising education levels, also greatly contributed to the Third Wave of Democratization, which began in 1974 (Huntington Reference Huntington1991, 65; Welzel and Inglehart Reference Welzel and Inglehart2006). Moreover, some micro-level studies find that the attitudinal and generational patterns pertaining to political participation that exist in established democracies are present in third-wave new democracies, as well (Coffé and van der Lippe Reference Coffé and van derLippe2010; Chang Reference Chang2012). Consequently, there is reason to expect that voter turnout (i.e., the standard voter turnout rate) in new democratic regimes may follow trends similar to those observed in more established democracies. Actually, when the data on voter turnout in new democracies presented in Figure 1 are reorganized by democratization wave (see Figure 4), there is a clear tendency for voter turnout to decline after 1974, but the same cannot be said of pre-1974 turnout levels. Besides global shifts in political culture or in classic predictors of turnout, these changing patterns may, of course, also translate to changes in the causal mechanisms specific to new democracies. In particular, if citizens in new democracies are increasingly critical and demanding, they may be more susceptible to post-democratization disenchantment. The following empirical analyses examine these eventualities.
Voter Turnout Change by Election Sequence and by Wave of Democratization

CASE SELECTION AND DATA
In order to test the proposed hypotheses empirically, I built an exhaustive database of legislative elections held in the contexts of democratic consolidation between the Second World War (1939) and the present (2015), the period for which reliable data was available. The database was collected thanks to the electoral results handbooks compiled by Dieter Nohlen and his colleagues (Nohlen, Krennerich, and Thibaut Reference Nohlen, Krennerich and Thibaut1999; Nohlen, Grotz, and Hartmann Reference Nohlen, Grotz and Hartmann2001; Nohlen Reference Nohlen2005; Nohlen and Stöver Reference Nohlen and Stöver2010), which I updated with other sources on more recent elections.Footnote 3 In line with the aforementioned conceptualization of democratic consolidation, the database contains the first six democratic elections to the lower house of parliament (or constitutional assembly) for each new democracy. The main variable of interest is the voter turnout rate, expressed as a percentage of registered voters.
Regarding the operationalization of democratic transitions, it is based on the overall polity score in the Polity IV project (version 2015), which is a widely-used tool in political science research to assess regime change.Footnote 4 Polity scores vary from -10 (full autocracy) to +10 (full democracy). My case selection is as inclusive as possible: any shift from negative to positive numbers (or to zero) qualifies as a democratic transition.Footnote 5 I have also added all new democratic countries—mostly former colonies—that do not exist in the Polity IV dataset prior to their independence. At the same time, because democratic transitions are sometimes short-lived and because we are interested in democratic consolidation turnout dynamics, only democracies that endured for at least 3 elections are included in the analysis. In the end, the database contains a total of 91 democratic transitions and 494 elections.Footnote 6 A list of these countries and their elections, as well as summary statistics for all variables introduced below, can be found in the Supplemental Materials.
This article performs two main empirical analyses. The first analysis focuses on the first part of the mobilizing mechanism (H1, H2) and studies the participation bonus in the founding democratic election. The second analysis models the dynamics of voter turnout in the first six democratic elections, and, in addition to assessing the impact of the participation bonus (H1, H2), it explores the presence of the demobilizing mechanism (H3, H4).
ANALYSIS 1: THE DEMOCRATIZATION STAGE
Methods
In accordance with the proposed theory, the democratization participation bonus studied in the first analysis is the difference between the actual voter turnout rate (observed in the founding democratic election) and the standard turnout rate that would be expected in an election held in an established democracy with the same characteristics as the nascent democracy at hand. To estimate the participation bonus, I compiled an additional dataset of elections held in established democracies, that is, countries that have been democratic for at least 20 years and meet high democratic standards (Polity ≥ 6), using the same sources as those used for new democracies. This dataset contains 453 elections held in 65 countries after 1939.Footnote 7 The founding elections from the 91 democratic consolidations are added to this dataset. I then analyze the data through a generalized least squares (GLS) regression analysis using the classic voter turnout predictors (see below) as control variables. The participation bonus is given by the coefficient of a dummy variable Founding Election, which corresponds to the difference in turnout rate between a new and an established democracy if all other voter turnout predictors are held constant.
The Democratization Path Hypothesis (H1) is tested via six dummy variables that correspond to different modes of democratic regime change. The constant represents the turnout rate for the elections in established democracies. The six modes of democratic regime change are based on an updated version of the classic typology by Samuel Huntington (Reference Huntington1991, 114).Footnote 8 I sort countries into the following categories: Replacement (regime change brought about by opposition forces), Transplacement (a pact between opposition and government), Transformation (transition initiated by government forces), Adverse Intervention (domestic dictatorship terminated by hostile external forces), Foreign liberation (foreign occupation terminated by allied external forces) and Decolonization (regime change resulting from independence).Footnote 9 The Democratization Path Hypothesis presumes that turnout in the founding elections should vary as a function of the involvement of opposition forces in the transition process. This means that the highest turnout rates should be observed after replacements, while the lowest turnout rates (i.e., no democratization bonus) should be observed after internally-induced regime change (transformations).
The Non-Democratic Electoral Mobilization Hypothesis (H2) asserts that electoral mobilization in the authoritarian era leads to higher voter turnout in the founding democratic elections. To test this hypothesis, a dummy variable (Authoritarian Mobilization) was constructed for all countries that held elections in the 5 years preceding the transition and displayed voter turnout rates higher than 80%, that is, higher than the long-term average observed in established democracies in the second half of the 20th century (Blais Reference Blais, Klingemann and Dalton2007, 624). This condition is met by 25 of the 91 founding elections in the dataset.Footnote 10 It should be noted that both authoritarian mobilizations and bottom-up regime change became much more common in the post-1974 era.Footnote 11 If these two factors prove to be sources of post-democratization declines in voting, then they are at least partly responsible for the difference between pre-third-wave and third-wave democracies shown in Figure 4.
I control for three aforementioned types of classic voter turnout predictors: institutional, political, and socio-economic (Geys Reference Geys2006, Blais Reference Blais, Klingemann and Dalton2007, Stockemer Reference Stockemer2016).Footnote 12 The first institutional factor is the type of political regime: parliamentary or (semi-)presidential. If the country's president is directly elected in a separately-held election, this reduces the salience of legislative elections and, therefore, voter turnout (Pacek, Pop-Eleches, and Tucker Reference Pacek, Pop-Eleches and Tucker2009). I operationalize this via dummy variables (Semi-)Presidential (directly elected presidencies = 1) and Concurrent (simultaneous presidential and legislative elections = 1). Voter turnout tends to be higher when voting is compulsory and when the electoral compulsion is enforced (Fornos, Power, and Garand Reference Fornos, Power and Garand2004). The dummies Compulsory and Compulsory Enforced are respectively coded as one when voting is explicitly compulsory by law, and when sanctions for abstention exist and are enforced, at least sporadically. In Western democracies, more proportional electoral systems are associated with higher voter turnout because they incentivize citizens to vote and motivate parties to mobilize voters (Stockemer Reference Stockemer2015). This is operationalized via the continuous variable ADM (average district magnitude: total number of seats divided by the total number of electoral districts). I also control for the legal voting age (Voting Age), as its reduction contributed to voter turnout decline in established democracies (Franklin Reference Franklin2004).
Political factors comprise Competitiveness (the difference in the vote share between the party with the highest percentage of votes and the party with the second-highest percentage of votes) and Decisiveness (the absolute value of the difference between 50% of the votes and the vote share of the party with the highest percentage of votes). The greater these values, the less competitive (in terms of party competition) or decisive (in terms of policy outcomes) elections should be, depressing voter turnout (Franklin Reference Franklin2004). In terms of socio-economic factors, I include the natural logarithm of the size of the electorate in millions (Electorate Size) and the natural logarithm of the gross domestic product, measured in 1990 Geary–Khamis dollars (GDP). While the former should decrease turnout by diluting the importance of one's vote (Blais Reference Blais2000), the latter should increase voter turnout by raising citizens’ literacy and improving the conditions in which elections are conducted (Blais Reference Blais, Klingemann and Dalton2007). The analysis also includes regional dummies (Africa, Asia, Latin America, Oceania, and North America, with Europe serving as the reference category) to control for geographic and cultural specificities.Footnote 13 Decade dummies (reference: 1990s) allow for period effects; I expect that they will reflect the post-1970s declining trend reported by previous studies (see above).
Finally, given the time-series, cross-sectional nature of the data, it is necessary to be aware of four potential sources of statistical bias: unit heterogeneity, autocorrelation, contemporaneous correlation, and non-stationarity (Wilson and Butler Reference Wilson and Butler2007). To deal with unit heterogeneity, the usual approach in the social sciences is to apply fixed effects (Allison Reference Allison2009). Nevertheless, the time-invariant nature of the main variables of interest (dummies in Hypotheses 1 and 2) and the data structure (for each new democracy, the number of time points T = 1) preclude the use of such a “within” model. Instead, I follow Pacek, Pop-Eleches, and Tucker's study (Reference Pacek, Pop-Eleches and Tucker2009) and use a random effects model. I show in the Supplemental Material that the results are robust to a range of alternative modeling strategies.Footnote 14 In addition, statistical tests suggested the presence of serial correlation (but neither contemporaneous correlation nor non-stationarity) in the data.Footnote 15 As the data are cross-sectionally dominated (the number of units G > T), I address this problem by using clustered standard errors (Wooldridge Reference Wooldridge2010, Section 13.8.2).
Results
The result of the first empirical analysis is reported in Table 1. The baseline model, Model A, includes only elections held in established democracies (453) and classic voter turnout predictors. Model B incorporates 80 founding democratic elections (N = 533).Footnote 16 Finally, Model C tests Hypotheses 1 and 2. It is important to note that, in all three models, the regression coefficients of most classic voter turnout predictors remain in the expected direction. For instance, turnout rates are higher when voting is compulsory or when there is another simultaneously held election. Conversely, they are lower in less developed countries or large electorates.Footnote 17 The decade dummies show that, as expected, voter turnout started declining around the 1970s.Footnote 18
Voter Turnout Rates in the Founding Democratic Elections

+ p < 0.10, * p < 0.05, ** p < 0.01, *** p < 0.001. Clustered standard errors in parentheses. Elections in established democracies serve as the reference category in models B and C.
Model B supports the common wisdom that democratization is associated with unusually high citizen participation. On average, voter turnout in founding elections is higher by approximately 6.7 percentage points than in “normal” democratic contests. However, the next model shows that this common wisdom needs to be refined. As suggested by Hypothesis 1, the democratization bonus tends to vary depending on the democratization path and, in particular, on the involvement of the opposition. When the regime change is entirely (replacements) or partially (transplacements) driven by the opposition forces, the bonus is the highest (12.2 and 6.9 pp, respectively). Conversely, when the involvement of the opposition is not decisive in the democratization process, the rise in voter turnout in the founding elections is weaker or insignificant. In particular, in democratizations safely controlled by the authoritarians (transformations), no participation bonus is observed.
The second hypothesis (H2) related to the mobilizing mechanism is also supported. In transitions from authoritarian regimes that conducted elections and mobilized their citizens to participate, turnout in the founding democratic elections is approximately 12.3 pp higher than in “normal” democratic elections, regardless of the democratization path. Consequently, in replacements from mobilized dictatorships, the estimated value of the democratization bonus is nearly 24.5 pp. If the democratization bonus predicts voter turnout declines, then this has important implications for understanding voter turnout dynamics in new democracies. This is explored in the second empirical analysis, in which the estimated democratization bonus becomes one of the predictors.Footnote 19
ANALYSIS 2: THE CONSOLIDATION STAGE
Methods
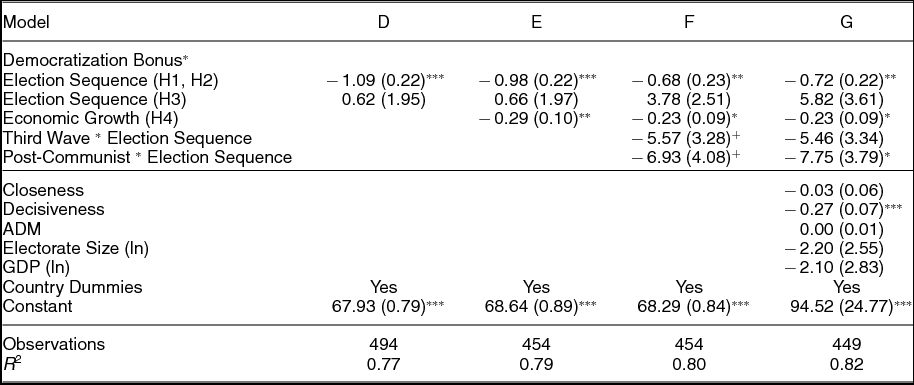
The second empirical analysis models the post-democratization dynamic of voter turnout in the first six democratic elections. As the main interest now lies in turnout dynamics and the data structure allows it (T > 1 for all units), I apply fixed effects.Footnote 20 Since statistical tests indicate the presence of autocorrelation (but not of contemporaneous correlation or non-stationarity),Footnote 21 I report clustered standard errors. However, various alternative model specifications give the same substantive results (see Section D in the Supplemental Materials).
To complete the test of the first two hypotheses (H1 and H2), which involve the mobilizing mechanism, the estimation of the democratization participation bonus from the first empirical analysis (i.e., the regression coefficients related to different forms of transitions and degrees of authoritarian mobilization) now becomes one of the predictors. It is important to note that fixed effects preclude including dummy and slowly changing variables in the model (Beck Reference Beck2011). On the other hand, it is possible to interact such variables with normally changing variables, which is important for my theory. The corollary of the theoretical propositions developed above is that the dynamic of regime change is the strongest at the beginning of democratic consolidation and weakens over time. Therefore, Democratization Bonus (and other variables below) is interacted with a time-changing variable called Election Sequence that varies inversely with the election number and ranges from –1 to 0. Accordingly, the impact of the Democratization Bonus will be the strongest for the first election (for which the bonus is multiplied by –1) and nonexistent for the sixth election (for which it is multiplied by 0). The values of Election Sequence are negative purely for ease of interpretation, since positive values of the Democratization Bonus are supposed to reduce voter turnout.
As for the predictors that correspond to the demobilizing mechanism, a non-interacted form of the Election Sequence variable is used to test the Democratic Illusion Hypothesis (H3). The Democratic Regime Performance Hypothesis (H4) is operationalized with the continuous variable Economic Growth, which measures the average annual economic growth (in percentage points of GDP) since the last election.Footnote 22 To control for potential temporal or regional variation in Hypotheses 3 and 4, I tested the interactions of their respective operationalizations with the dummy variable Third Wave (coded as one (1) for countries that democratized after 1974) and with regional dummies. In the full model specification, I also include the time-varying control variables from Analysis 1: Closeness, Decisiveness, ADM, Electorate Size, and GDP.
Results
The results are presented in Table 2. All models strongly support Hypotheses 1 and 2, indicating that the democratization bonus contributes to declines in voter turnout. The regression coefficient is always in the hypothesized direction (i.e., negative), substantial, and highly statistically significant. Its value remains relatively close to -1, which means that, in the processes of democratic consolidation, voter turnout gradually decreases by approximately the same amount by which it was increased by the democratization context in the founding election.
Voter Turnout Rates in the First Six Democratic Elections

+ p < 0.10, * p < 0.05, ** p < 0.01, *** p < 0.001. Clustered standard errors in parentheses. The non-interacted versions of the Democratization Bonus, Third Wave and Post-Communist are absorbed by the fixed effects.
As for the Democratic Illusion Hypothesis (H3), it is clearly not supported. Once the initial mobilization (Models D-F) and other factors (Model G) are controlled for, democratic consolidation as such does not depress voter turnout. On the contrary, the coefficient of Election Sequence is positive, which means that, before 1974, voter turnout even tended to increase after democratization.
For post-1974 consolidations, Election Sequence must be added to its interaction with the Third Wave. In Model F, this interaction is negative, and it is substantively and statistically significant. This suggests that, like in established democracies, there is a difference between the pre-1974 era, which was more conducive to participation, and the post-1974 era. However, the combination of the interaction (Third Wave * Election Sequence) with the main term (Election Sequence) yields only a weakly negative coefficient (-1.8) that is statistically insignificant (p = 0.46). Moreover, when the time-variant controls are added (Model G), the combined coefficient becomes (slightly) positive (0.4). This reveals that the (insignificant) decline observed in Model F can be accounted for by shifts in the standard voter turnout rate. There is no evidence that democratic consolidation has a specific effect that depresses electoral participation. The only exception to this general finding concerns post-Communist democracies.Footnote 23 In those countries, voting rates tended to decline by 7.4 percentage points in addition to the contribution of the democratization bonus.
The Democratic Regime Performance Hypothesis (H4) is also invalidated, since the coefficient of Economic Growth is in the wrong direction and of little substantive meaning. The model indicates that, in a country with an average GDP growth (2% for the dataset), turnout tended to decrease (not increase, as hypothesized) by a relatively negligible amount, ranging between 0.58 (Model E) and 0.46 (Model F and G) percentage points.Footnote 24
The results of the second analysis, which were tested for robustness on various subsets of the data (see the Supplemental Materials), are graphically summarized in Figure 5. The figure displays the predicted voter turnout rates for maximal and zero values of the democratization bonus based on Model G. In addition, I plot an estimation of the voter turnout standard rate, which corresponds to an out-of-sample prediction of voter turnout combining the characteristics of new democracies (those studied in the second analysis) and the regression coefficients from established democracies (replication of Model A in the first analysis).Footnote 25 It amounts to the level of voter turnout that would be expected in any established democracy with the same characteristics as the new democracies.
Predicted Voter Turnout Dynamics in New Democracies

Figure 5 clearly shows that, after democratization, the presence and magnitude of the voter turnout decline depends on the mobilizing mechanism. If voter turnout is not boosted in the founding elections (the democratization bonus is zero), then the consolidation process as such does not depress electoral participation, and voter turnout rates oscillate around the standard voter turnout rate. This corresponds to an increasing trend in pre-1974 new democracies and a decreasing trend in post-1974 new democracies. This once again suggests that, when democratization and consolidation dynamics are controlled for, voter turnout in new democracies follows an evolution similar to that observed in established democracies.Footnote 26 At the same time, the figure corroborates the exceptionality of post-Communist democracies. By the sixth election, their voting rates sank well below the standard voter turnout rate. Thus, the demobilizing mechanism warrants further investigation in these cases, which I discuss below. Together, these findings deconstruct the difference between post-1974 and pre-1974 voter turnout rates, as shown in Figure 4. There is no evidence that, in the third wave of democratization, voter turnout declines became more frequent because of democratic consolidation. Except for in post-Communist democracies, turnout tended to decline because of different democratization contexts (i.e., more frequent opposition-driven democratizations and mobilized dictatorships) and change in factors that are not specific to new democracies.
CONCLUSION
The present article draws on the most exhaustive empirical material to date on voter turnout dynamics in new democracies. Scrutinizing all cases of democratic consolidations between 1939 and 2015, it challenges the currently held expectation in political science that the process of democratic consolidation automatically triggers a voter turnout decline. Voter turnout declines in new democracies appear to be almost entirely a function of what happens before regime change, not what happens afterwards. These declines occur in countries in which the democratization process is driven by the opposition and in which the previous regime required a strong degree of electoral mobilization. According to my interpretation, these factors boost voter turnout above the standard voter turnout rate in the founding elections. Thus, the voter turnout rate in founding elections is above the level that would be expected in an established democracy with the same characteristics. After the founding elections, however, these effects vanish, which makes voter turnout decline progressively to the standard level.
It is true that, since the 1970s, voter turnout declines have become more frequent in consolidating democracies, regardless of the initial mobilization in the founding elections. Nevertheless, this is a tendency that new democracies share with established democracies and that, presumably, reflects well-documented global changes in democratic politics and citizens’ characteristics. Moreover, when the usual predictors of voter turnout are controlled for in new democracies, the shift brought by the third wave of democratization moves from a positive turnout trend to no trend (rather than to a decline). Ultimately, with the exception of post-Communist democracies, there is no evidence that democratic consolidation depresses voter turnout.
Post-Communist democracies are the only new democracies in which voter turnout declined below the standard rate and, thus, where democratic consolidation, not just unusually high initial mobilization, may have depressed voter turnout. However, the concrete causal mechanism in these cases remains unknown. Existing studies on the region have found little explanatory power in the factors through which consolidation is usually expected to depress turnout, such as widespread corruption (Kostadinova Reference Kostadinova2009), economic disenchantment (Pacek, Pop-Eleches, and Tucker Reference Pacek, Pop-Eleches and Tucker2009) and dissatisfaction with democracy (Kostelka Reference Kostelka2015). The findings of this article invite researchers to pay more attention to alternative explanations that may complement the democratic consolidation accounts.
One possible explanation relates to post-Communist citizens’ attitudinal and value characteristics. If these characteristics are particularly unfavorable to voting and date back to the communist era (Mishler and Rose Reference Mishler and Rose1997; Bernhagen and Marsh Reference Bernhagen and Marsh2007; see also Kostelka Reference Kostelka2014, 959–961), then it may be that the standard rate in the post-Communist region is simply lower than elsewhere in the world. This would imply that the mobilizing mechanism is responsible for an even larger share of the post-Communist decline. Another alternative explanation pertains to voter registration. In most post-Communist democracies, voter registration is automatic, inclusive (based on population registers), and lifelong. In contrast to countries such as Canada or France (let alone the United States), practically all citizens remain eligible to vote, even when abroad, and are counted in the official voter turnout rates throughout their adulthood. Moreover, many post-Communist democracies are located near rich Western countries, and these Western democracies attracted a large number of immigrants from post-Communist countries during the post-Communist consolidation period. According to some estimates, East-West migration accounts for several percentage points of the post-Communist decline (Comşa Reference Comşa2015; Kostelka Reference Kostelka2017). Future research could use this article as a departure point and include these factors in a comprehensive study of the post-Communist voting rates.
SUPPLEMENTARY MATERIALS
To view supplementary material for this article, please visit https://doi.org/10.1017/S0003055417000259.
Replication files will be found on Dataverse at https://doi.org/10.7910/DVN/MYSRXT as of September 1st, 2017.






Comments
No Comments have been published for this article.