




No CrossRef data available.
A GENERALIZED PORTMANTEAU GOODNESS-OF-FIT TEST FOR TIME SERIES MODELS
Published online by Cambridge University Press: 10 February 2004
Abstract
We present a goodness-of-fit test for time series models based on the discrete spectral average estimator. Unlike current tests of goodness of fit, the asymptotic distribution of our test statistic allows the null hypothesis to be either a short- or long-range dependence model. Our test is in the frequency domain, is easy to compute, and does not require the calculation of residuals from the fitted model. This is especially advantageous when the fitted model is not a finite-order autoregressive model. The test statistic is a frequency domain analogue of the test by Hong (1996, Econometrica 64, 837–864), which is a generalization of the Box and Pierce (1970, Journal of the American Statistical Association 65, 1509–1526) test statistic. A simulation study shows that our test has power comparable to that of Hong's test and superior to that of another frequency domain test by Milhoj (1981, Biometrika 68, 177–187).
Information
- Type
- Research Article
- Information
- Copyright
- © 2004 Cambridge University Press
1. INTRODUCTION
Most conventional goodness-of-fit tests for time series models are based on the autocorrelations of residuals from the fitted model. Examples of such tests include the portmanteau statistic of Box and Pierce (1970) and its generalization, based on arbitrary kernel functions, by Hong (1996). The Box–Pierce statistic is obtained as a particular case of the Hong statistic by using the truncated uniform kernel. Simulations by Hong show that his statistic computed using kernels other than the truncated uniform kernel gives better power than the Box–Pierce statistic against autoregressive (AR) processes and fractionally integrated processes.
Box and Pierce (1970) derive the null distribution of their test for autoregressive moving average (ARMA) models, and Hong derives the null distribution only for finite-order autoregressive models. Both these results require assumptions that rule out long memory processes that have hyperbolically decaying correlation functions and spectral densities unbounded at the origin. Furthermore, both tests requires the computation of residuals from the fitted model, which can be quite tedious when the model does not have a finite-order autoregressive representation. Also, in such cases, the residuals are not uniquely defined.
A test statistic that circumvents the computation of residuals from the fitted model is proposed by Milhoj (1981). To test the hypothesis that the observations xt, t = 1,…,n, are from a process with spectral density f (λ), he suggests the test statistic

where

is the periodogram of the observations, and λj = 2πj/n is the jth Fourier frequency. Though Milhoj's test statistic is easily computed, his theoretical results are restricted to short memory time series models with bounded spectral densities. Assuming Gaussianity, Beran (1992) extends Milhoj's results to long memory time series models that have unbounded spectral densities at the origin. Examples of long memory processes are the autoregressive fractionally integrated moving average (ARFIMA) process (see Hosking, 1981). Beran states that the null distribution of Mnd in the presence of long memory is the same as that derived by Milhoj (1981) in the case of short memory. Beran obtains his results by claiming that Mnd is asymptotically equivalent to its integral version

where V(λ) = I(λ)/f (λ).
However, Deo and Chen (2000) show that even in the case of Gaussian white noise, Mnd and Mn do not have the same asymptotic distribution and that the variance of the asymptotic distribution of Mn is two-thirds that of the variance of the asymptotic distribution of Mnd. Thus, the asymptotic distribution of Mnd in the long memory case is still an open question.
In this paper, we introduce a test statistic that is a frequency domain analogue of Hong's statistic. We derive the asymptotic null distribution for both short memory models and long memory models. Because our test does not require the calculation of residuals, it can be easily applied to long memory processes such as the ARFIMA models that do not possess finite-order AR representations. Our test delivers uniformly better power than the periodogram-based test Mnd of Milhoj.
In the next section, we define our test statistic and provide the theoretical results on its asymptotic null distribution for short and long memory models. The power properties of our test are studied in Section 3 through simulations. The proofs are relegated to the Appendix.
2. THE TEST STATISTIC
To motivate our test statistic, it is instructive to consider Hong's statistic to test the null hypothesis that the observations, xt, t = 1,2,…,n, are from an AR(p) process, xt = α0 + α1 xt−1 + ··· + αp xt−p + εt, where εt are zero mean white noise. Let et be the residuals from the fitted model,

, where

are the estimates of the parameters α0,α1,…,αp. The test statistic of Hong (1996) is

where k(·) is a suitable kernel function such that

are the sample autocorrelations of the residuals, and

are their sample autocovariances,

By Parseval's identity, Hn can be written as

where

The kernel function k here is also called the lag window and

is the lag-weights spectral density estimator. Let In,e be the mean corrected periodogram of the residuals given by

Using the relation

we have an equivalent form of

in the frequency domain,

where W, the spectral window corresponding to the lag window k, is its Fourier transform

Expressions (1) and (3) provide the motivation for our test statistic. To test a general null hypothesis that the observations xt are from a process with spectral density f (·), we propose the following test statistic:

where

and I is the periodogram of the observations x1,…,xn. Note that

is a discrete version of

in (3) with In,e replaced by I/f. Thus, we whiten the process in the frequency domain instead of in the time domain. This not only avoids the computation of residuals but also allows one to easily test for arbitrary spectral densities. Furthermore, Tn is obtained by discretizing the integral in (1) with

replaced by

. Also note that Tn is mean invariant because

is evaluated only at Fourier frequencies. This is especially favorable in the presence of long memory, because the sample mean is not fully efficient in that case (see Beran, 1994, p. 6).
Hong (1996) establishes the asymptotic normality of Hn for AR models. We show that Tn is asymptotically normal under a null hypothesis that can be either short memory or long memory if the process is Gaussian. The properties of a long memory process differ substantially from those of a short memory process, and hence the proof of the asymptotic results for long memory models requires a more delicate approach than that for short memory models. We now state the assumptions we make and our main results.
Throughout the rest of this paper, we assume that {xt} is a stationary linear process of the form

where the innovations εt satisfy the following assumption.
Assumption 1. The series {εt} is independently and identically distributed with mean zero, variance σ2, and E(εt8) < ∞.
We also make the following assumptions about the kernel k(·) and the bandwidth pn.
Assumption 2a. The kernel function k : R → [−1,1] is a symmetric function that is continuous at zero and at all but a finite number of points, with k(0) = 1. Furthermore, assume that for some δ ≥ 1, zδ|k(z)| < ∞ as z → ∞.
Assumption 3. The bandwidth pn satisfies log6 n/pn → 0 and pn3/2/n → 0.
As can be seen from the proof of Lemma 2 in the Appendix Assumption 3 on the maximum rate of increase of the bandwidth pn is made merely to ensure that our test statistic has the same limiting distribution as Hong's test statistic. If we were to relax this assumption, we would get a slightly different mean and variance for the limiting distribution of our test statistic. It is also worth noting that all the kernels used in practice satisfy Assumption 2a. The next theorem states the asymptotic distribution of Tn when {xt} is a short memory process.
THEOREM 1. Let x1,…,xn be n observations from a stationary linear process defined by (6) with coefficients ψj such that

and innovations εt satisfying Assumption 1. Let f (·) be the spectral density of the process such that infλ f (λ) > 0. Let Tn be as in (5) and W be defined by (4) with kernel function k satisfying Assumption 2a and bandwidth pn satisfying Assumption 3. Then

in distribution as n → ∞, where

It can be shown that a process satisfying the assumptions in Theorem 1 has bounded spectral density and autocovariances that are absolutely summable (Brockwell and Davis, 1996, ex. 3.9). Such a process is a short memory process, an example of which is the ARMA model. The assumptions on the process {xt} of Theorem 1 are satisfied by a broad range of short memory models, whereas the asymptotic theory of Hn is established only for AR models.
To establish the asymptotic normality of Tn when the process is a long memory process, we restrict the process {xt} to be Gaussian. We also require additional assumptions on k, which we state next.
Assumption 2b. In addition to Assumption 2a, the kernel function k is differentiable almost everywhere and satisfies ∫|k′(z)k(z)| dz < ∞.
All the kernels used in practice satisfy Assumption 2b. We now state the asymptotic distribution of Tn when {xt} is a long memory process. For the long memory case, we make the extra assumption that the process xt is Gaussian. We feel that this assumption can be relaxed just as in the short memory case in Theorem 1, though at the expense of much greater complexity in the proof.
THEOREM 2. Let x1,…,xn be n observations from a stationary Gaussian linear process defined by (6) that has a spectral density f (λ) = λ−2dg*(λ), d ∈ (0,0.5) and g*(·) is an even differentiable function on [−π,π]. Also let the spectral density satisfy infλ f (λ) > 0. Let Tn be defined as in Theorem 1 with kernel function k satisfying Assumption 2b and bandwidth pn satisfying Assumption 3. Then

in distribution as n → ∞, where Cn(k) and Dn(k) are as in Theorem 1.
A stationary linear process that has a spectral density satisfying the assumption of Theorem 2 is a long memory process. It can be shown that the autocovariances decay to zero hyperbolically and are not summable for such a process (Zygmund, 1959, Theorem 2.24). Examples of long memory processes satisfying the assumptions of Theorem 2 are ARFIMA models (Granger and Joyeux, 1980; Hosking, 1981) and fractional Gaussian noise (Mandelbrot and Van Ness, 1968).
In applications, the null hypothesis of interest is the composite hypothesis that the process has spectral density f (θ,·) for some unknown θ in the parameter space Θ. Under this composite null, the test statistic becomes

where

and

is some estimator of θ based on the sample x1,…,xn. Under certain additional assumptions, we show in the next two theorems that the asymptotic null distribution of

remains the same as that of Tn in Theorem 1 and in Theorem 2. We first state the additional assumptions we need.
Assumption 4. Let Θ0 be a compact subset of Θ, where Θ is a finite-dimensional parameter space. Let the spectral density of the process {xt} be f (θ0,·), where θ0 is the true parameter vector that lies in the interior of Θ0. Assume that the estimator

satisfies

.
The following is an assumption on the spectral density for short memory process.
Assumption 5. The spectral density f (θ,λ) satisfies the following conditions for (θ,λ) ∈ Θ × [0,2π] :
(i) f (θ,λ) and f−1(θ,λ) are continuous at all (θ,λ).
(ii) ∂/∂θj f−1(θ,λ) and ∂2/∂θj∂θk f−1(θ,λ) are continuous and finite at all (θ,λ).
It is very easy to establish that Assumptions 4 and 5 are satisfied by all ARMA models. The next theorem states the asymptotic distribution of

when {xt} is a short memory process.
THEOREM 3. Let x1,…,xn be n observations from a stationary linear process satisfying the same assumptions as those of Theorem 1. Let the estimated parameter vector

satisfy Assumption 4 and the spectral density of the process {xt} satisfy Assumption 5. Also let

be defined by (7) with kernel function k and bandwidth pn satisfying the same assumptions as those of Theorem 1. Then

in distribution as n → ∞, where Cn(k) and Dn(k) are defined as in Theorem 1.
To establish the asymptotic distribution of

when {xt} is a long memory process, we need the following assumption on

and the spectral density f (θ,·).
Assumption 6. Let Θ0 be a compact subset of Θ, where Θ is a finite-dimensional parameter space in

for some positive integer s. Let the spectral density of the process {xt} be f (θ0,λ) = f*(d0,λ)g*(β0,λ), where f* and g* are even functions on [−π,π], f*(d,λ) ∼ ad λ−2d as λ → 0 for some ad > 0, g*(β,λ) is differentiable on [−π,π] , and θ0 = (β0,d0)′ is the true parameter vector that lies in the interior of Θ0. Furthermore, assume that the sth component of Θ0 is contained in the segment [δ1,0.5 − δ1] for some 0 < δ1 < 0.25 and that there exists an estimator

that satisfies

.
Assumption 7. Let θ = (β,d)′, where (β,d) ∈ Θ0. For any δ > 0, the spectral density f (θ,λ) satisfies the following conditions.
(i) f (θ,λ) is continuous at all (θ,λ) except λ = 0, f−1(θ,λ) is continuous at all (θ,λ), and

(ii)) ∂/∂θj f−1(θ,λ) and ∂2/∂θj∂θk f−1(θ,λ) are continuous at all (θ,λ) and

(iii) There exists a constant C with

uniformly for all λ and all θ1 = (β1,d1)′ and θ2 = (β2,d2)′ such that d1 < d2.
All the conditions of Assumptions 6 and 7 are satisfied by fractional Gaussian noise and ARFIMA processes (see Dahlhaus, 1989). We now state the asymptotic distribution of

when {xt} is a long memory process.
THEOREM 4. Let x1,…,xn be n observations from a stationary Gaussian linear process satisfying the same assumptions as those of Theorem 2. Let the estimated parameter vector

satisfy Assumption 6 and the spectral density of {xt} satisfy Assumption 7. Also let

be defined by (7) with kernel function k and bandwidth pn satisfying the same assumptions as those of Theorem 2. Then

in distribution as n → ∞, where Cn(k) and Dn(k) are defined as in Theorem 1.
The theoretical results that we have presented all address the asymptotic behavior of the test statistic when the null hypothesis is correctly specified. An additional question of interest is the power property of the test statistic when the spectral density given by the null hypothesis is actually misspecified. If both the true model and also the misspecified model under the null hypothesis are short memory models, it can be shown quite easily that the statistic Tn is consistent. We do not include the proof for this statement because it is simply tedious but does not have any technical hurdles. However, in the long memory case establishing consistency is a more complicated problem. The complexity of the problem arises because of the fact that when a model is misspecified for a long memory series, the rate of convergence of the parameter estimates of the misspecified model need not be

-consistent and need not even be asymptotically normal. For example, it is known (see Yajima, 1993) that when an AR(1) model is fit to a long memory process with memory parameter d ∈ (0.25,0.5), the estimate of the AR(1) parameter converges to the population lag 1 autocorrelation at a rate n0.5−d and has an asymptotic distribution that is not Gaussian but is instead the Rosenblatt process. Thus, the “usual” behavior of estimators of parameters of a misspecified model is not obtained, and a careful analysis has to be carried out on the behavior of goodness-of-fit tests under such misspecifications. We leave this problem of consistency for future research. Another interesting problem for further research is the behavior of the test under local alternatives, where the spectral density under the alternative hypothesis approaches the spectral density under the null hypothesis at some rate an. As pointed out earlier, the rate of convergence of the estimators of the null hypothesis model when the alternative is true depends on d. Hence, we would expect that the rate an at which the test will have nontrivial local power will depend on d, unlike the result obtained in Theorem 4 of Hong (1996) for the short memory case. However, we are currently unable to conjecture exactly how an will depend on d, and we leave that question for future work.
An additional question of interest is the choice of pn. Because Cn(k) ∼ 1/(2π) and Dn(k) ∼ Apn for some constant A, we would expect based on our preceeding results, that under a misspecified model, the rate at which Tn would diverge from 1/(2π) would be n/pn1/2. Thus, one would expect in general that the slower pn grows the more powerful the test would be though no optimal choice of pn can be stated.
In our next section we study the finite-sample performance of our test through Monte Carlo simulations.
3. SIMULATION STUDIES
We generated 5,000 replications of Gaussian series of length n = 128 and 512 from a variety of AR and ARFIMA processes. The algorithm of Davies and Harte (1987) was used in the data generation of ARFIMA models. For each series, we computed the three test statistics: (i) Our statistic Tn. (ii) Hong's statistic Hn. (iii) The Milhoj statistic Mn. The statistics were suitably normalized so that they would have an asymptotic standard normal distribution under the null. For Tn and Hn, we used the following three kernels.

For computing Tn and Hn, we used three bandwidths, pn = [3n0.2], [3n0.3], and [3n0.4]. Note that there is no bandwidth involved in computing Mn.
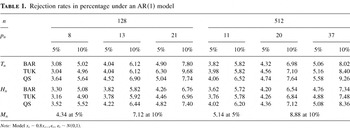
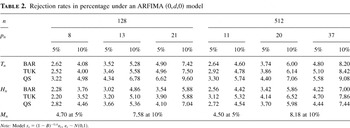
In Tables 1 and 2, we report the sizes of the three tests under the composite null hypothesis of an AR(1) and an ARFIMA(0,d,0), respectively. The true AR(1) parameter was set to 0.8, and the true long memory parameter d in the ARFIMA(0,d,0) was set at 0.4. Because the null hypothesis was a composite one, we had to estimate the parameters of the AR(1) model and the ARFIMA(0,d,0) model, which was done using the Whittle likelihood in the frequency domain. From Tables 1 and 2, it can be seen that for both models, all three statistics are undersized at both the 5% and 10% levels. The amount by which they are undersized decreases as the bandwidth pn increases. The Mn-statistic is least undersized, whereas the sizes of Tn are comparable to those of Hn.
Rejection rates in percentage under an AR(1) model

Rejection rates in percentage under an ARFIMA (0,d,0) model

Though our theory on the asymptotic distribution of the test statistic Tn has been established only under the assumption of Gaussianity for the case of long memory series, we believe that our result would still hold for non-Gaussian innovations that have a finite eighth moment. Hence, we simulated both a non-Gaussian AR(1) process and a non-Gaussian ARFIMA(0,d,0) process in which the innovations came from a t distribution with 9 degrees of freedom. The AR(1) parameter was set to 0.8, and the long memory parameter d was set to 0.4 as in the earlier simulation for Gaussian data. Tables 3 and 4 present the sizes of the three tests under the composite null hypothesis of an AR(1) and an ARFIMA(0,d,0), respectively, for the case of t distributed innovations. On comparing Tables 3 and 4 with Tables 1 and 2, it is seen that the performance of the tests with respect to size in the case of t distributed innovations is very similar to that of the tests when the data are Gaussian.
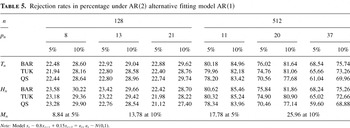
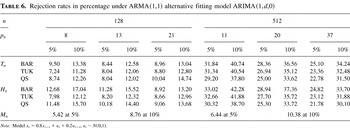
To compare the power of the tests, we considered the following four cases: (a) fitting an AR(1) to data generated by an AR(2), xt = 0.8xt−1 − 0.1xt−2 + εt. (b) fitting an ARFIMA(1,d,0) to data generated by an ARMA(1,1), xt = 0.8xt−1 + εt + 0.2εt−1. (c) fitting an ARMA(1,1) to data generated by an ARFIMA(0,d,0), (1 − B)0.4xt = εt where B denotes the backshift operator. (d) fitting an ARFIMA(0,d,0) to data generated by an ARFIMA(1,d,0), (1 − B)0.4(1 − 0.1B)xt = εt. The results are reported in Tables 5, 6, 7, and 8, respectively. In all cases, the null hypotheses were composite, and the parameters of the model under the null hypothesis were estimated using the Whittle likelihood.
Rejection rates in percentage under AR(2) alternative fitting model AR(1)

Rejection rates in percentage under ARMA(1,1) alternative fitting model ARIMA(1,d,0)

Rejection rates in percentage under ARFIMA(1,d,0) alternative fitting model ARFIMA(0,d,0)

It is seen that both the tests Tn and Hn have significantly higher power than Mn in all the alternatives considered. This is not surprising, because the tests Tn and Hn give decreasing weights to higher lag sample correlations, whereas Mn gives uniform weight at all lags. It might be tempting to believe that this property of Mn may be useful in detecting long memory alternatives. This belief is however belied by Table 7, where we fit a short memory model to a long memory series and yet Mn is outperformed by a wide margin by both of the other tests. On the other hand, it is seen that the power of Tn is very similar to the power of Hn, with neither test outperforming the other significantly in any situation considered.
Rejection rates in percentage under ARFIMA(0,d,0) alternative fitting model ARMA(1,1)

Rejection rates in percentage under an AR(1) model with innovations from t distribution

Rejection rates in percentage under an ARFIMA (0,d,0) model with innovations from t distribution

APPENDIX: PROOFS
We will only provide the proofs for long memory models. The proofs for short memory models are similar though much simpler and are available from the authors. In this Appendix, we will often use the following decomposition of I(λ):

where ψ(λ) =

is the periodogram of the innovations εt in (6). Then

where

Let

be the jth sample covariance of the εt given by

, for | j| ≤ n − 1.
Proof of Theorem 2. Let

be the periodogram of the innovations εt without mean correction. For the Fourier frequencies, λk, k = 1,…,(n − 1), we have Iε(λk) = In,ε(λk), where In,ε is the periodogram of the mean corrected innovations εt − ε. Also define

In Lemmas 1–3, which follow, we show that

Also, by Lemma 3,

. The theorem now follows by Theorem 1 of Hong (1996) and the fact that

by Assumption 2a. █
Proof of Theorem 4. By Theorem 2 it suffices to show that

which we do by establishing that

and

We will prove only (A.4) because the proof of (A.5) is similar. Let

Then the LHS of (A.4) is

By a similar argument of deriving (A.25) in the proof of Lemma 1, which follows, the RHS of the preceding equation is

where

For every λj and λh, we have by a Taylor series expansion,

where

for some 0 < αjh < 1 and

To prove (A.4), we will show that (A.6) is op(1) by verifying, for each u,

and

We first show (A.9). Let

then

Because

, (A.9) is true if

By (A.1), it is thus enough to show that


and

Because g(λ) = O(λ−δ) by Assumption 7, (A.13) and (A.14) can be shown by an argument similar to that used to establish (A.26) and (A.27) in the proof of Lemma 1. To show (A.12), we let

Using the fact that

, the LHS of (A.12) is

We will show that both terms of the last expression in (A.15) have second moments of order o(n3pn). By the Cauchy–Schwarz inequality, we have

Because εt are independent with zero mean, the preceding expectation is positive only when the random variables inside the parentheses consist of products of even powers of the εt. Thus, the preceding expression is dominated by two cases: one is when p1 = p2 = 0, u1 = u2, and v1 = v2, and the other is when p1 = p2 = 0, u1 = v1, and u2 = v2. Using Lemma 6, which follows, the order of these two cases is

It can be shown that the second moment of the second term in (A.15) is also of order o(n3pn) by similar arguments. We have thus established (A.9).
Next, we establish (A.10). Let

denote the (u,v)th element of the matrix

Then, by (A.8) and Assumption 7,

where

. Because

, (A.10) will follow if for every (u,v)

To show this, it suffices, by (A.1), to prove that

We will prove only the first of these, because the proof for the other two is similar. Letting

we have

First consider

. Then

for all j,h. Hence, by Assumption 7 and (A.16), we have

with probability 1 for some 0 < A < ∞ for all j,h . Also, by the Cauchy–Schwarz inequality, supj,h E|Iε(λj)Iε(λh)| < K < ∞, and it follows from (A.19) and (A.28) in the proof of Lemma 1 that

Now consider

. Then

for all j,h. By part (iii) of Assumption 7 we get that

where

for all j. Furthermore,

with probability 1 for some 0 < A < ∞ by (A.16). Using these bounds and (A.28) we get

From (A.20) we have that T1 = op(n2pn1/2). Also, by (A.21),

An argument similar to that in (A.20) shows that

and because

, we get T2 = Op(n3/2 log n) = op(n2pn1/2). Arguing in the same vein, we establish that T3 = I(d0 < ¼)Op(n log n) + I(d0 ≥ ¼)Op(n4d0+2δ log n) = op(n2pn1/2). These bounds on T1, T2, and T3 yield

Thus, (A.17) follows from (A.18), (A.20), and (A.23). █
LEMMA 1. Under the assumptions in Theorem 2,

Proof. The LHS of (A.24) is

Letting ks = k(s/pn) and Φ(λj,λh) = Iε(λj)R(λh) + Iε(λh)R(λj) + R(λj)R(λh), the last line of the preceding equation becomes

We will show that (A.25) is op(1) by verifying

and

where

is defined in (A.7). To prove the preceding two equations, we will need a bound for

. We first note that from page 2 of Zygmund (1977)

uniformly in b for 0 < λ < π. Using this bound, in conjunction with the fact that

and by applying summation by parts and by Assumption 2b, for s ≠ 0 we obtain

where

. Similarly,

and hence

We shall only derive (A.26) and (A.27) when j ≠ h, because the proofs for j = h are similar and simpler. To prove (A.26) we note that the LHS of (A.26) is bounded by

Using the Cauchy–Schwarz inequality, Lemma 5, equation (A.28), and the fact that maxj E(Iε2(λj)) < ∞, the first term and second term of the preceding equation are of the order

To verify the third term is o(npn1/2), we will show that

By Assumption 3, Lemma 4 and (A.28),

Thus (A.26) is proved. The proof of (A.27) is similar to that of (A.26). █
LEMMA 2. Under Assumptions 1, 2a, and 3,

Proof. Because Iε(λj) = In,ε(λj) and In,ε(0) = 0, we have

Now

Hence, to show Lemma 2, it is sufficient to prove that

and

In the steps that follow, we will assume that k has unbounded support. If k has bounded support, all terms involving kp kn−|p| are zero in both (A.29) and (A.30) and the proof is extremely simple. By Assumptions 2a and 3,

because

. We now verify equation (A.30).

By Lemma 1 on page 186 of Grenander and Rosenblatt (1957),

. Hence, by Assumption 2a, the first term of (A.31) is

and the second term of (A.31) is

and the lemma is established. █
LEMMA 3. Under the assumptions in Theorem 2,

Proof. The proof of the second claim of the lemma is contained in the proof of the first claim, which we show subsequently. By (A.1),

Let In,ε be the mean corrected periodogram of εt. Then

. We have the first term of the last line,

Thus, the LHS of (A.32) is

We will show that the second term is Op(n−2 log4 n). It follows by Chebyshev's inequality and the fact that

that the first term is Op(n−1 log2 n). Now

By Lemma 5, which follows, the first term is O(log2 n), the second term is O(log4 n), and the third term is O(log4 n), and hence (A.33) is Op(n−1 log2 n). █
LEMMA 4. Under the assumptions in Theorem 2,

and

uniformly for log2 n ≤ j < h ≤ n, log2 n ≤ k < [ell ] ≤ n.
Proof. The development of this proof closely matches that of Lemma 2 of Hurvich, Deo, and Brodsky (1998). We shall use the following notation:

The LHS of (A.34) is

Note that the last expectation of (A.36) is zero. Let

The vector υ has a eight-dimensional multivariate Gaussian distribution with mean zero and covariance matrix Σ. Define Ψ = Σ−1. Partition Σ and Ψ as

where Σij and Ψij are 4 × 4 matrices. By the formulas for the inverse of a partitioned matrix,

Letting

, we have from Lemma 4 of Moulines and Soulier (1999)

for 1 ≤ j < k ≤ n/2. Following arguments similar to those in this lemma, it can be shown that for 1 ≤ j < k ≤ n/2


Letting

where I8 is a 8 × 8 identity matrix, we see from (A.37)–(A.39) that R = o(1) for log2 n < j < h ≤ n/2, log2 n < k < [ell ] ≤ n/2. By the fact that (I + A)−1 = I − (I + A)−1A, we get Ψ = 2I8 − 2R(I8 + 2R)−1 = O(1). Let

and define

. We have


Let υ(jh) = (υ1,υ2,υ3,υ4)′, υ(k[ell ]) = (υ5,υ6,υ7,υ8)′; the first term of the preceding equation is

The first quadruple integral of (A.42) is

where

Let τ11 be the largest absolute entry of M11. Because |eu − 1| ≤ |u|e|u| for all u,

Thus (A.43) is equal to

The second term is O(τ11) = O(j−2dk2d−2 log2 k1(j<k) + k−2dj2d−2 log2 k1(j>k)) by (A.37)–(A.39). Note that

Let η11 be the largest absolute entry of 2R11(I4 + 2R11)−1,

Thus the first term of (A.44) is

The first term of the RHS of the preceding equation is zero because the first double integral is the expectation of ζj assuming the covariance matrix is 0.5I4. The second term is O(η11) = O(j−dhd−1 log h). We have shown that the first quadruple integral of (A.42) is O(j−dhd−1 log h + j−2dk2d−2 log2 k1(j≤k) + j2d−2k−2d log2 j1(k≤j)). It can be shown in the same fashion that the second quadruple integral of (A.42) is O(k−d[ell ]d−1 log [ell ] + j−2dk2d−2 log2 k1(j≤k) + j2d−2k−2d log2 j1(j>k)). Hence (A.40) is O(j−dhd−1k−d[ell ]d−1 log h log [ell ]).
Now we consider (A.41). By the mean value theorem, |eu − 1 − u| ≤ ½u2e|u| for all u. Thus

where τ is the largest absolute entry of . Note that τ2 = O(j−2dk2d−2 log2 k1(j≤k) + j2d−2k−2d log2 j1(k≤j)). Hence (A.41) is

The second term is O(τ2). The first term is the linear combination of

,…, etc., where

denotes the expectation assuming that υ is multivariate normal with mean zero and covariance matrix

. Note that

implies that the vectors (Aj,Bj,Ah,Bh), (Ak,Bk,A[ell ],B[ell ]) are independent. Thus, for example,

, and both of these expectations are zero because the ζjξh and ζkξ[ell ] are even functions of (Aj,Bj,Ah,Bh), respectively, and because the densities for (Aj,Bj,Ah,Bh) and (Ak,Bk,A[ell ],B[ell ]) are also even functions. We have shown that (A.41) is O(τ2) = O(j−2dk2d−2 log2 k1(j≤k) + j2d−2k−2d log2 j1(k≤j)). Hence

It can be shown in a similar way that the rest of the second and the third expectations of (A.36) are both O(j−dhd−1k−d[ell ]d−1 log h log [ell ]) uniformly in log2 n ≤ j < h ≤ n/2, log2 n ≤ k < [ell ] ≤ n/2. The order in (A.35) can be derived following the same lines as previously. █
LEMMA 5. Under the assumptions of Theorem 2,

uniformly for log2 n ≤ j < h ≤ n. Also max1≤j≤n E [R2(λj)] < ∞.
The proof of the first two bounds stated in this lemma is similar to that of Lemma 4. The last bound is obtained by using the bounds (A.37)–(A.39) and the Gaussianity of the observations.
LEMMA 6. Let g(λ) be defined as (A.11). Then, under Assumption 7,

Proof. We shall prove the lemma by showing that

We first derive the result for m = 0. Note that

Hence, the LHS of (A.45) is

where λh−1 < λh < λh and we use the fact that g(λ) is symmetric around π/2. By Assumption 7, the last equation is

For m ≠ 0, we have by summation by parts

Because

uniformly in a and b for 0 < λ < π (see the proof of Lemma 1), this is

References
REFERENCES
Beran, J.
(1992)
A goodness-of-fit test for time series with long range dependence.
Journal of the Royal Statistical Society, Series B
54,
749–760.Google Scholar
Beran, J.
(1994)
Statistic for Long Memory Processes.
Chapman & Hall.
Box, G.E.P. &
D.A. Pierce
(1970)
Distribution of residual autocorrelations in
autoregressive-integrated moving average time series models.
Journal of the American Statistical Association
65,
1509–1526.Google Scholar
Brockwell, P. &
R. Davis
(1996)
Time Series: Theory and Methods,
2nd ed.
Springer.
Dahlhaus, R.
(1989)
Efficient parameter estimation for self-similar processes.
Annals of Statistics
17,
1749–1766.Google Scholar
Deo, R.S. &
W.W. Chen
(2000)
On the integral of the squared periodogram.
Stochastic Processes and Their Applications
85,
159–176.Google Scholar
Granger, C.W.J. &
R. Joyeux
(1980)
An introduction to long memory time series models and fractional
differencing.
Journal of Time Series Analysis
1,
15–29.Google Scholar
Grenander, U. &
M. Rosenblatt
(1957)
Statistical Analysis of Stationary Time Series.
Wiley.
Hong, Y.
(1996)
Consistent testing for serial correlation of unknown form.
Econometrica
64,
837–864.Google Scholar
Hurvich, C.M.,
R.S. Deo, &
J. Brodsky
(1998)
The mean squared error of Geweke and Porter-Hudak's estimator
of the memory parameter of a long-memory time series.
Journal of Time Series Analysis
19,
19–46.Google Scholar
Mandelbrot, B.B. &
J.W. Van Ness
(1968)
Fractional Brownian motions, fractional noises, and applications.
SIAM Review
10,
422–437.Google Scholar
Moulines, E. &
P. Soulier
(1999)
Broadband log-periodogram regression of time series with long-range
dependence.
Annals of Statistics
27,
1415–1439.Google Scholar
Yajima, Y.
(1993)
Asymptotic properties of estimates in incorrect ARMA models for
long-memory time series. In
New Directions in Time Series Analysis, part 2, pp.
375–382.
Zygmund, A.
(1977)
Trigonometric Series.
Cambridge University Press.
Rejection rates in percentage under an AR(1) model
Rejection rates in percentage under an ARFIMA (0,d,0) model
Rejection rates in percentage under AR(2) alternative fitting model AR(1)
Rejection rates in percentage under ARMA(1,1) alternative fitting model ARIMA(1,d,0)
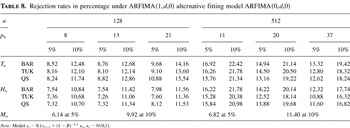
Rejection rates in percentage under ARFIMA(1,d,0) alternative fitting model ARFIMA(0,d,0)
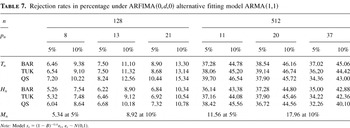
Rejection rates in percentage under ARFIMA(0,d,0) alternative fitting model ARMA(1,1)
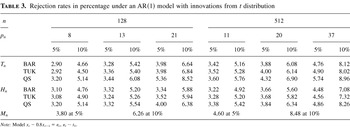
Rejection rates in percentage under an AR(1) model with innovations from t distribution
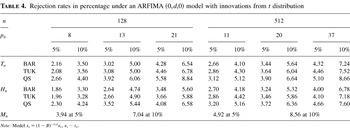
Rejection rates in percentage under an ARFIMA (0,d,0) model with innovations from t distribution
 You have
Access
- 30
- Cited by