

Introduction
Australia's Royal Commission into Misconduct in the Banking and Financial Services Industry was established on 14 December 2017 and the final report was released in February 2019. The commission dealt with banking, financial advice, superannuation and insurance. The submissions and public hearings in 2018 exposed a litany of malpractice including charging fees for no service and worse still fees to dead people. Chair of the Commission, Justice Hayne argued financial institutions that broke the law had not been properly held to account. Justice Hayne made 24 referrals to the regulatory authorities over specific conduct, including three major banks (NAB, Commonwealth and ANZ) and six financial institutions (AMP, Allianz, IAG, IOOF, Suncorp and Youi). Hayne stated (ACSI, 2016):
there can be no doubt that the primary responsibility for misconduct in the financial services industry lies with the entities concerned and those who managed and controlled those entities.
Justine Hayne argued their boards and senior executives bore primary responsibility for what had happened.
AMP, one of Australia's largest financial institutions, made an early appearance at the Commission and in response to the exposure of the ‘fees for no service’ scandal, the CEO Craig Mellor resigned immediately and 9 days later, the Chair of the Board Catherine Brenner also resigned. This was followed by the resignations of two of the three remaining female directors. The one remaining female director left at the end of 2018. These resignations, triggered by strong pressure from institutional and retail investors, did nothing to halt AMP's share price slide and certainly altered the board's gender balance. The composition of the new AMP Board is nine men and only one woman.
Whilst these were not the only resignations of board members and senior executives, Catherine Brenner's departure leads to a contentious debate in the business press concerning the pursuit of targets to achieve gender diversity on boards. Elizabeth Proust Chairwoman of the Australian Institute of Company Directors (AICD) vigorously defended Brenner and argued that the treatment that forced her to resign from AMP was sexist (Kitney, Reference Kitney2018). However, not everyone shared Proust's view of the situation. Critics have argued that the rush to achieve gender targets on Boards is picking up inexperienced directors, which may be at the expense of performance. Chris Corrigan, a high-profile Australian business figure said that Brenner ‘was elevated to the role because she was a woman’ and sparked more controversy and debate by posing the rhetorical question (Albrechtsen & White, Reference Albrechtsen and White2018):
Can you imagine that a man with moderate investment banking experience at a second-rate investment bank would have got to be chair of the AMP?
A third position was taken by both the Australian Shareholders Association (ACSI) and the AICD who called for the resignation of the entire AMP Board on the grounds that the issue was poor governance and not gender.
The public debate about Brenner has focussed on the gender issue. In our view, this is a mistake. Our study suggests that what is really at issue is age (a proxy for experience) a little discussed aspect of diversity. An unintended consequence of increasing gender diversity has been to lower the average age of a board's directors. In the case of AMP, at the time of the Royal Commission hearing, the average of the Board was 56 years and the Chair Catherine Brenner was 47.
In this paper, we investigate the question of whether the age of its board is correlated to the financial performance of a company. Our sample is taken from the ASX 500 (all ordinaries) and involves panel data over a 5-year period.
The role of the board and diversity
The Australian Banking Royal Commission has refocused attention on the role and duties of Boards and their Directors in achieving organisational effectiveness. There are a number of perspectives on effectiveness. In the corporate governance literature, the dichotomy is between the shareholder and stakeholder perspectives on performance. Capitalist economies assume a broad shareholder approach and therefore governance structures are designed to ensure that the interests of shareholders are prioritised. The role of the board of directors is to ensure that managers act as agents of the shareholders (Williamson, Reference Williamson1981). From this perspective, performance is defined narrowly using financial and economic measures. In recent years, there has been an increasing focus in the literature on stakeholder theory, which starts from the premise that the role of the board is to manage the competing interest of stakeholders. The role of the Board according to this model is stewardship (Muth & Donaldson, Reference Muth and Donaldson1998). From this perspective, performance is defined more broadly to include social and environmental outcomes as well as economic and financial results.
The original impetus for increasing board diversity was social justice or equity. However, a dichotomy revealed in early studies of diversity is the division between those who argued that companies should concern themselves with diversity because discrimination is both legally and morally wrong, and those who argued that diversity increases organisational effectiveness and is therefore good for business (Thomas & Ely, Reference Thomas and Ely1996). Our focus is on the business case for board diversity.
A comprehensive review by Ali, Ng, and Kulik (Reference Ali, Ng and Kulik2014) summarises the arguments for and against diversity. The argument for diversity is that ‘diverse boards may improve strategic decisions, expand networks and engage talent, which may help organizations to become productive and financially successful’. The argument against diversity is based on social identity theory which postulates in-groups and out-groups create an ‘us versus them’ tension on diverse boards. Consequently, the benefits of diversity (a wider range of perspectives, improved decision-making and creativity) are less likely to materialise and dissatisfaction and conflict are likely to negatively influence the organisation's overall performance.
In Australia, the business case for board diversity is asserted by institutions such as the Australian Stock Exchange Corporate Governance Council (ASXCGC), AICD and Australian Council of Superannuation Investors (ACSI). The ASXCGC has set out eight principles with recommendations for each. Principles 1 and 2 specifically address board composition and structure. The best practice Recommendation 1.5 relates solely to gender diversity with no mention of age and ethnic diversity. The AICD has been driving the gender diversity agenda and has called for all ASX 200 companies to meet a 30% female target by the end of 2018 (AICD Media Release 9 April 2015). However, they have been silent in respect to age and ethnic diversity. ACSI (2016: 16) argues:
Companies are likely to be most successful when they harness collective intelligence and approach problems with cognitive diversity. Diversity of thought assists boards to set and challenge company strategy and to better understand the markets in which they operate.
In selecting directors, boards should consider a range of diversity factors that could add value to board decision-making by bringing different perspectives to bear, such as gender, age, education and professional experience, ethnicity and tenure. ACSI have endorsed a gender diversity target of 30% of women in board positions with ASX-listed companies, but there are no specific recommendations for the other diversity variables.
Is a diverse board a better performer?
Many factors can affect the performance of the board, for example, the directors' skills, experiences, backgrounds, connections and values. The business case links diversity directly to performance (Rhode & Packel, Reference Rhode and Packel2014). Existing studies of the relationship between board diversity and performance have used a variety of diversity factors and a range of performance measures. The variation in the definition and measures of diversity among studies, reflecting different theoretical perspectives, goes some way to explaining the inconsistency in the findings.
There is a substantial literature on how gender diversity affects performance (Ali, Ng, & Kulik, Reference Ali, Ng and Kulik2014). The most commonly used measure is the proportion of female board members. The results of these studies are inconclusive. For example, an Australian study examined gender diversity and performance measured by ROA and Tobin's Q and did not find evidence of an association between gender diversity and performance (Chapple & Humphry, Reference Chapple and Humphry2014). In contrast, a Mauritian study found a positive relationship between gender diversity and ROA (Mahadeo, Teerooven Soobaroyen, & Hanuman, Reference Mahadeo, Teerooven Soobaroyen and Hanuman2012).
Diversity also includes characteristics such as age, disability, ethnicity and religious or cultural background. In contrast to gender, some other diversity factors are more difficult to define and measure, and this may explain the focus on gender in the existing studies. For obvious reasons, in particular privacy legislation, it is far more difficult to access information in order to measure and compare age, disability, ethnicity, and religious or cultural background. Interest in age in respect of diversity on boards has been for the most part neglected.
Age is one aspect of diversity
In 2010, the European Commission in a report Corporate Governance in Financial Institutions claimed diversity broadens the debate within boards and helps to avoid the dangers of narrow ‘group think’. The report argued that increasing age diversity might improve the overall level of knowledge on the board as a consequence of the experiences that different age groups bring to the board (European Commission, 2010).
The arguments for and against promoting age diversity on boards are similar to the arguments for and against promoting gender diversity (Ferrero-Ferrero, Fernández-Izquierdo, & Muñoz-Torres, Reference Ferrero-Ferrero, Fernández-Izquierdo and Muñoz-Torres2015). A homogenous board (minimum level of diversity) is made up of individuals who are likely to share similar values. The argument is that this results in better goal congruence and communication. However, this may also encourage a lack of interest in new strategies and result in decisions based on compromise. A heterogeneous board, on the other hand, can provide a variety of skills and expertise at board level.
The AICD Governance Leadership Centre suggests that the prevailing view in financial markets is that younger directors are needed on boards (Featherstone, Reference Featherstone2018). However, the arguments for older and younger directors based on performance both have merit. The case for younger boards is that they tend to be more diverse and have a higher proportion of female directors. The assumption is that younger directors are better able to understand the technology and digital disruption. The case for older boards is that age brings experience and wisdom. Older directors have more experience, in particular in dealing with crisis situations.
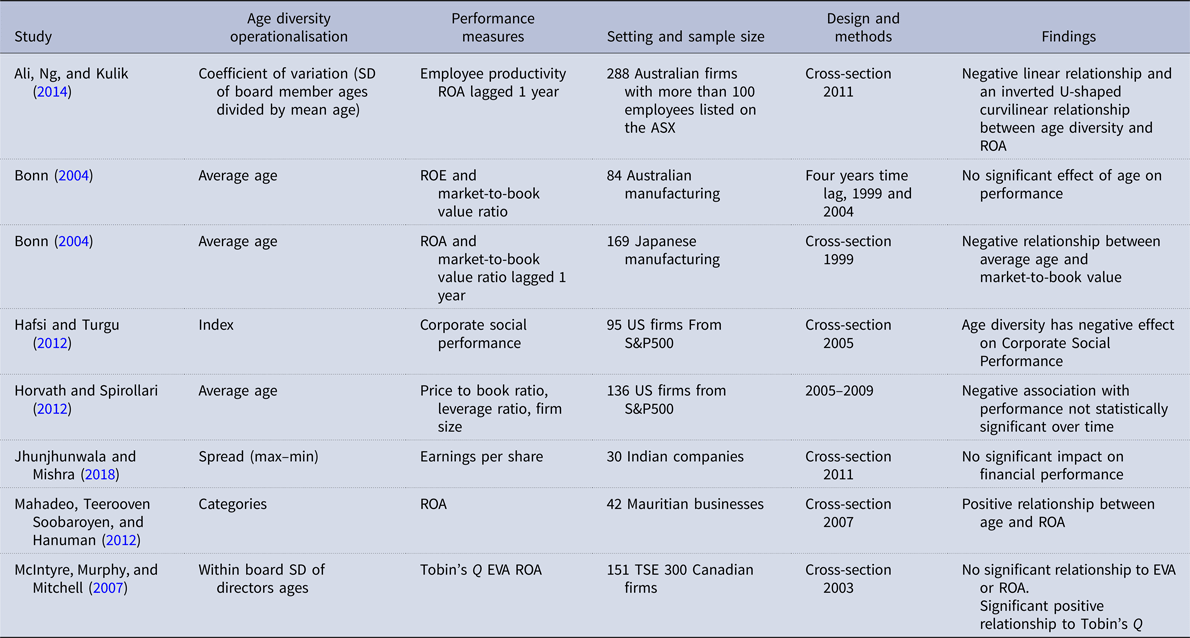
There is limited empirical research on the relationship between board age and organisational performance and there are very few recent studies. This may be explained in part by the difficulty in accessing information on the age of board members. The results from the few available studies are mixed (see Table 1). This may also be explained in part by the inconsistency in the way age diversity is measured. Diversity in respect of age is about differences in the age of directors on a particular board (age spread). Two commonly used measures of age diversity are spread (difference between the youngest and oldest director) and the standard deviation of the board membership. The associated empirical question is: Does a board with a more diverse range of ages perform better or worse than a board with a less diverse range of ages? Age can also be seen as a proxy for experience (Mahadeo, Teerooven Soobaroyen, & Hanuman, Reference Mahadeo, Teerooven Soobaroyen and Hanuman2012). Boards with a higher average age arguably have more experience than boards with a lower average age. A second empirical question is: Do older boards perform better than younger boards?
Studies of ages of board directors and firm performance

Studies of ages of board directors and firm performance
It is not always recognised in existing studies that average age (experience) and age spread (diversity) are different variables. Even if the average age of board members has a positive or negative effect on performance, this does not translate to a conclusion about the relationship between age diversity and performance. Similarly, if age diversity has a positive or negative effect on performance, this does not translate into a conclusion about the relationship between average age and performance.
In practice, in Australia at least, the default supposition is that diversity is always better than uniformity. This is reflected in the recent trend to eliminate discrimination and has resulted in anti-discrimination legislation in many jurisdictions. In the case of Australia, it is illegal to discriminate in employment (including directorships) on the basis of age. Unsurprisingly, this has led to fewer boards reporting on the age of directors.
There are no maximum age limits for directors under current Australian legislation. Until its repeal in April 2003, section 201C of the Corporations Act assumed that 72 was the natural time to retire. This did not preclude a person over 72 from acting as a company director, but imposed hurdles (annual re-appointment by special resolution) that made it more difficult for a person over 72 to be appointed to a board. The argument supporting the removal of section 201C was that age does not necessarily relate to competence and contribution. Limiting the age of directors is contrary to current equal opportunity legislation and practice (Stafford, Reference Stafford2008).
Recent surveys suggest boards are getting younger in both Australia and internationally (ACSI, 2016). This appears to be a consequence of the adoption of gender diversity targets as women board members tend to be younger than their male counterparts (Corrs Chambers Westgarth, 2015). ACSI research shows the board's average age in Australia rose steadily in the first decade in the 21st century but has declined since 2011. This coincides with the push to increase female representation on boards. In 2015, the average age of nonexecutive directors in ASX 100 companies was 61.9, the lowest since 2011. In 2015, female directors were on average 6 years younger than their male counterparts (ACSI, 2016).
Our research question is: Does the age of board directors affect firm financial performance? Our study is designed to isolate age from other measures of diversity. Our focus is on financial performance as distinct from other aspects of performance, for example, strategic measures such as reputation and corporate social responsibility. The significance of this study is the relatively large sample size (n = 130) compared to most other studies and panel data over 4 years (2011–2015).
Study Design
Sample
Our original study design was to include all firms included in the Australian Stock Exchange's All Ordinaries Index (ASX 500) in 2014. The market capitalisation of this list accounts for over three-quarters of the Australian share market. However, it quickly became apparent that most companies no longer report on the age of their directors. Therefore, our sample was reduced to all companies that reported at least some ages of board members in their Annual Reports or on their websites. As a consequence of this under-reporting of the directors' ages, our sample was 132 firms. We then researched the missing ages using the public profiles from Bloomberg and LinkedIn to complete the data set.
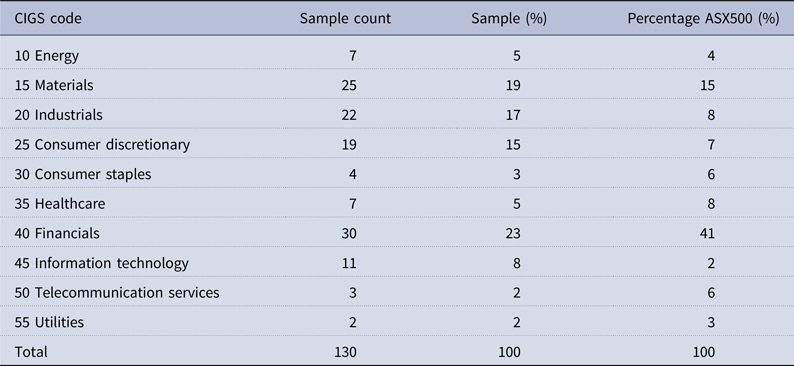
Using this sample of 132 firms, we constructed panel data for board membership from 2011 to 2015. These data included board size, gender, mean age, measures of age diversity and firm size (market capitalisation on 30 June) for each year. Due to missing data on performance indicators on two firms, the final sample is reduced to 130. Table 2 compares the profile of the sample companies to the ASX 500 (All ordinaries index). (The historical ASX 500 sector breakdown is not publicly available so the comparison is with 2016.) The firms included in the final sample represent a diverse number of industries. Nevertheless, our sample is underweighted on Financials, Consumer Staples, Telecommunications and Utilities. Our sample is overweighted on Industrials, Consumer Discretionary and Information Technology. This is not surprising given the large number of companies that do not report on directors' ages.
Sector profile of sample companies by CIGS code and ASX all ordinaries

Note: The sector profile for the ASX 500 is from 7 August to July 2016 and weighted based on market capitalisation. Historical data are not available before this date. The distribution between sectors is relatively stable over time.
Sector profile
Dependent variables
Data from 2011 to 2015 were obtained from Morningstar's database for Australian companies. The performance measures used in this study are Return on Assets (ROA) and Tobin's Q.
There is no general agreement on the theoretical definition of performance. As Richard, Devinney, Yip, and Johnson (Reference Richard, Devinney, Yip and Johnson2009) argue:
there is little agreement between researchers on either an accepted definition of performance or the appropriate structural form of the relationships between measures. This has produced wide variation in the specification of models used. (p. 738)
Economics, finance and accounting have different perspectives on performance and use different measures. As noted by Richard et al. (Reference Richard, Devinney, Yip and Johnson2009), organisational performance encompasses three specific areas of firm outcomes: (a) financial performance (profits, return on assets, return on investment); (b) product market performance (sales, market share); and (c) shareholder return (total shareholder return, economic value added). As our study is at the corporate level, we are only concerned with financial performance and shareholder returns. Therefore, the measures selected target financial and shareholder performance outcomes.
Accounting measures are the most common and readily available means of measuring organisational performance and the validity of these measures is based on the extensive evidence showing that accounting and economic returns are related (Richard et al., Reference Richard, Devinney, Yip and Johnson2009). ROA is the most frequently used measure. ROA is defined as the ratio of net operating profit to the firm's start-of-year assets, recorded on its balance sheet.
Tobin's Q is a mixed accounting/financial market measure. The advantage of this kind of measure is that it is better able to balance risk (largely ignored by accounting measures) against operational performance issues. Tobin's Q is the ratio of the market value of firm assets to their replacement cost and is a theoretically based measure of economic return (Tobin, 1969 cited in Richard et al., Reference Richard, Devinney, Yip and Johnson2009).
Independent variables
The age of board directors is an independent variable of the study. We have used different measures of age such as average age and age diversity to investigate whether an older board and a young–old mix of directors have an impact on performance. Age diversity is measured by the within-board standard deviation as this is a more sensitive indicator than a simple spread measure (max–min), as the latter does not use all the information in a distribution. Gender is also considered as an important factor associated with performance. Therefore, female participation rate on the board is another independent variable in this study.
Control variables
Consistent with past research, we selected control variables at different levels of analysis. At the board level, we controlled for board size measured by the total number of directors as listed in the Annual Report each year. At the firm level, we selected firm size as a control, as measured by market capitalisation at the beginning of the financial year. At the industry level, we controlled for industry using the GICS (Global Industry Classification Standard). All ASX listed companies are classified using the GICS of 10 sectors. We also control for year effects.
Data analysis
Our panel data from 130 firms over a span of 4 years are grouped into firms or clusters. In such data, regression errors are expected to be correlated within clusters and ignoring this within-cluster correlation can affect the precision of estimates (see Arellano, Reference Arellano1987; Cameron and Miller, Reference Cameron and Miller2015; Rogers, Reference Rogers1994). Clustered-robust standard errors are widely used to control for this within-cluster correlation. However, this alone cannot control within-cluster error correlation if there is a hierarchy in the model (see Cameron and Miller, Reference Cameron and Miller2015). In our data set, we expect that there should be an unobserved firm effect; and on top of this, there should be unobserved industry and time effects on firm performance. Moreover, a firm's performance could be influenced by some omitted factors that change over time. To address this additional error correlation, we have implemented the cluster-robust standard errors method with fixed effects. More specifically, we have firm-level clustered-robust standard errors; and time (year) and sector-level fixed effects. Hence, our model specification captures the major sources of within-group error correlation in our data set.
Results
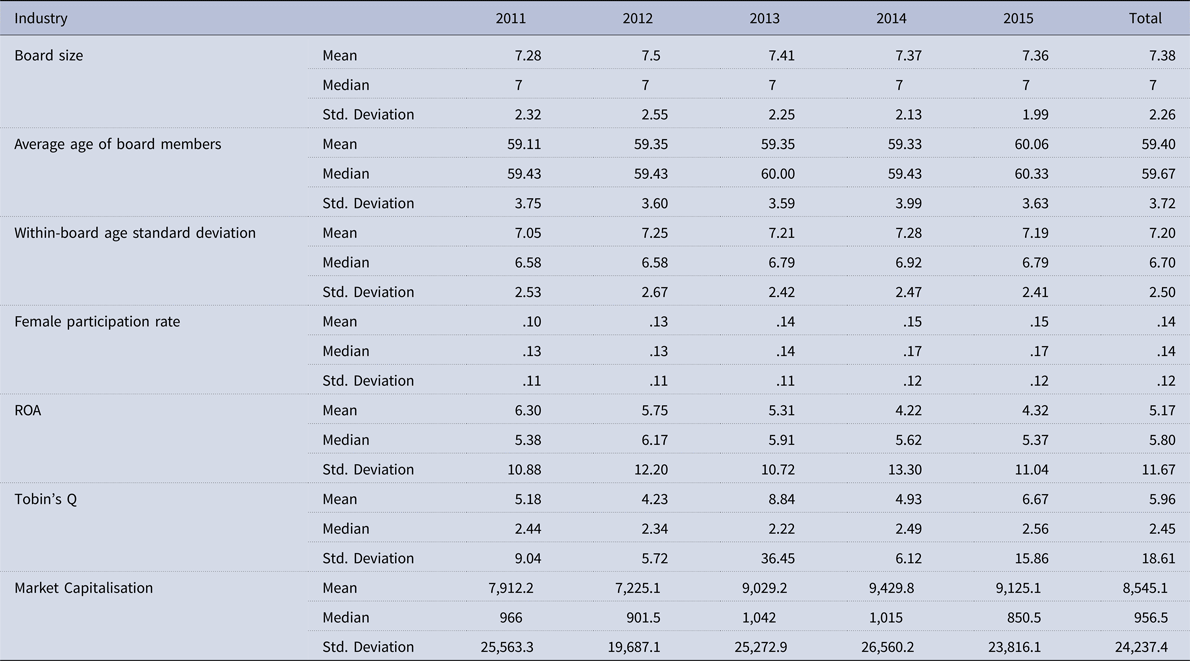
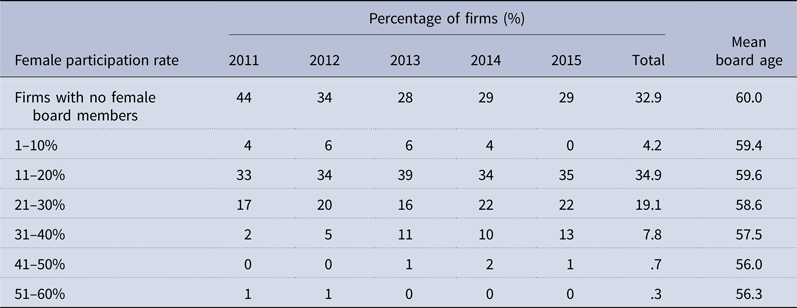
Descriptive statistics of dependent, independent and control variables are provided in Table 3. The mean board size is approximately seven members and the average age is about 59 years. The female participation rate increased from 10% in 2011 to 15% in 2105, with a pooled overall mean of 14%. Table 4 shows that the percentage of firms with no female directors has decreased from 44% in 2011 to 29% in 2015.
Descriptive statistics for key variables

Frequency distribution of the female participation rate

Descriptive statistics of key variables
Frequency distribution of female participation rate
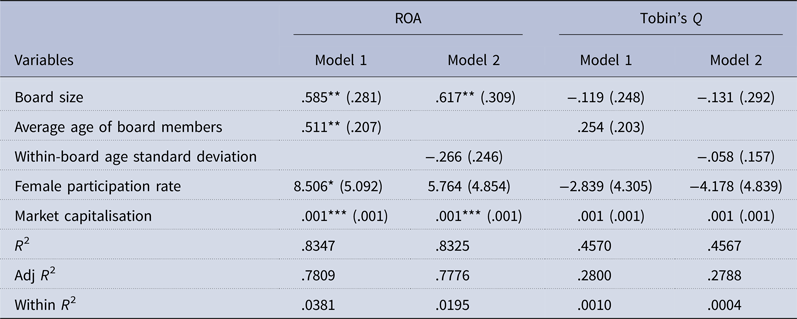
The results of regression analyses are shown in Table 5. The results reveal that the average age of the board is statistically significant for ROA at the 5% level of confidence, but not with Tobin's Q. The sign of the coefficient for age is positive, meaning that a firm with an older board tends to perform better than a firm with a younger board. Even with ROA lagged 1 year (to control for past performance), the average age effect remains positive (.69) and significant (p-value = .025).
Results of regression analyses

Note: Model 1 refers to the first regression model in which the measure of age is the average age of the board. Model 2 refers to the second regression model in which the measure of age is the spread of age measured by the standard deviation within a board.
For each variable, the coefficient estimate is provided and the robust standard error is in parentheses.
Statistical significance: *p < .1; **p < .05; ***p < .01.
Age diversity of the board (as measured by the within-board standard deviation) is not significantly associated with either performance measure. In part, this may be because of the limited variation in ages in the sample.
From Table 5, we see there is a statistically significant positive relationship between board size and ROA. ROA increases as board size gets bigger. However, the relationship is not statistically significant when the performance measure is Tobin's Q.
The association of female participation rate with ROA is statistically significant at the 10% level (p-value = .097). For robustness, we also examine the presence of nonlinear or interactive effects. No effects were found except that for average age has a curvilinear relationship with ROA performance. The squared average age coefficient is statistically significant at the 10% level (p-value is .06) with ROA and it is negative. The sign suggests that a firm will perform better as the board gets older, but the rate of performance growth will decrease over time. In terms of the controls, we find board size is positively related to ROA.
Results of regression analyses
Discussion and Conclusions
Controlling for board size, firm size and industry sector, two significant findings from this study are:
(1) average age of board members is positively associated with ROA
(2) board size is positively associated with ROA
Age and experience trumps age diversity
To our knowledge, only two previous studies have investigated the relationship between the average age of the board members and ROA and neither found a statistically significant relationship (Bonn, Reference Bonn2004; Horvath & Spirollari, Reference Horvath and Spirollari2012). We found that the average age of board members is positively associated with firm performance as measured by ROA. This relationship was statistically significant (Table 5). Boards with an older average age of directors performed better than boards with a younger average age.
In contrast, the age diversity of the board (measured by the within-board standard deviation) is not significantly associated with either performance measure. In part, this may be because of the limited variation in ages in our sample. Our finding is consistent with the results from previous studies that used spread as the measure of age diversity (Ali, Ng, & Kulik, Reference Ali, Ng and Kulik2014; Jhunjhunwala and Mishra (Reference Jhunjhunwala and Mishra2018); McIntyre, Murphy, & Mitchell, Reference McIntyre, Murphy and Mitchell2007).
The positive relationship between average age and performance suggests that average age and not age diversity is the important consideration for board composition. A simple explanation may be that the experience and wisdom that come with age are more important.
As previously discussed, the average age of nonexecutive directors declined between 2001 and 2012 (ACSI, 2016). Our findings suggest this trend may be negatively impacting on financial performance.
The pursuit of gender targets is one explanation for declining average age. The ASX Corporate Governance Principles and Recommendations may be influencing this trend. A second explanation may be the ASX recommendations concerning the independence of directors. The ASX does not specify a maximum length of board tenure. However, the principles require that after 10 years the board must annually assess whether that length of service may have compromised the director's independence. In practice, this requirement may have the effect of a term restriction and be an indirect way of imposing age limits.
Board size does matter
A 2016 international survey found Australian and New Zealand boards are smaller with 6.7 members compared to the global average of 8.5 members (Groysberg, Cheng, & Bell, Reference Groysberg, Cheng and Bell2016). The average board size in our sample of Australian Companies was slightly higher at 7.38 over the period 2011–2015 and varied between 7.28 in 2011 and 7.5 in 2012. Our study found board size is positively associated with the performance measured by ROA. Our findings are consistent with the resource dependency theory argument that larger boards increase expertise and are able to form better environmental links and secure critical resources (Pfeffer & Salancik, Reference Pfeffer and Salancik1978). This contrasts with the argument in some earlier studies that the problems of poor communication and decision-making undermine the effectiveness of large boards.
Our finding of no significant relationship between size and Tobin's Q contrasts with a study of Australian firms over 2001–2011 that found a negative relationship between board size and firm performance (as measured by lagged Tobin's Q) (Nguyen, Rahman, Tong, & Zhao, Reference Nguyen, Rahman, Tong and Zhao2016). The explanation offered for this result was that larger boards are less effective at restraining operating costs and more prone to overly generous CEO compensation. The difference in our results may be explained by a more recent timeframe (2011–2015). The previous study was based on a very large sample (1141) but may be skewed by a much larger number of smaller firms with smaller boards. In contrast, our sample is limited to the ASX 500.
Gender effect positive but weak
By international standards, Australian and New Zealand boards have a higher (23%) than average (18%) percentage of female board members (Groysberg, Cheng, & Bell, Reference Groysberg, Cheng and Bell2016). The participation of females in our sample of Australian ASX 500 Companies was lower (at 14%) over the period 2011–2015, and varied between 10% in 2011 and 15% in 2014 and 2015.
Whilst not the focus of this study, we did examine gender effects on financial performance. After controlling for age, we found a weak positive effect of gender diversity on performance measured by ROA, but this relationship was statistically significant only at the 10% level of confidence. This is consistent with the findings of a survey of Australian companies from 2004 to 2011 using the same measure of performance (ROA) (Chapple & Humphry, Reference Chapple and Humphry2014). This latter study examined the effect of multiple women on financial performance and found weak evidence of a negative correlation between boards with more than one woman and financial performance. This is consistent with our argument that increasing the number of women reduces the average age of a board and, as age is a proxy for experience, these boards will tend to produce lower financial returns.
ACSI research shows the board's average age in Australia rose steadily in the first decade in the 21st century but has declined since 2011. This coincided with the push to increase female representation on Boards. In 2015, the average age of nonexecutive directors in ASX 100 companies was 61.9, the lowest since 2011. Women Directors were on average 6 years younger than their male counterparts in 2015 (ACSI, 2016). Over the timeframe of our sample, the number of female directors was relatively low, with the mean participation rate of females 15% or less. As the number of female directors increases, the average age of a board can be expected to fall appreciably.
Average age is more important than age diversity
The board of directors is the key corporate governance mechanism and is ultimately responsible for a firm's performance. Age is an important demographic variable and hence its oversight represents a significant gap in the more recent empirical research. This gap is probably explained by the difficulty of accessing data due to the under-reporting of board directors' ages. Our findings suggest that average age is more important than age diversity. This study provides support for the business case for boards with an older average age.
The OECD (2017) identified Australia as one of six countries making the greatest progress towards gender-balanced boardrooms over the period 2013–2016, which falls within our survey (OECD, 2017). The AICD has been a strong supporter of moves to increase the number of women on boards for the past 10 years and pushed for a target of 30% by December 2018. The latest figures show that 26.7% of ASX 200 directors are women as opposed to 8.3% in 2009 (when the AICD began tracking the number of women on boards).
An unintended consequence of prioritising gender diversity
An unintended consequence of the pursuit of a gender diversity target in Australia appears to have been to lower the average age of boards. The AICD has argued the business case for diversity ‘to improve decision making, but always in the context of making appropriate appointments’ (Korporal, Reference Korporal2018). However, Elizabeth Gaines, CEO of Fortesque Metals an ASX 200 company, recently observed (Ingram, Reference Ingram2017):
The nation's determined pursuit of getting a gender balance on company boards has created a ‘vacuum’ of women in senior executive roles.
Gaines has argued the focus should be on the gap in women coming through the C-suite roles and not so much on the boardroom (McKinnon, Reference McKinnon2018). Senior executives' roles are where women can acquire the necessary experience and skills to be effective directors. The gap in women in senior executive positions has been highlighted by Chief Executive Women (CEW, 2017, 2018). Chief Executive Women started an annual census of the ASX 200 companies in 2017 and followed with a second census in 2018. The number of companies with no woman in the executive leadership team fell from 41 in 2017 to 23 in 2018. The percentage of CEO roles was 5% in 2017 and this only increased to 7% in 2018. The percentage of women in CFO roles increased from 9 to 12%. This gap appears to be an international phenomenon. According to the OECD gender equality survey, while quotas and soft targets have increased the number of women on boards in many countries, these gains have not been reflected at the senior executive level (OECD, 2017). Our findings suggest, older boards achieve better financial outcomes than younger ones and this is explained by age being a proxy for experience. More women with experience as a CFO or CEO would bring age, experience and diversity to the boardroom.
Whilst, the findings from this study are for a sample drawn from companies listed on the Australian Stock Exchange, interest in board diversity and financial performance is international. Norway was the first country to introduce mandatory quotas for women on boards in 2008. Since then a range of policies to achieve gender equality on corporate boards have been introduced in other countries in Europe, the Americas and the Asia-Pacific region.
According to a recent article in The Economist, California is the first American state to mandate gender diversity in companies at board level (The Economist, 2018). A bill approved by the state senate in 2018 requires publicly traded firms headquartered in California to have at least one woman on their boards by the end of next year. Senator Hannah-Beth Jackson, one of the proposers of the bill argued: It's not only the right thing to do. It's good for a company's bottom line. However, some business leaders are opposed and are threatening to launch an appeal against the law. Their concern is that quotas will lead to the appointment of underqualified female directors. Opponents of quotas say that this reflects the scarcity of women in upper management. A quota, they warn, would see boards being ‘stuffed with inexperienced, token women’. If we accept age as a proxy for experience, our study provides some support for this concern.
In our study, older boards achieve better financial outcomes than younger ones. The pursuit of gender diversity lowers the average age of boards and potentially takes women from executive roles before they join the C-suite. An unintended consequence of this may be a continuing pipeline of women directors lacking in senior executive experience.
In practice, what is needed is more older women on boards.
Elizabeth Prior Jonson is a senior lecturer in the Department of Management Monash University. She teaches and has published in the areas of governance and corporate social responsibility.
Linda McGuire is a senior lecturer in the Department of Management. She teaches and researches in the areas of services management and strategic management at Monash Business School.
Sharif Rasel received his PhD from Monash University in August 2017 and is a scholarly teaching fellow in the Department of Management at Monash University. He teaches international business at Monash Business School.
Brian Cooper is an associate professor in the Department of Management at Monash University. He has published widely and teaches quantitative research methods at Monash Business School.