


Introduction
During the past two decades, there has been increasing recognition of the influence of the hydrology of glaciers and larger ice masses on their dynamics (e.g. Reference IkenIken, 1981; Reference Iken and BindschadlerIken and Bindschadler, 1986). Studies of temperate glacier flow have identified changing subglacial water pressures as a key influence on velocity fluctuations on a variety of time-scales (Reference Iken, Rothlisberger, Flotron and HaeberliIken and others, 1983; Reference KambKamb, 1987; Reference WillisWillis, 1995). Subglacial water pressure depends upon the meltwater flux, the ice- mass geometry (which controls the hydraulic gradient and the tendency for ice flow to close down drainage pathways), the structure of the drainage system, and the hydraulic geometry, sinuosity and boundary roughness of the major drainage route ways (Reference SharpSharp, 1991). Observations on polythermal glaciers, glaciers with a central core of temperate ice at the bed surrounded by cold ice at the surface, margins and glacier terminus (Reference BlatterBlatter, 1987), have also shown seasonal velocity variations which have been attributed to changes in subglacial water pressure (Reference Müller and IkenMüller and Iken, 1973; Reference AndreasenAndreasen, 1985; Reference Rabus and EchelmeyerRabus and Echelmeyer, 1997). However, there is limited understanding of the drainage-system properties of polythermal glaciers and of the hydrological changes that might be responsible for variations in water pressure within them. This paper uses observations of meltwater runoff and hydrochemistry to investigate the drainage-system behaviour of a polythermal glacier over two summer melt seasons.
Field Site
John Evans Glacier is a large valley glacier located at 79°40' N, 74°00' W on eastern Ellesmere Island, Nunavut, Canada. The main arm of the glacier occupies the western part of a 220 km2 catchment, and spans an elevation range from 100-1500 m (Fig. 1a). The glacier is underlain by an Ordovician-Silurian carbonate-evaporite sequence with a minor clastic component (Reference KerrKerr, 1972). The mean annual air temperature at a meteorological station located on the glacier snout (Fig. 1a) is -14.7°C and the long-term mean equilibrium-line altitude is ~750 m (personal communication from A. Arendt, 1998). In the terminus region, below an elevation of 250 m, ice depths are < 150 m and radio-echo sounding reveals a widespread internal reflector located ~20 m above the bed. This is interpreted to represent the boundary between cold and temperate ice and to indicate that the glacier is polythermal (personal communication from L. Copland, 1998). At the glacier terminus and margins, the ice is believed to be cold- based and the glacier is frozen to its bed. Meltwater runoff from the glacier occurs primarily via two ice-marginal streams and another stream which appears to be sub- glacially fed (Fig. 1b). The catchments drained by each of these streams are demarcated on Figure 1a. The subglacial stream is believed to be fed by runoff from the central basin, which enters the glacier in a major crevasse field about 4 km from the snout. In addition to these major streams, five other streams were investigated (Fig. 1b). These are referred to as the supraglacial, proglacial, upwelling, fountain and east subglacial streams. The proglacial area is covered with a layer of unconsolidated sediments at least 4 m thick, dissected by a large braided channel network.
(a) John Evans Glacier. Areas of the west-marginal and central basins are outlined, (b) Configuration of the out flowing streams at the glacier terminus. Areas of subglacial water outflow are shaded dark grey and subglacially fed streams are represented by dashed lines. Inset: location of John Evans Glacier.

Methods
Fieldwork was conducted from 15 June to 7 August 1994 (Julian days (JD) 166-219) and 24 June to 18 July 1996 (JD 176–199). In both years, subglacial stream discharges were measured on a daily basis using the velocity—area method (Reference Gardiner and DackombeGardiner and Dackcombe, 1983). At discharges > 10 m3 s—1, velocity-profile measurement was impossible and discharge was estimated from observations of the channel width, depth and surface-water velocity using the velocity—area method.
In both years, water-chemistry measurements were made on samples from seven meltwater streams. Samples were collected at least once a day from the supraglacial and westmarginal streams, and for parts of each season from the proglacial, upwelling, fountain, east-marginal and subglacial streams. A 500 mL aliquot of water was vacuum filtered through a 0.45 µm cellulose nitrate membrane. Two 20 mL samples were retained for laboratory analysis of major anion and cation concentrations by ion chromatography, and a 100 mL sample was taken for analysis of total alkalinity. Total alkalinity (primarily bicarbonate, HCO3 —) was determined in the field within 24 hours of sampling by titration using a Hach digital titrator. In 1994, the titration endpoint was determined using a Ross Sure-flow electrode, connected to an Orion 290 A pH meter. In 1996, the endpoint was determined colourimetrically. The major cation and anion concentrations were measured using a Dionex DX 500 ion chromatograph. Anion concentrations (chloride, Cl— ; nitrate, NO3 — ; sulphate, SO4 2–) were determined using a Dionex Ionpac AS4 column and 1.7 mM sodium carbonate/ 1.8 mM sodium bicarbonate eluent. Cation concentrations (sodium, Na+; potassium, K+; magnesium, Mg2+; calcium, Ca2+) were determined using a Dionex Ionpac CS12 column and 20 mM methanesulphonic acid eluent. The component of the ionic species Ca2+, Mg2+, Na+, K+, SO4 2-, HCO3 —, derived from sea-salt aerosol, was calculated using standard sea-water ratios of these species relative to Cl— (Reference HollandHolland, 1978) and subtracted from the total, yielding an estimate of the concentration of each species derived from crustal sources. Silica (Si) concentrations were determined by flow-injection analysis, using a F1Astar 5010 system, consisting of a F1Astar 5023 spectrophotometer, V100 injector and Chemifold III. Samples were injected into a stream of ammonium molybdate, oxalic acid and acidified stannous chloride. The amount of molybdate reactive Si was determined spectrophoto- metrically at a wavelength of 695 nm.
Air temperatures were measured using a Campbell Scientific 107B thermistor at a meteorological station in the terminus region (see Fig. 1a for locations). Measurements were made every 10 seconds and 30 minute averages were stored on a Campbell CR10 data logger. Cumulative positive degree-days (PDD) were calculated by summing mean daily air temperatures (where positive). For comparison with 1996 measurements, air temperatures measured at an elevation of 50 m in 1994 were corrected to an elevation of 250 m using a measured lapse rate of 0.06°C/100 m (Reference ArendtArendt, 1997).
Results
Evidence for subglacial drainage
Firm evidence for the occurrence of subglacial drainage at John Evans Glacier is provided by observations of meltwater chemistry made in both 1994 and 1996. In both years, turbid water with a distinctive chemical composition emerged from the glacier at three discrete locations (Fig. 1b; Table 1): (1) by an artesian fountain 1–2 m high, located on the glacier surface about 200 m from the terminus, where ice was ~30 m thick (the “fountain” stream); (2) by upwelling through proglacial sediments over an area ~30 m wide immediately in front of the glacier terminus (the “upwelling” stream) and (3) as a channelized flow located at the ice—bed interface (the “subglacial” stream). (~1500 µeq L—1 ; Table 1), and (2) the higher concentrations of ionic species (Na+, K+ and Si) that are products of silicate mineral weathering. This implies that the turbid waters were routed subglacially, which is consistent with observations on the pattern of water outflow.
Average chemical composition of the eight streams studied. All concentrations are in ieq L— 1 except Si (µmol L—1:). Concentrations of Ca2+, Mg2+, Na+, K+, SO4 2-, HCO3 —, and SO4 2– have been corrected for atmospheric input and therefore reflect solute input from crustal sources, n indicates the number of measurements for a particular stream.
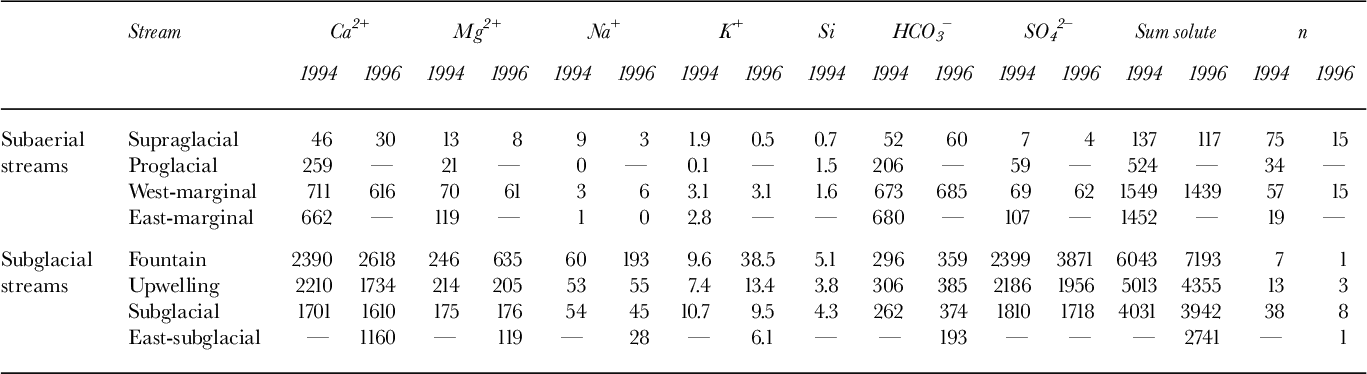
The chemistry of these turbid waters indicates they had much greater water—rock contact times than did waters in the four subaerial streams (supraglacial, proglacial, west- and east-marginal streams). This is indicated by: (1) the higher total solute concentrations in the subglacial streams (~4000–5000 µeqL—1)than in the subaerial streams
The water chemistry indicates a common source for the fountain, upwelling and subglacial streams, that is different from the source of the subaerial stream waters (Table 1). Subglacial waters are dominated by Ca2+ and SO4 2–, while the subaerial waters contain predominantly Ca2+ and HCO3 — . This suggests that the majority of solute in the subglacial and subaerial streams is derived from the dissolution of gypsum/ anhydrite and calcite, respectively. The elevated concentrations of Mg2+, Na+, K+ and Si in the subglacial waters indicate that there is enhanced weathering of minerals with relatively slow dissolution kinetics (dolomite and silicate minerals, such as muscovite) in the subglacial environment. Since the kinetics of gypsum/anhydrite dissolution are more rapid than those of calcite dissolution, it is the enhanced weathering of silicate minerals that indicates longer residence times for the subglacial waters. However, the high SO4 2– concentrations (at least 20 times subaerial values) are unique to subglacial waters. This is probably due to differences in the lithologies available for weathering in the subglacial and subaerial environments.
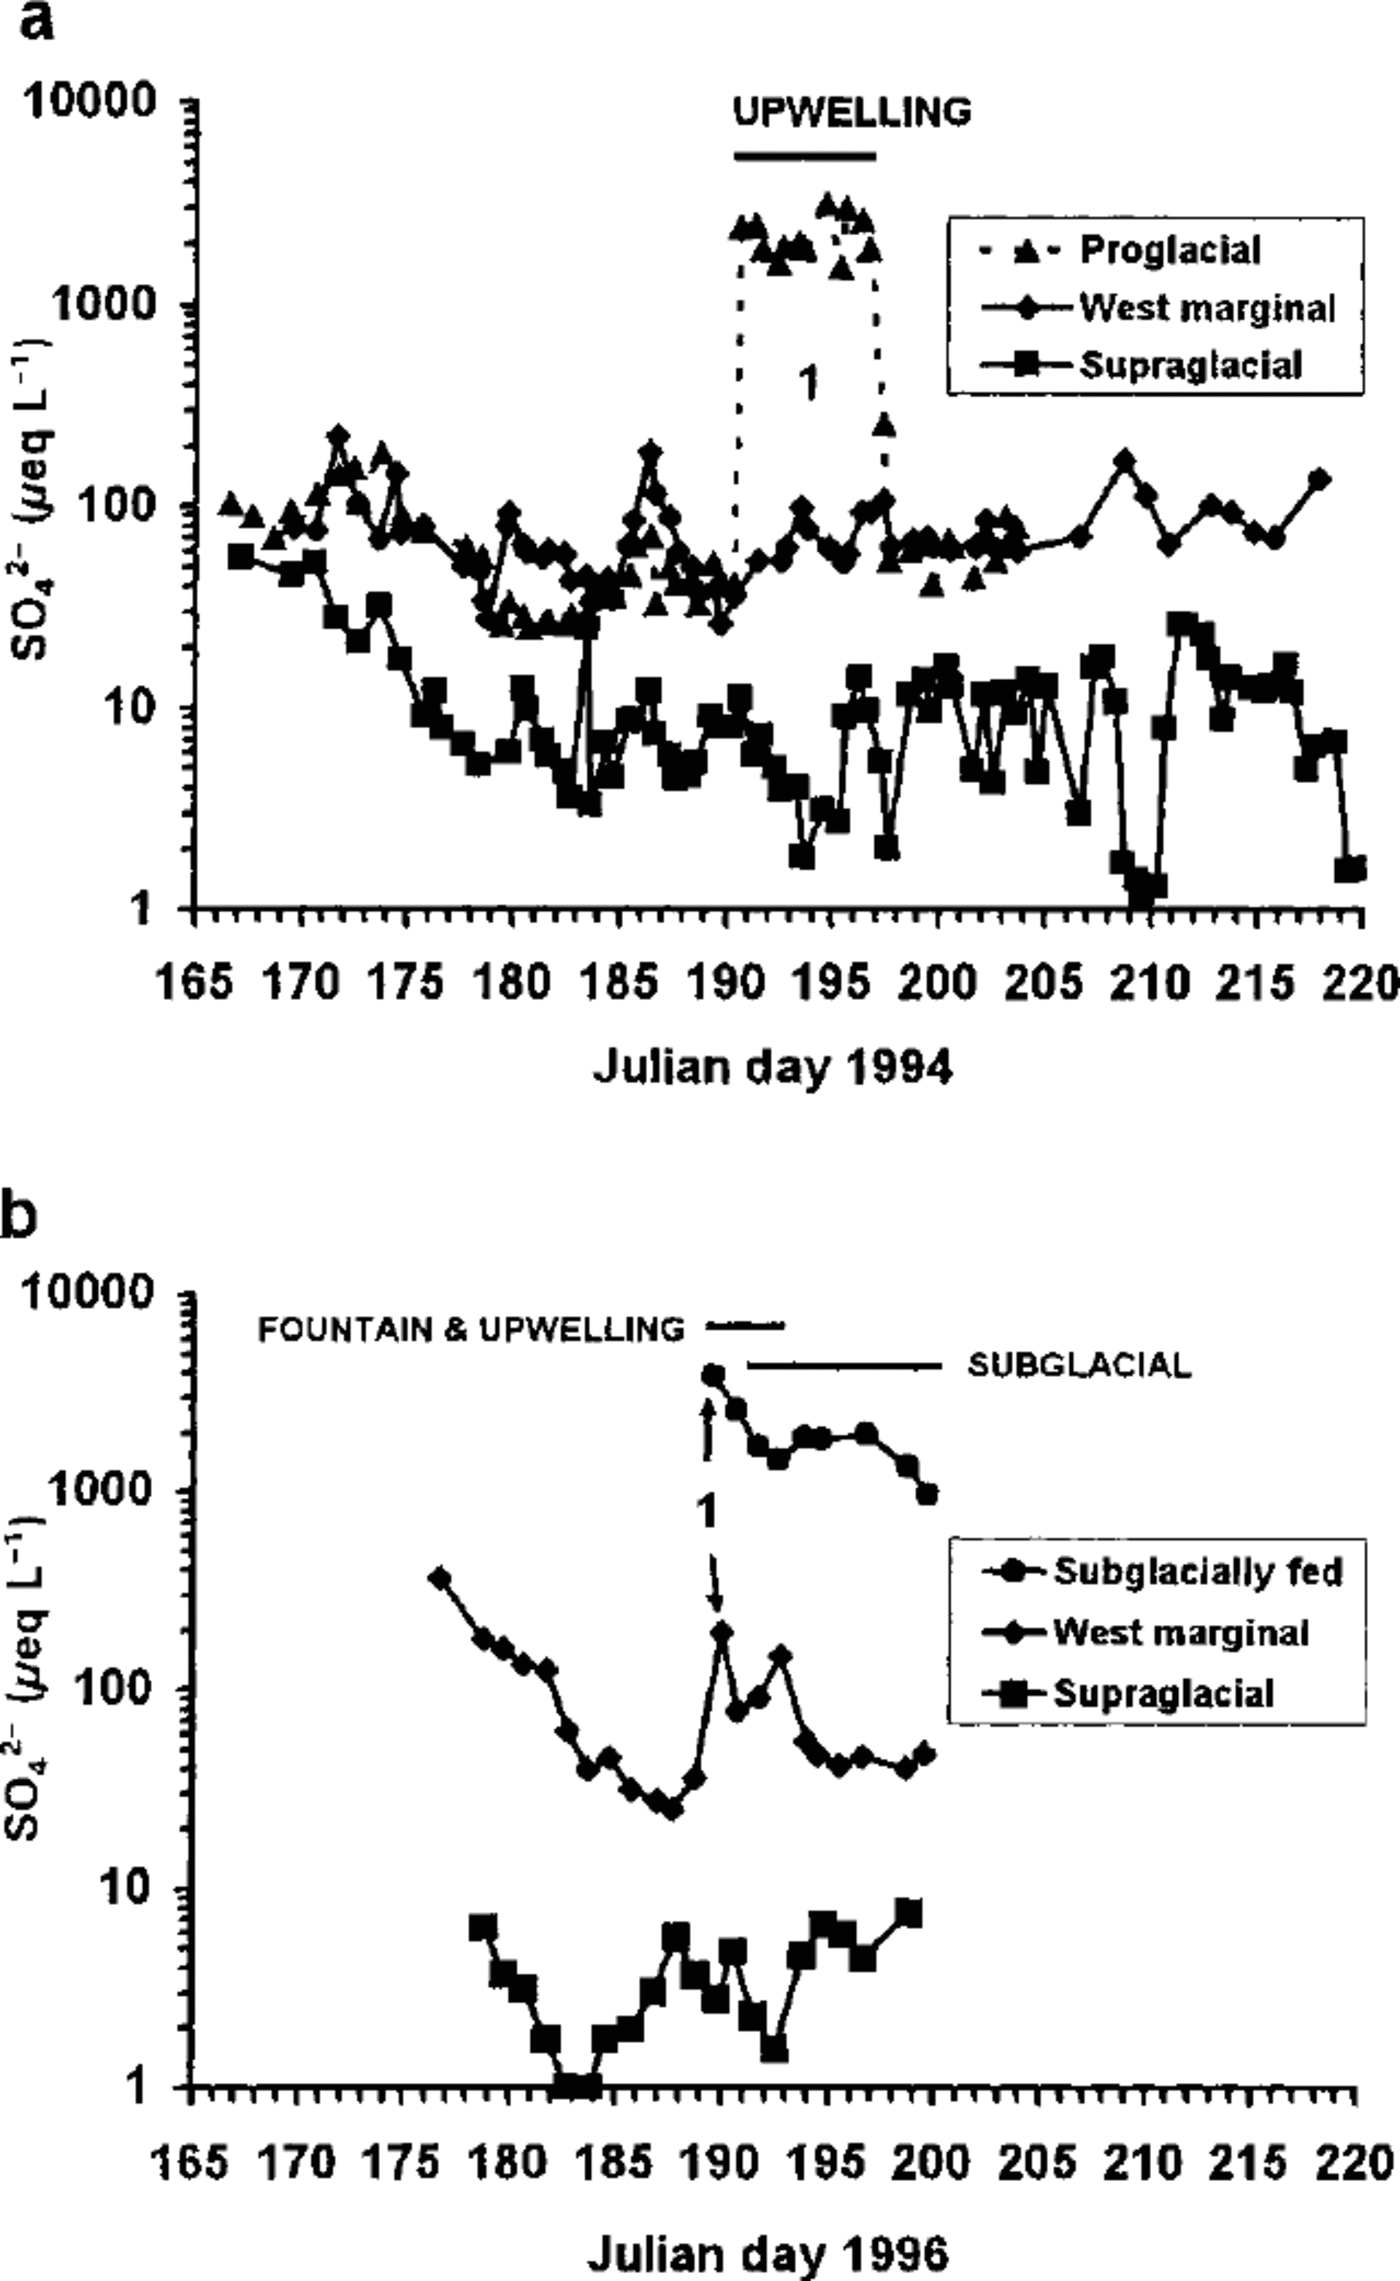
The SO4 2– concentration therefore acts as a tracer for subglacially routed waters. In 1994, the SO4 2– concentration in the proglacial stream increased markedly onJD191 (10 July) (Fig. 2a). This reflects the input of upwelling waters of subglacial origin. The SO4 2– concentration remained high throughout the period of upwelling input (JD 191-196) and returned to previous levels when this input ceased. Neither the west-marginal nor supraglacial streams showed any significant change in SO4 concentrations during this period. In 1996, however, elevated SO4 levels were recorded in the west-marginal stream when subglacial drainage via the fountain and upwelling streams was initiated (JD 189) (Fig. 2b). SO4 2– concentrations remained higher than the background for the next three days, suggesting that there was input of subglacial waters into the marginal stream throughout that period. Thus, the SO4 2– data provide evidence for a link between the subglacial reservoir and west- marginal streams in 1996 which was not evident in 1994.
(a) SO4 2– concentrations in the supraglacial, proglacial and west-marginal streams, 1994; (b) S04 2 concentrations in the supraglacial, west-marginal and subglacial streams, 1996. Length of the horizontal bar represents the duration of out flow from each outlet. Drainage event 1 is also noted.
Release of subglacial water
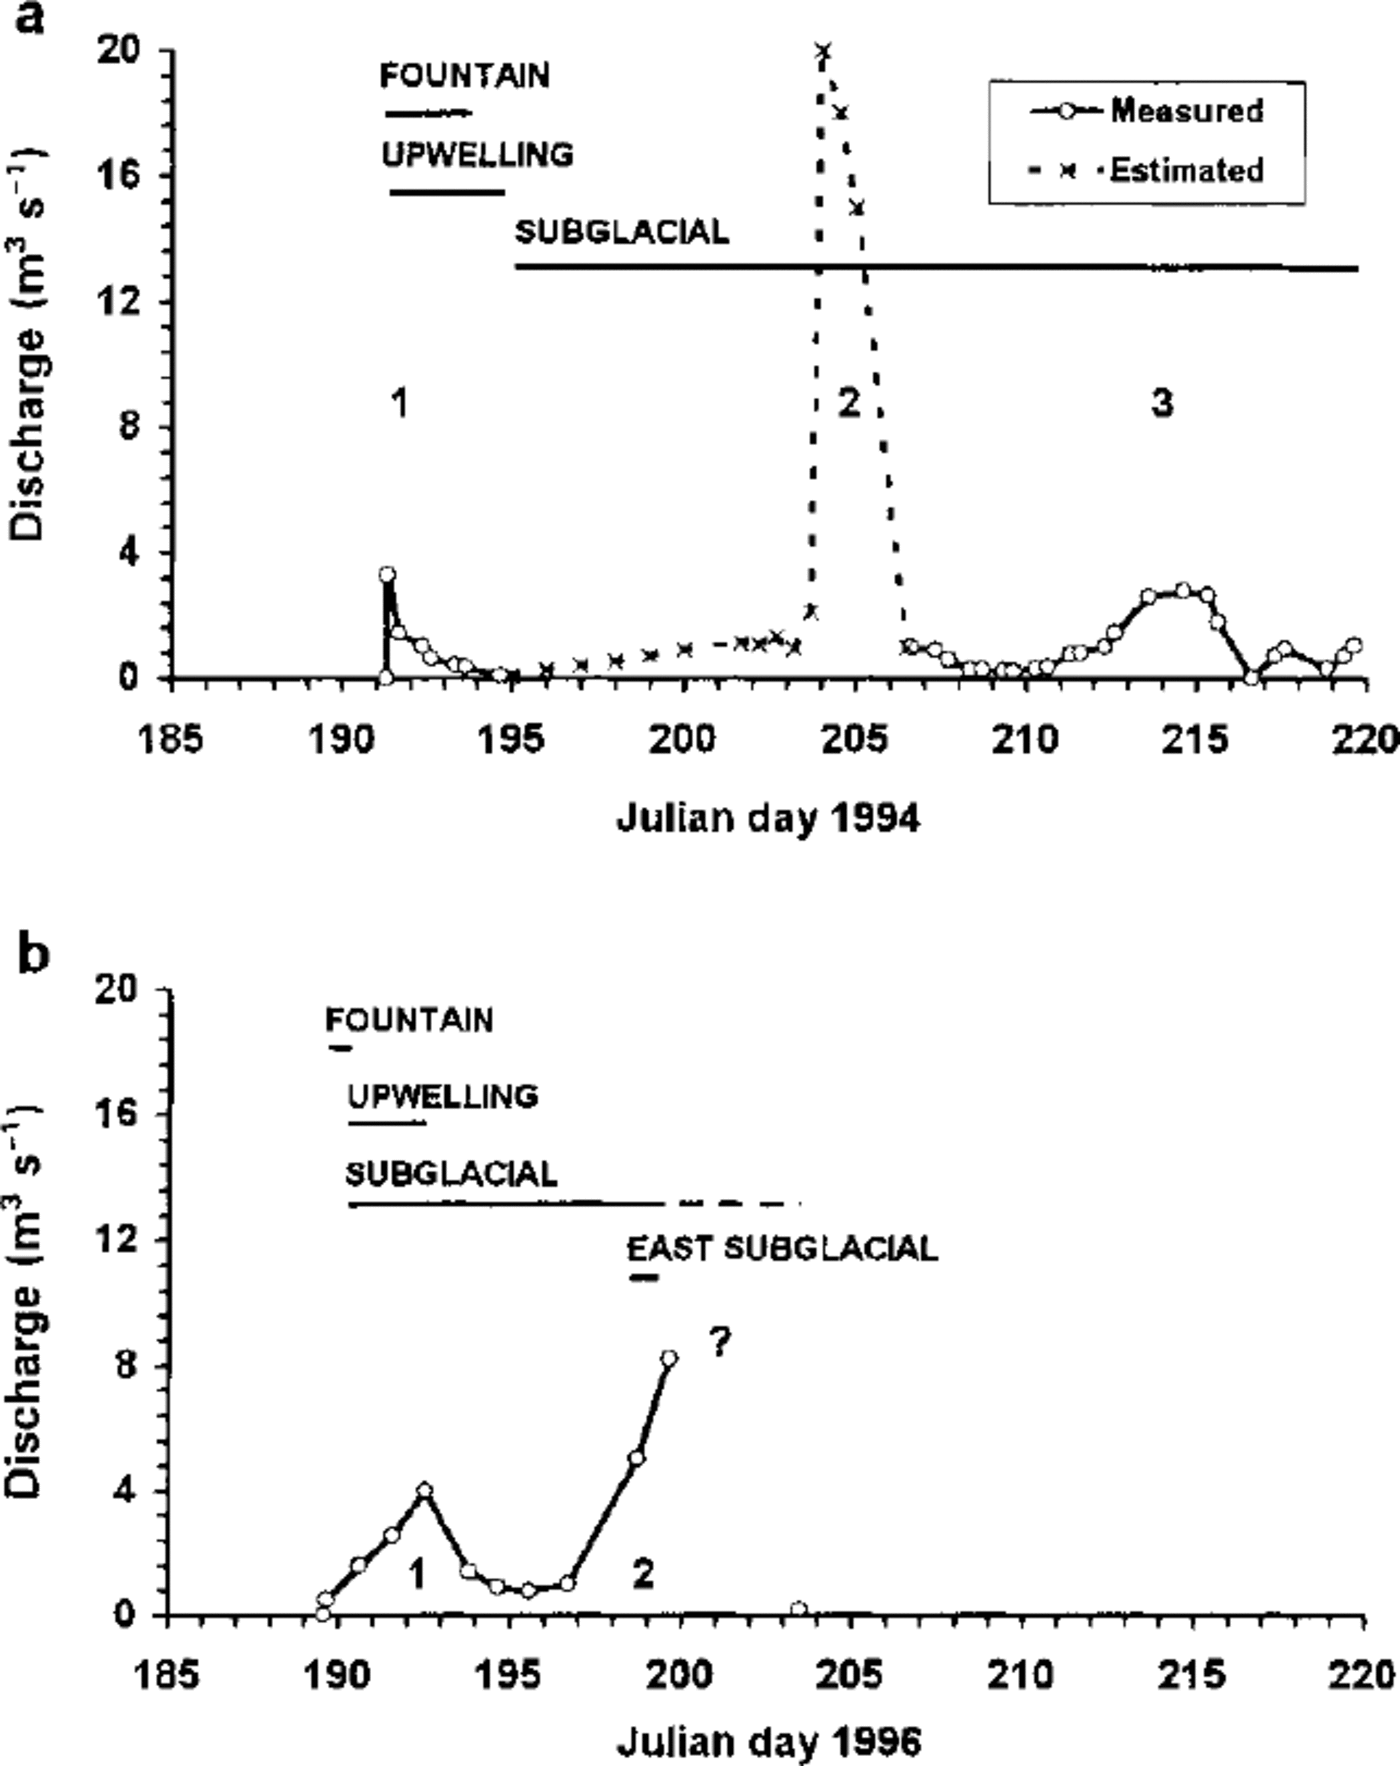
In both melt seasons, outflow of subglacially routed waters was concentrated in a series of events (Fig. 3). Three subglacial discharge events were observed in 1994 and two in 1996 (Fig. 3; Table 2). The style of water outflow in events 1 and 2 was broadly similar in both years. In event 1, the initial release of water occurred via an artesian fountain on the glacier surface, followed within 12-24 hours by the upwelling of waters from beneath the frozen toe of the glacier. Longitudinal fracturing of the glacier surface in the vicinity of the fountain occurred at the time of flow initiation and audible fracturing of the ice preceded the onset of upwelling, especially close to the outflow location. Discharge was larger in event 2 than in event 1 and the outflow was channelized (the subglacial stream).
Discharge hydrographs for subglacially routed waters (a) 1994 and (b) 1996. Length of the horizontal bar indicates the period of discharge from each outlet (the dashed bar (on b) is extrapolated from known data points). Drainage events 1, 2 and 3 are noted on the figures.
Comparison of characteristics of drainage events in 1994 and 1996.

Despite these similarities, however, there were some differences in the outburst location(s) from 1994-96 (Table 2). In 1994, the location of water outflow switched between events 1 and 2. In event 1 (1994), discharge occurred only via the fountain and upwelling streams, while in event 2, discharge was via the subglacial stream (Table 2). In 1996, however, the fountain, upwelling and subglacial streams were all operative during event 1, and there was leakage of subglacial waters into the west-marginal stream (Figs 2b and 3b). In event 2 (1994), four subsidiary channels opened up at the ice-bed interface to the west of the subglacial stream (Fig. 1b). Those located furthest from the subglacial stream were broad and flat in cross-section (slot-like conduits with a width: height ratio of 10: 1), while those nearer the subglacial stream were semi-cylindrical in form. No subsidiary channels were observed in this location in 1996, but there was a small discharge of subglacial water in a single channel located towards the eastern edge of the glacier terminus (the east subglacial stream, Fig. 1b). In event 3 (1994), only the subglacial stream was active.
Subglacial outflow hydrographs
Subglacial discharge hydrographs at John Evans Glacier display two characteristic shapes. The hydrographs of events 1 and 2 (1994) were both positively skewed (Fig. 3a; Table 2), while those of event 3 (1994), event 1 and probably event 2 (1996) were negatively skewed. (Fig. 3a and b; Table 2). There is some uncertainty about the shape of the hydrograph in event 2 (1996). The 1996 discharge record ends abruptly due to heavy snowfall on JD 200, which was followed by a period of sub-zero temperatures. Although the shape of the hydrograph from JD 200-203 is unknown, subglacial discharge had dropped to about 0.2 m s by JD 203. Since the rising limb of this hydrograph lasted at least three days, it seems most likely that it was negatively skewed.
These hydrograph shapes reflect the mode of flow initiation in each event. The positively skewed hydrographs resemble those associated with “sudden outburst-break” type floods resulting from water-pocket ruptures on Alpine glaciers (Reference HaeberliHaeberli, 1983). However, the duration of the John Evans Glacier events was 2-6 days, compared with minutes to a few hours for the events described by Haeberli. The sudden onset of drainage and associated fracturing of the glacier suggest that the connection between the subglacial reservoir and the atmosphere was established rapidly by rupture of the cold-ice barrier at the glacier terminus. In contrast, the gradual rise to peak flows in the negatively skewed hydrographs implies either that the connection between the reservoir and the atmosphere was opened gradually, perhaps by melting, or that outflow during these events was not restricted by a barrier at the glacier terminus and simply reflects the discharge response to increasing inputs of water from the glacier surface.
Subglacial outflow effectively ceased after events 1 and 2 (1994), although surface melt continued. This suggests that the drainage outlets closed down after each outflow event. The switch in outflow location between events 1 and 2 was probably a consequence of closure of the outlets used during event 1. In 1996, however, the subglacial stream continued to flow between events 1 and 2, suggesting that a more permanent connection was established between the subglacial reservoir and the atmosphere in event 1 (1996) than was ever established in 1994.
Evidence for subglacial water storage
Meltwater input into the subglacial drainage reservoir was likely via a large crevasse field at an elevation of about 500 m (Fig. 1a). Two large supraglacial streams are known to sink into the glacier in this region. Hence, the meltwater supply to the subglacial reservoir was controlled predominantly by the rate of surface melt in the catchment draining into the crevasse field. The diurnal cycle of melt input to the subglacial system was not apparent in the discharge hydrographs. This implies that outflow occurred from a subglacial reservoir with sufficient storage capacity to damp out the daily input cycle.
Further evidence for subglacial water storage comes from a comparison of air temperature records and hydrograph characteristics. Cumulative positive degree-days (ΣPDD) were used as an index of melt energy supplied to the glacier prior to the drainage events in each season (Table 2). The melt season was much longer in 1994 than in 1996. A total of 201.5 ΣPDD was recorded up to JD 219 1994 (when melt was still occurring at the end of fieldwork), compared to a total of 91 ΣPDD prior to JD 200 in 1996 (when the melt season ended). When comparing the degree-day totals for each year, it is important to note that the snow pack was ~1.5 times thicker in 1996 than in 1994. This delayed the onset of runoff at the terminus until JD175 in 1996, compared toJD166 in 1994. At higher elevations, the transition from snow to ice on the glacier surface was also delayed by at least 10-14 days in 1996 relative to 1994. Hence, for a given positive degree- day total, runoff would have been greater in 1994 because: (a) low-albedo ice surfaces were exposed earlier in 1994 than in 1996 (melt rates at John Evans Glacier are ~4mmw.e. PDD—1 for snow surfaces, compared to ~7 mmw.e. PDD—1 for ice surfaces (Reference ArendtArendt, 1997)); and (b) the proportion of snowmelt refrozen as superimposed ice was probably lower in 1994 than in 1996.
The ΣPDD prior to event 1 was 1.5 times higher in 1994 than in 1996, but the amount of water released in event 1 was similar in the two years (Table 2; Fig. 3a and b). The spacing of events 1 and 2 was 14 days in 1994 and eight days in 1996, and ΣPDD for these periods was 62 and 34% respectively of ΣPDD prior to event1. However, 2-10 times more water was released in event 2 than in event 1. There are three possible explanations for this: (a) increased exposure of low- albedo ice surfaces resulted in greater total melt input per PDD later in each melt season; (b) the proportion of surface melt converted to superimposed ice within the catchment feeding the subglacial reservoir decreased as the melt season progressed, hence supraglacial runoff (input) increased; and (c) some of the water released in event 2 was stored in the glacier prior to event 1. Given the observed ΣPDD and melting degree-day factors cited above, the “albedo effect” (a) is insufficient to account for the increases in discharge observed between events 1 and 2. This suggests that either liquid-water storage or the cessation of superimposed-ice formation are the main causes of the discharge increase in event 2. Liquid-water storage within the glacier is consistent with the suggestion that, in 1994 at least, the outlet channels closed down between events 1 and 2.
Synthesis
The 1994 melt season was significantly warmer and longer than the 1996 season and, therefore, more meltwater was supplied to the subglacial reservoir. Prior to the initiation of subglacial drainage, the subglacial reservoir was almost certainly larger in 1994 than 1996. Artesian outflow continued for longer in 1994 than in 1996 (four days compared to one day) and fracturing played an important role in opening drainage outlets. This suggests that subglacial water pressures were sustained at higher levels for longer periods in 1994 than in 1996. It thus seems likely that in 1994, outlets could not develop rapidly enough to drain increasing melt- water inputs to the subglacial reservoir. Water pressures increased to levels at which pressure-induced uplift and hydrofracturing became important processes of outlet creation. This explains the sudden onset of events 1 and 2 in 1994. Closure of the outlets used in event 1 prior to event 2, and switching of outlet locations in event 2 may simply have resulted from settlement of the glacier onto its bed after subglacial water pressures were reduced by event 1. In 1996, the onset of events 1 and 2 was more gradual and the subglacial stream continued to flow between the two events. This suggests that when the reservoir filled more slowly, slower processes, such as ice melt, were able to create drainage outlets before high subglacial water pressures developed. As a result, pressure-induced uplift and hydrofracturing played a less significant role in developing connections between the reservoir and the atmosphere, and connections did not close so abruptly when drainage occurred.
Discussion
Implications for subglacial hydrology
The subglacial hydrological system beneath John Evans Glacier is clearly very different from systems underlying Alpine glaciers. Subglacial outflow is initiated each year by an outburst event which occurs at least two weeks after the onset of the melt season, and releases subglacial waters which have been stored at the bed for an extended time period (up to two weeks). This suggests that at the start of the melt season subglacial outflow is impeded, probably by the cold-ice barrier and frozen sediments at the glacier margin. Once initiated, however, the pattern of subglacial outflow bears a qualitative resemblance to the unstable spiral regime of water flow modelled by Reference Szilder, Lozowski and SharpSzilder and others (1997) in a stability analysis of glacier lake drainage. In this flow regime, discharge oscillations of increasing amplitude occur over time, eventually leading to complete lake drainage. As at John Evans Glacier, increases in the reservoir volume prior to drainage were associated with: (1) an increase in the temporal spacing of drainage events; (2) more rapid rates of increase in discharge during drainage events; and (3) greater discharge volumes. It should, however, be noted that there are significant differences between the situation at John Evans Glacier and that treated in the model. The model deals with the consequences of perturbations to an equilibrium system consisting of an ice-marginal lake with an existing subglacial outflow. At John Evans Glacier, however, the reservoir is subglacial and initially has no outlet. The outlet appears to develop relatively rapidly once water pressures within the reservoir exceed some threshold value. In the model, the mechanics of outlet growth and closure through wall melting and ice deformation determine the rate of water release and the overall hydrograph shape. The similarities between the observed and modeled behaviour are sufficient to suggest that once the outlet has been established at John Evans Glacier, the mechanics that control the size of the outlet connecting the subglacial reservoir to the proglacial environment determine the pattern of outflow.
Interannual variations in subglacial drainage- system behavior
A number of observations suggest that subglacial drainage is an annual occurrence at John Evans Glacier. Aerial photographs taken on 5 August 1959, show a highly turbid stream issuing from the glacier at the same location where the subglacial stream was observed in 1994, 1996 and 1998. Photographs of the glacier snout taken on 17 July 1995 by R. Smith show channelized flow of turbid waters in this same location. These photographs also show a large artesian fountain emerging from the glacier about 400 m east of the location of the fountain in 1994 and 1996. The artesian fountain formed in a similar easterly location in 1998. Geyser-like waterspouts were also observed in July 1991 (personal communication from G. Henry, 1994). These observations suggest the location of channelized subglacial outflow is the same every year, while that of the artesian fountain is more variable.
Comparison to other studies
It is believed that this study is the first to document a cyclical pattern of subglacial water release from a polythermal glacier. However, a number of observations suggest that similar behaviour may occur elsewhere. Indirect evidence for a supra- glacially fed subglacial drainage system beneath a High- Arctic glacier was presented by Reference Müller and IkenMüller and Iken (1973), who observed increased ice-flow velocities in the ablation zone of White Glacier, Axel Heiberg Island, Canada, in summer. Reference IkenIken (1972) argued that meltwater flowing into moulins penetrated to the bed and spread out over an area large enough to affect the basal velocity. Subsequent studies by Reference BlatterBlatter (1987) and Reference Blatter and HutterBlatter and Hutter (1991) showed that White Glacier had a polythermal regime, with a central core of temperate ice at the bed surrounded by cold ice at the surface, margins and glacier terminus. Although meltwater reaching the bed of a polythermal glacier must initially be restricted to the zone of basal ice at the pressure-melting point, it must breach the cold-ice barrier at the terminus and margins to exit the glacier. Discharge of turbid water was observed from both the eastern and western margins of White Glacier, but not from the glacier terminus (Reference IkenIken, 1974). This suggests that the barrier of cold ice at the snout of White Glacier is more effective in preventing the drainage of such waters than those at its margins. Reference AndreasenAndreasen (1985) also noted increases in summer ice velocities at Kitdlerssuaq Glacier in West Greenland in 1982 and 1983. He attributed these to increased basal sliding resulting from subglacial water storage. Andreasen also described outbursts of turbid (presumably subglacial) water on 7 July 1982 and 23 July 1983, but did not discuss the nature of these outburst events or their effect on stream discharge.
Conclusions
Subglacial outflow of supraglacially derived meltwaters is an annual occurrence at polythermal John Evans Glacier. The initiation of subglacial outflow is lagged by as much as two weeks relative to the onset of the summer melt season, probably because outflow is initially impeded by ice at the glacier margin which is frozen to the bed. Prior to the initiation of subglacial outflow, a reservoir develops at the glacier bed. Water pressures in this reservoir may exceed the ice overburden pressure, especially in “warm” summers when the reservoir fills relatively rapidly. Drainage from the reservoir occurs in a series of outflow events, the characteristics of which seem to be controlled more by the mechanics of outlet creation and closure than by the temporal pattern of water input to the reservoir. The first outflow event in each year occurs via an artesian fountain at the glacier surface, and by upwelling through sediments at the glacier margin. The second event is usually larger than the first and occurs via a subglacial channel, which may develop at a different location to the initial upwelling. The location of the channel is constant from year-to-year, while that of the artesian fountain is more variable. The hydrograph shapes, discharge volumes and temporal separation of outflow events vary from year- to-year in response to changes in the rate of reservoir filling. Warmer years, which result in more rapid filling, are associated with larger discharge volumes, more widely spaced outflow events and positively skewed hydrographs. Hydro- fracturing and water-pressure induced ice—bed separation play an important role in the creation of drainage outlets in such years, whereas processes such as melt enlargement of drainage channels may be more important in cooler years. In warmer years, subglacial drainage may shut down completely between outflow events, probably because the glacier settles back on its bed and seals of fthe drainage outlets when water pressure is reduced by outflow. In cooler years, however, subglacial drainage continues at a reduced rate between outflow events. There is evidence to suggest that this type of drainage-system behaviour may occur at other poly- thermal glaciers.
Acknowledgements
J. Barker, R. Young, A. Arendt and J. Woodward provided field assistance. J. Mills performed the Si analyses. Financial support to M. L. S. was provided in part by a Ministry of Advanced Education Award from the Government of Alberta. Field research was supported by grants to M. L. S. from the Canadian Circumpolar Institute and the Geological Society of America and by grants to M. J. S. from the Natural Sciences and Engineering Research Council of Canada and the University of Alberta Central Research Fund. Logistical support was provided by the Polar Continental Shelf Project (PCSP).This is PCSP contribution 02098. Fieldwork was carried out with the kind permission of the Nunavut Research Institute and the peoples of Resolute Bay and Grise Fiord.



