
I. INTRODUCTION
Nanotwinned materials, with a high density of nanoscale twins embedded within micro- or submicro-sized grains, have attracted worldwide interest over the past decade, due to their unique mechanical performances and physical properties, such as high strength, considerable tensile ductility, superior fatigue resistance, and excellent electronic conductivity. Reference Lu, Shen, Chen, Qian and Lu1–Reference You, Lu and Lu6 These properties are promising for many engineering applications. However, to ascertain the safety and reliability of the potential applications, in-depth investigations of the fracture behavior and underlying failure mechanisms associated with the nanotwinned structures are still highly needed.
Previous studies appear to evidence considerable tolerance of nanoscale coherent twin boundaries (TBs) to damage nucleation and propagation. Reference Shan, Lu, Minor, Stach and Mao7–Reference Xiong, You and Lu10 Molecular dynamics simulations demonstrated that interactions between TBs and different types of dislocations emanated from crack tip could relieve stress concentration and enhance the plastic strain accommodation. Reference Zhou and Qu11–Reference Liu, Wang, Gong and Mao13 In situ transmission electron microscope (TEM) observations revealed that the crack was periodically deflected by TBs and thus extended following a zigzag path. Reference Shan, Lu, Minor, Stach and Mao7,Reference Zeng, Li, Lu and Zhu14 In addition, the nanotwin ligaments might also serve as ductile crack bridges to impede microvoids coalescence with the main crack. Reference Kim, Li, Gao and Kumar15 For nanostructured Cu and 316L austenitic steel, the embedding of nanoscale deformation twins in the nanograin matrix leads to substantially crack tip blunting, Reference Xiong, You and Lu10,Reference Luo, You and Lu16 and to formation of coarse/deep dimples, Reference Qin, Lu, Tao, Tan and Lu8,Reference Luo, You and Lu16,Reference Qin, Lu, Tao and Lu17 which improves the overall fracture resistance. Currently, the main understanding on the underlying failure mechanism of nanotwinned metals is obtained through thin films, Reference Shan, Lu, Minor, Stach and Mao7,Reference Zhou and Qu11–Reference Kim, Li, Gao and Kumar15 which probably cannot represent the fracture behavior of bulk nanotwinned counterparts, because specimen thickness and stress state have strong influences on the fracture process.
As a highly oriented hierarchical microstructure, nanotwinned metals exhibit a strong dependence of plastic deformation on loading directions with respect to TBs. Reference Zhu and Gao18,Reference You, Li, Gui, Lu, Zhu, Gao and Lu19 Three distinct dislocation modes can be switched by changing the external loading orientations: dislocation pile-up or slip-transfer across the TBs (hard mode I), threading dislocation propagation in the twin lamellar channels (hard mode II) or twinning partial dislocations slipping at the TBs (soft mode). Reference Zhu and Gao18,Reference You, Li, Gui, Lu, Zhu, Gao and Lu19 Besides, a loading direction dependence of fracture behavior of nanotwinned structure has also been reported in the literature. When the loading direction is parallel to TBs, microcracks nucleate along the grain boundaries (GBs), particularly under low strain rates Reference Kobler, Hodge, Hahn and Kübel20,Reference You and Lu21 ; while for perpendicular loading, detwinning, or shear banding could occur to delay the failure of the nanotwinned structures. Reference Kobler, Hodge, Hahn and Kübel20,Reference Jang, Li, Gao and Greer22,Reference Zhao, Lu, Tieu, Pei, Zhang, Su and Zhan23 However, there is still lack of quantitative fracture mechanics evaluation on the influence of loading conditions on fracture toughness of bulk nanotwinned metals.
It is well known that specimen thickness strongly affects the stress state at the crack tip. Examining the thickness effect on fracture toughness and fracture behavior of bulk nanotwinned metals is distinctly beneficial not only for evaluating the safety reliability but also for scrutinizing the correlated fracture mechanisms under different stress states. In this study, a bulk columnar-grained Cu with preferentially oriented growth nanotwins (nt-Cu) is synthesized by electrodeposition technique. The influence of specimen thickness on the fracture behavior is investigated.
II. EXPERIMENTAL
A. Specimen synthesis and characterization
The high-purity nt-Cu samples (99.99 wt%) in this study were synthesized by direct current electrodeposition technique using a saturated CuSO4 electrolyte solution at a constant temperature, as described in detail elsewhere. Reference You, Lu and Lu6 To guarantee the homogeneity and consistency of the microstructure for different deposited samples, all the deposition parameters (including temperature, pH value, solution volume, current density, etc.) were kept almost constant during electrodeposition. Currently, samples can be successfully prepared with a maximum thickness up to 3 mm while keeping uniform microstructure in the thickness direction.
Microstructural characterization of the as-deposited nt-Cu was carried out by an FEI Nova NanoSEM 430 field emission scanning electron microscope (SEM; FEI, Hillsboro, Oregon) and by a JEOL 2010 TEM (JEOL, Ltd., Tokyo, Japan) with an accelerating voltage of 200 kV. The SEM samples were first mechanically polished, and then electro-polished at room temperature. While the TEM foils with a diameter of ∼3 mm were thinned by twin-jet polishing.
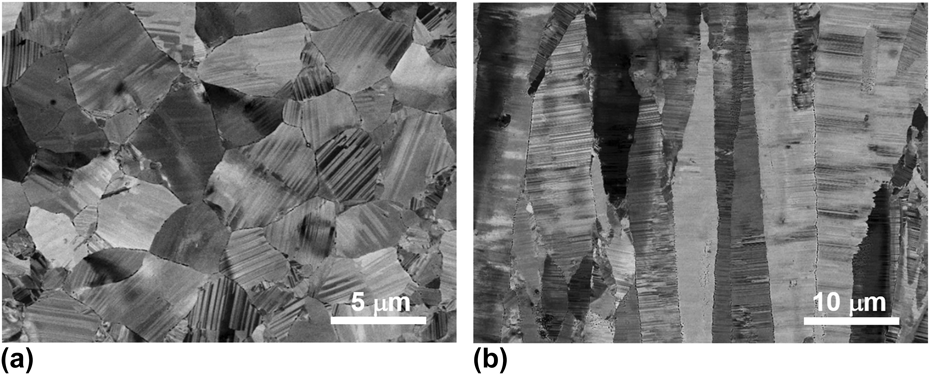
Figure 1(a) displays the plane-view microstructure of the nt-Cu, which is composed of equiaxed polycrystalline grains with an average size of 6 ± 1 μm. However, in terms of the cross-sectional SEM observation in Fig. 1(b), these grains are in fact columnar in shape with a longitudinal length ranging from 5 to 70 μm. In the grain interiors, numerous growth twins mostly parallel to the electrodeposition plane are clearly visible. The preferential orientation of the growth twins is accompanied by a strong (111) out-of-plane texture. Reference Bufford, Wang, Liu and Lu24 Cross-sectional TEM characterization manifests that the nanoscale growth twins have a mean thickness of 45 ± 3 nm. Besides, GBs separating the columnar grains are majorly quite sharp.
SEM observations on the (a) plane and (b) transverse microstructures of the nt-Cu, respectively.

B. Uniaxial tensile tests
The as-deposited nt-Cu specimens were mechanically tested on an Instron 5848 micro-tester (Instron, Norwood, Massachusetts) with a strain rate of ∼5 × 10⁻³ s−1 at ambient temperature. Dog-bone-shaped tensile specimens with a gauge width of ∼2.0 mm, a gauge thickness of ∼0.5 mm, and a gauge length of ∼5.0 mm were prepared by electrical discharge machining (EDM). The uniaxial loading direction was parallel to the TBs. The extension of the gauge section was monitored by a contactless MTS LX300 laser extensometer (MTS, Eden Prairie, Minnesota) and used to calculate the engineering strain. At least three tensile tests were carried out to obtain reliable uniaxial tensile properties.
C. Fracture toughness tests
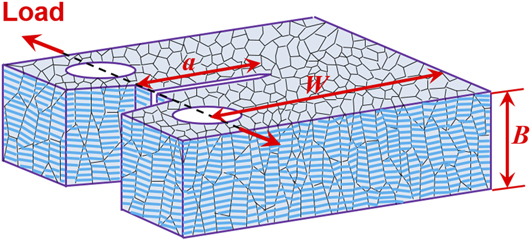
The fracture tests were conducted using miniaturized compact tension (CT) specimens. Figure 2 illustrates the orientation relationship between the CT specimen and the nanotwinned columnar grains. The expected crack propagation plane was perpendicular to the electrodeposition plane and the crack was expected to extend parallel to the electrodeposition plane (i.e., parallel to most TBs in the grain interiors).
The geometry of the miniaturized CT specimen, in which the expected crack propagation plane is normal to the electrodeposition plane, while the crack is expected to extend in the electrodeposition plane.
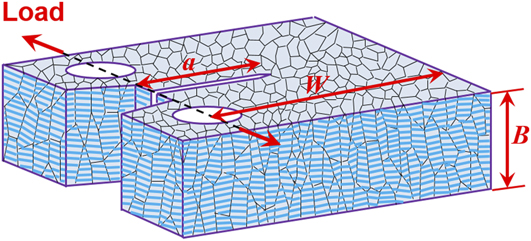
To explore thickness effect on fracture behavior of nt-Cu, CT specimens with a constant width W = ∼8.0 mm, but with thickness B varying from 0.5, 1.0, 1.5, 2.0, 2.5–3.0 mm, were tested. 25 The specimens were first notched to a depth of ∼3.2 mm by EDM, and then fatigue precracked to introduce a sharp crack tip in a tension–tension manner with a stress ratio of ∼0.1 and a frequency of 2 Hz. The final total crack length a 0 before fracture tests was ∼4.0 mm (∼0.5W).
Due to the limited specimen volume, the conventional linear elastic fracture mechanics method was not suitable to directly measure the critical stress intensity factor K IC. Instead, the elastic–plastic fracture mechanics method using a single specimen was adopted to determine J-integral resistance curve and critical J-integral, as per ASTM E1820 (ASTM International, West Conshohocken, Pennsylvania). 25 The fracture tests were also performed on the Instron 5848 micro-tester under displacement control at a cross-head speed of ∼0.5 mm/min at ambient temperature. The crack opening displacements of the miniaturized specimens were accurately measured by a contactless video crack opening displacement (VCOD) gauging system, as described in detail elsewhere. Reference Luo, You and Lu16 The VCOD gauge enabled the determination of instantaneous specimen compliance by partial unloading the specimen, whereby the instantaneous crack length during fracture tests was also derived. Based on the measured load, load-line displacement (LLD), and crack length, the variation of the J-integral values as a function of crack length can be calculated and a critical J-integral (J C) representing the crack initiation toughness was determined.
To obtain the intrinsic size-independent plane strain fracture toughness and J-integral resistance (J–R) curve of the nt-Cu, 20%B side-grooved CT specimens with a total thickness of ∼3.0 mm were also tested. The side-grooved CT specimens were fabricated by machining side grooves with a depth of ∼0.3 mm on both surfaces of the fatigue precracked plane counterparts (B = ∼3.0 mm) using EDM. The samples were entirely immersed in flowing liquid coolant and temperature rising caused by the EDM fabrication was suppressed.
The fracture morphologies and microstructures underneath the fracture surfaces of nt-Cu specimens with different thicknesses were examined by the SEM under the secondary-electron and backscattering-electron imaging modes, respectively. The fracture surfaces were firstly protected by plating a Cu layer through electrodeposition. Then cross section normal to the crack propagation direction was sliced, mechanically and electrolytically polished successively.
III. RESULTS
A. Tensile behavior
Uniaxial tensile tests reveal that the nt-Cu exhibits a 0.2% offset yield strength σys of 371 ± 13 MPa and an ultimate tensile strength σuts of 419 ± 5 MPa. In addition to high strengths, the nt-Cu also possesses a uniform elongation εu of 8 ± 1% and an elongation to failure εf of 18 ± 3%. The relatively high tensile ductility, especially the large post-necking elongation (∼10%), demonstrates that nt-Cu sample has a good uniaxial tensile deformability and is resistant to strain localization compared with other nanotwinned metals. Reference Merz and Dahlgren26–Reference Zhang, Tao and Lu28
B. Fracture properties
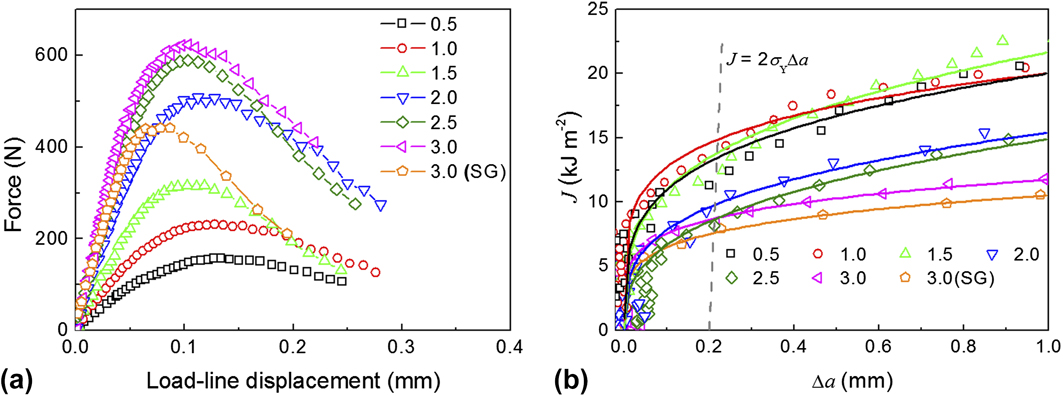
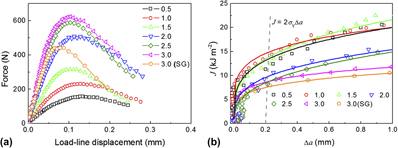
Figure 3(a) shows the force–LLD curves for nt-Cu samples with different thicknesses. For all the curves, after achieving a peak value, the force decreases steadily with increasing LLD, a consequence of stable crack propagation. Reference Launey and Ritchie29 However, the force drops more dramatically for thicker samples, indicating that their crack growth resistances are lower.
(a) The force versus LLD curves for nt-Cu specimens with different thicknesses. (b) Typical J-integral resistance (J–R) curves for nt-Cu specimens with different thicknesses.
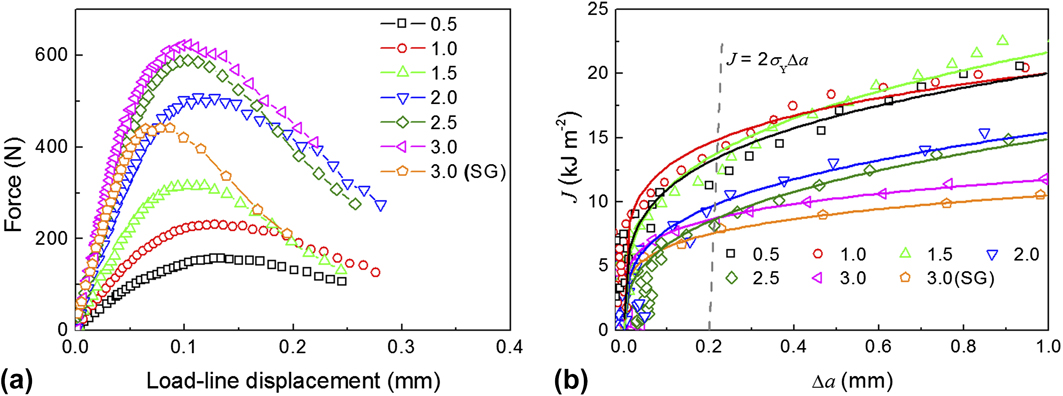
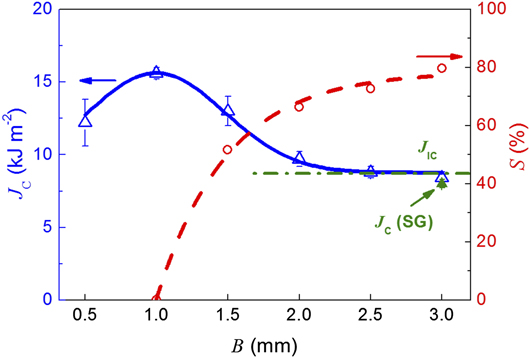
Variations of J-integral as a function of crack extension Δa, namely J–R curves, for the nt-Cu samples with different thicknesses are plotted in Fig. 3(b). Obviously, all the samples exhibit stable crack growth and the J-integral monotonically increases with crack extension. The critical J-integral J C values representing the crack initiation toughness are generally defined as the intersection points between the J–R curves and the 0.2 mm offset blunting line, J = 2σYΔa, where the effective strength σY = (σys + σuts)/2. 25 Table I summarizes all the J C values. Figure 4 shows the variation in J C with specimen thickness. When the thickness is lower than ∼1.0 mm, J C increases with increasing thickness until achieving a peak value (15.6 ± 0.4 kJ/m2). After that, J C decreases with further increasing thickness. When the thickness is larger than ∼2.5 mm, J C reaches a constant value (8.4 ± 0.4 kJ/m2).
Fracture parameters of the nt-Cu specimens with different thicknesses. B indicates sample thickness, while J C and K C indicate critical J-integral and critical stress intensity factor, respectively.

a 20% side-grooved CT specimen.
The provisional fracture toughness (J C) and flat fracture area fraction (S) versus specimen thickness curves for the nt-Cu samples.
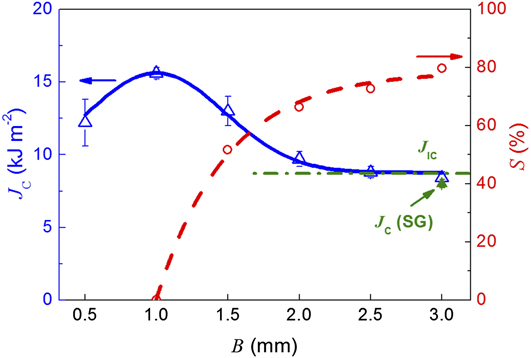
For comparison, CT specimens were also tested with side grooves to suppress potential crack tunneling in specimen center and thus to make crack front advance straightly, as stipulated in ASTM E1820. 25 Since both the thickness and initial ligament width were larger than 25J C/σY, the J–R curve and the critical J-integral J C(SG) for the side-grooved specimen were size-independent. 25 It is evident that the J C value gradually approaches J IC as the specimen is sufficiently thick.
Generally, the critical stress intensity factor K C can be computed by the equation: K C = [E′J C]1/2. Under plane stress state, E′ = E, where E is Young’s modulus, while under plane strain state, E′ = E/(1 − v 2), where v is Poisson’s ratio. For nt-Cu, E = 120 GPa, v = 0.3; thus the maximum plane stress K C,max and the plane strain K JC are 43 ± 1 MPa m1/2 and 32 ± 1 MPa m1/2, respectively, as listed in Table I.
IV. DISCUSSION
A. Thickness effect on fracture toughness
Being analogous to the conventional materials, specimen thickness strongly influences the fracture toughness of the nt-Cu specimens. The critical J-integral increases from 8.4 to 15.6 kJ/m2 as the specimen thickness B reduces from 3 to 1.0 mm, corresponding to variation in stress state from plane strain to plane stress. However, the critical specimen thickness B 0, below which plane stress prevails and fracture toughness decreases with further reducing B, is relatively small. This is probably a consequence of the moderate intrinsic fracture resistance and relatively high yield strength. Generally, plane stress condition fully develops if the specimen thickness is in the order of the plastic zone size situated in plane strain. Thus, B 0 can be estimated according to the equation Reference Shahani, Rastegar, Botshekanan Dehkordi and Moayeri Kashani30 :
 $${B_0} = {1 \over {3\pi }}{{K_{{\rm{IC}}}^2} \over {\sigma _{{\rm{ys}}}^2}}\quad .$$
For the nt-Cu specimen, σys = 371 ± 13 MPa, K IC = 32 ± 1 MPa m1/2, B 0 ≈ 0.8 mm. This is close to the experimental thickness (∼1.0 mm) that the maximum toughness is measured.
B. Stress state influence on deformation and fracture behaviors
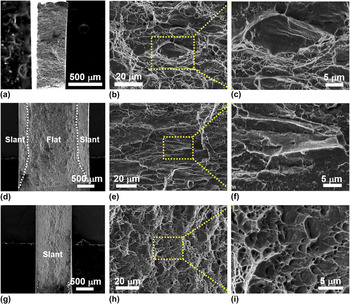
The state of stress also substantially affects the fracture processes of nanotwinned structure. Figures 5(a)–5(c) show the SEM observations on the fracture surface of the nt-Cu tested in uniaxial tension. The sample fractures in a shear mode along a plane inclined at ∼55° with respect to the tensile axis and normal to the deposition plane. Reference You and Lu21 As displayed in Fig. 5(b), the microscopic fracture surface is clearly divided into intergranular fracture area and dimpled area. Reference You and Lu21 Plenty of slip steps or slip bands can be detected at the bottom of the intergranular fracture surface [Fig. 5(c)].
The whole fracture surfaces of three kinds of tested samples: (a) tensile specimen, (d) CT specimen with a thickness of ∼2.5 mm, (g) CT specimen with a thickness of ∼1.0 mm. SEM observations on the fracture morphologies of nt-Cu with different failure modes corresponding to the fracture surfaces in (a, d, g): (b) tensile fracture, (e) flat fracture and (h) slant fracture. (c, f, i) The magnification of the three typical fractographs in (b, e, h), respectively.

Figure 5(d) shows the overall fracture surface of the 2.5 mm CT specimen. The fracture surface is composed of a flat fracture region in the midsection and two slant fracture regions close to both specimen surfaces, due to the different stress states in the through-thickness direction. The proportion, S, of flat fracture region decreases from ∼80% to zero as the specimen thickness is reduced from ∼3.0 to ∼1.0 mm, as shown in Fig. 4. Figure 5(e) displays the magnified observations on the central flat fracture surface, where numerous ridges/corners can be detected along the as-deposited columnar grains, an indication that the sample primarily fails in an intergranular manner. The intergranular fracture is ductile and stable as well, evidenced by numerous slip lines and tear ridges on the fracture surface [Fig. 5(f)].
The fracture surface of the ∼1.0 mm CT specimen is entirely slant to the deposition plane and no flat fracture region can be identified, as shown in Fig. 5(g). In stark contrast with uniaxial tensile fracture and flat fracture in thicker specimens, there is almost no feature of intergranular fracture on the slant fracture surface [Fig. 5(h)]. Instead, there are plenty of lenticular dimples and tear ridges, as shown in Fig. 5(i), indicating that the nt-Cu fails in a shear-dominated mixed I/III fracture mode under plane stress condition.
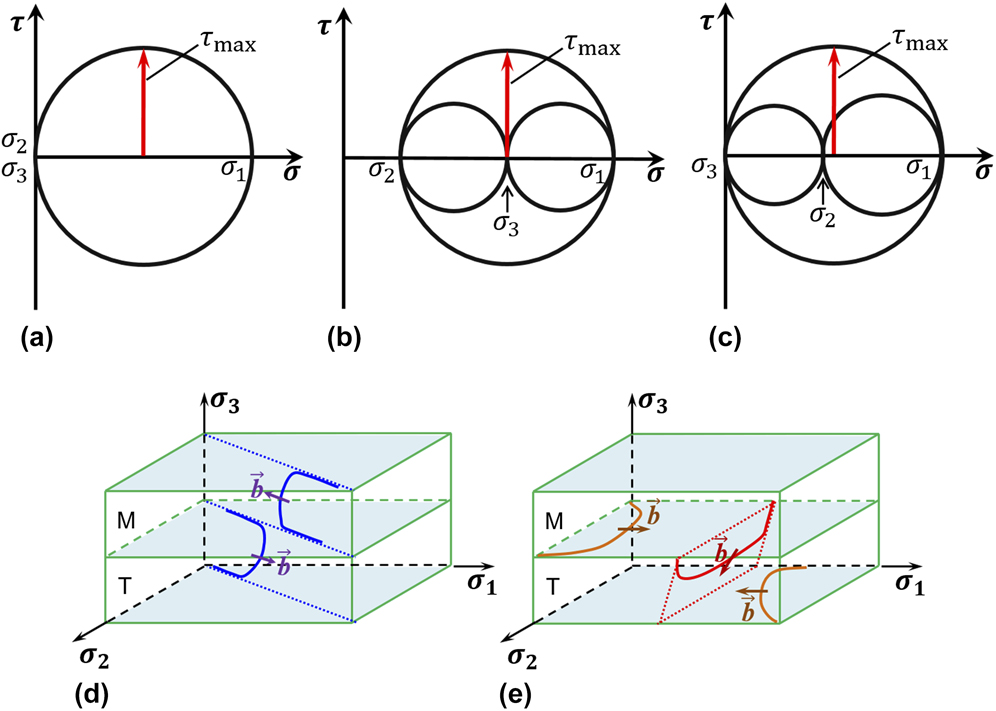
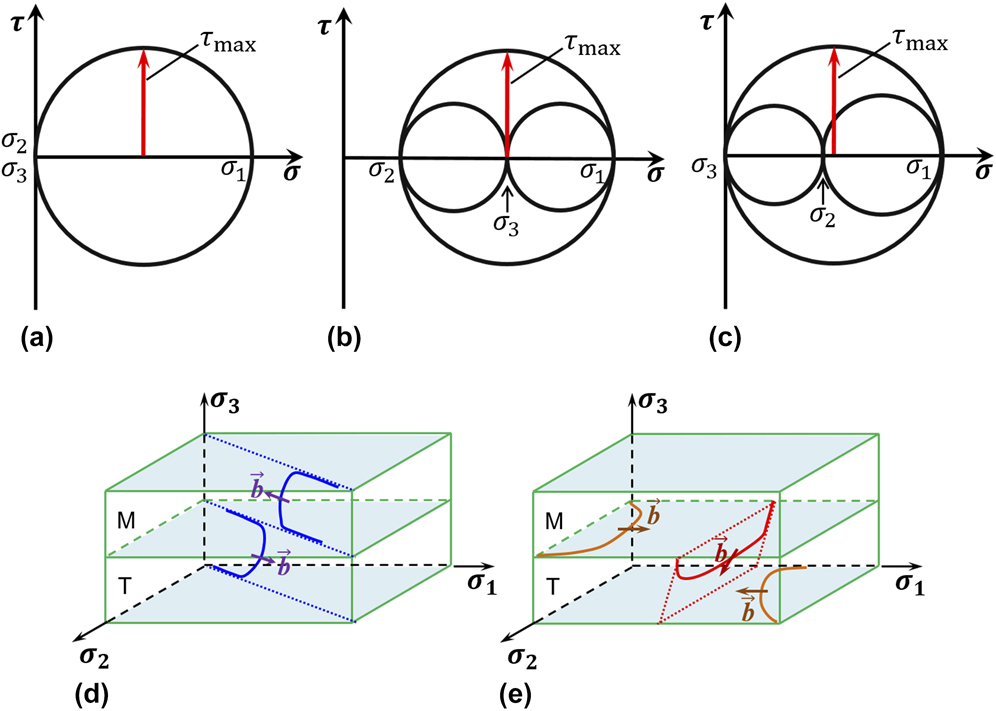
Figure 6 shows the stress Mohr’s circles for uniaxial tension (a) and mode I cracks under plane strain (b) and plane stress states (c), respectively. The principal stress σ1 is parallel to the TBs while the other principal stresses σ2 is in the TBs and σ3 is normal to the TBs. For uniaxial tension, σ2 = σ3 = 0, thus the maximum shear stress, τmax, is at a plane rotated over an angle of 45° from directions of σ1 and σ2 or from directions of σ1 and σ3. The shear stress in the latter case drives dislocation slipping toward the TBs (hard mode I), while the shear stress in the former case stimulates threading dislocations to glide on planes inclined to the TBs but in a direction parallel to the TBs (hard mode II). Reference You, Li, Gui, Lu, Zhu, Gao and Lu19 The hard mode II dislocations require a lower driving force and thus dominate the plastic deformation under uniaxial tension. Reference Kobler, Hodge, Hahn and Kübel20 These dislocations slipping in between the TBs will finally pile-up against and accumulate near GBs, leading to strong stress concentrations at GBs and triple junctions. As a consequence, intergranular cracking eventually takes place, as detected in Fig. 5(b).
The stress Mohr’s circles for different stress conditions: (a) uniaxial tension; (b) mode I crack under plane strain state and (c) mode I crack under plane stress state. Dislocations–TBs interactions under: (d) plane strain condition and (e) plane stress condition.
For CT specimens with thickness much larger than B
0, plain strain state prevails in the center of specimen since the deformation in the thickness direction is restrained by surrounding elastic material. This means that the strain normal to TBs is nearly zero. As shown in Fig. 6(b), in addition to the principal stresses σ1 and σ2 in the TBs, the principal stress
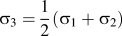 ${\sigma _3} = {1 \over 2}\left( {{\sigma _1} + {\sigma _2}} \right)$
should be present normal to the TBs. Correspondingly, it turns out that τmax is on planes rotated 45° from directions of σ1 and σ2. Similar to the uniaxial tests, driven by shear stresses along this direction, threading dislocations will be activated to accommodate the plastic strain [Fig. 6(d)].
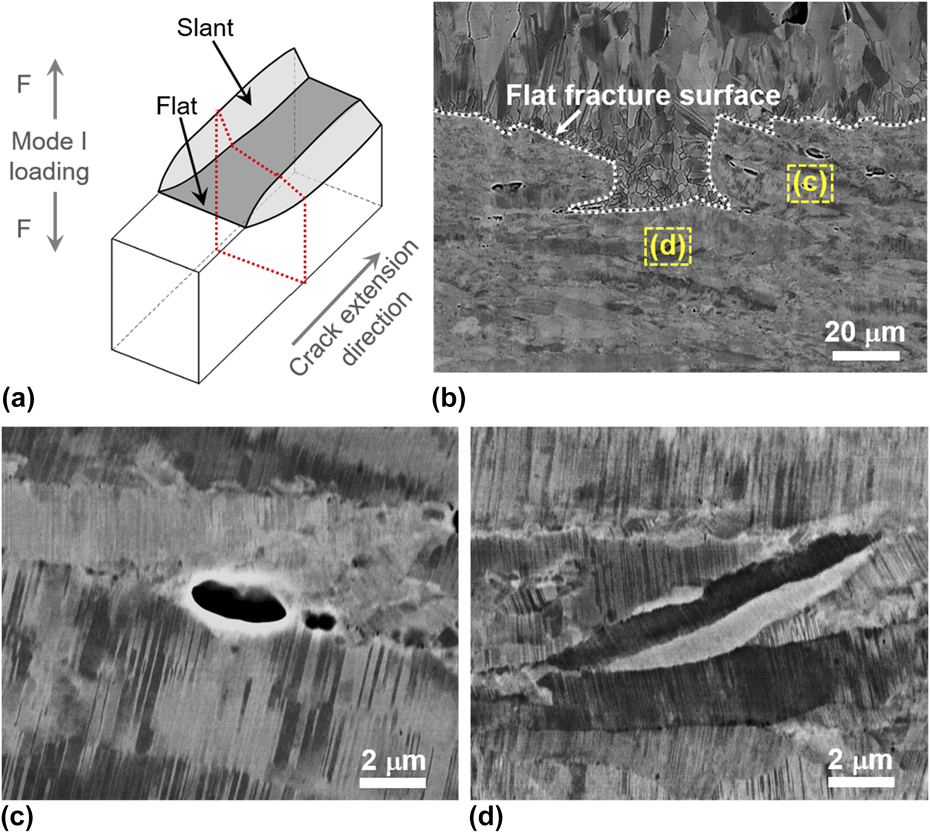
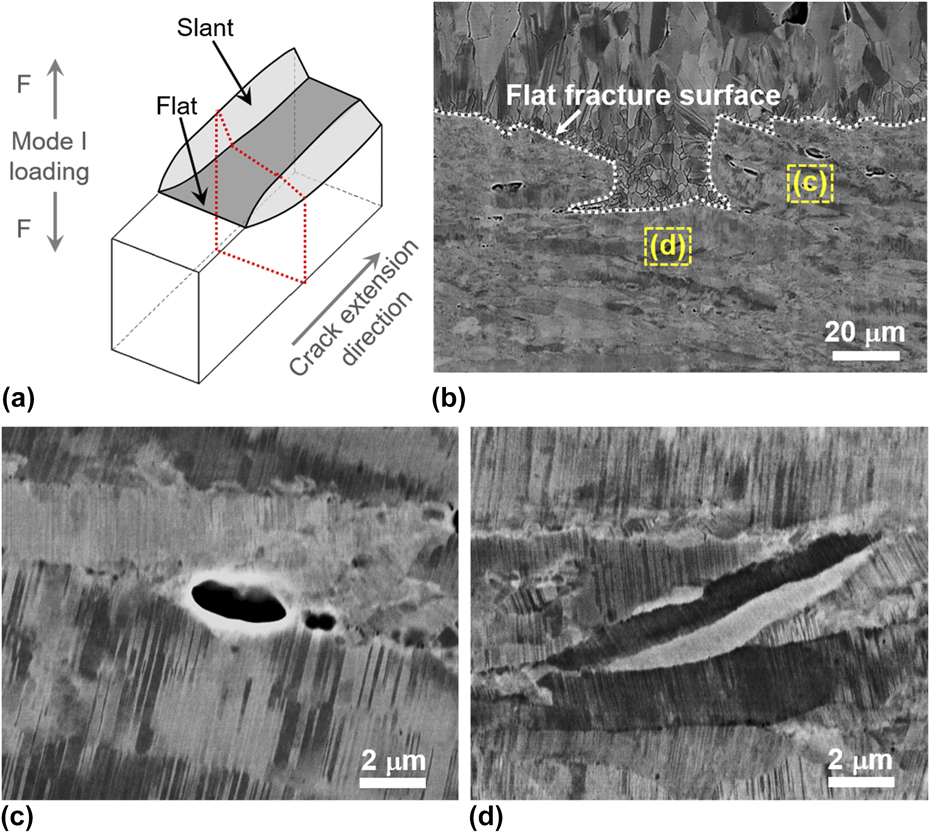
The cross-sectional microstructure underneath the flat fracture surface was carefully examined in the center of a broken CT specimen with B = ∼2.5 mm, along the dotted plane sketched in Fig. 7(a). The nanotwinned structures inside the columnar grains appear to be intact even approaching the fracture surface, as shown in Figs. 7(b)–7(d). Along the GBs, several microvoids with lengths below 2 μm are clearly visible [Fig. 7(c)]. It is expected that nucleation and growth of such microvoids along the columnar GBs mediate the evident intergranular cracking shown in the flat fracture region of nt-Cu [Fig. 5(e)]. Furthermore, under plane strain condition, the applied stress in the crack tip is much larger than the tensile yield stress, which leads to a higher stress concentration along GBs comparing with that under uniaxial tension. As a consequence, the intergranular cracking appears to be more significant under plane strain than under uniaxial tension, as shown in Figs. 5(c) and 5(f).
(a) The illustration of the fracture surface for thick specimens, in which the flat fracture mode dominated the failure process and the crack tip was mainly under plane strain state. (b) SEM observation on the microstructure underneath the flat fracture surface of the CT specimen with a thickness of ∼2.5 mm. (c, d) The magnification of the selected rectangle regions in (b).
In CT specimen with B < B 0, plane stress dominates, and thus plastic deformation in the through-thickness direction becomes feasible because there is no constraint force. Under this condition, σ3 = 0, τmax is on the plane rotated 45° from directions of σ1 and σ3, as shown in Fig. 6(c), namely 45° inclined to the highly aligned TBs. As a result, dislocations slipping inclined against TBs (hard mode I) will be activated to accommodate the plastic deformation perpendicular to TBs. It is well established that this dislocation mode can trigger more extensive interactions between dislocations and TBs. Reference Zhu, Liao and Wu31,Reference Lu, You, Huang, Hansen and Lu32
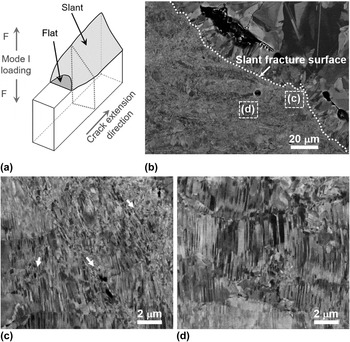
Figure 8(b) shows the SEM observations on the microstructure underneath the fracture surface of a 1.0 mm thick specimen, along the dotted plane sketched in Fig. 8(a). As expected, the fracture surface makes an angle of ∼45° with respect to the specimen surface. Magnified SEM observations [Figs. 8(c) and 8(d)] on a region immediately adjacent to the fracture surface reveal that severe plastic deformation involving destruction of nanotwins takes place before fracture, which is associated with the significant dislocation/TB reactions. Detwinning occurs in some areas, especially in the vicinity of GBs. Localized shear bands, indicated by the white arrows in Fig. 8(c), can also be identified, which lead to fragmentation of the nanotwinned structures. Evidently, these additional deformation processes are beneficial for relaxing the GB stress concentration, and thus intergranular cracking, as observed in thicker CT specimen, is completely suppressed. Eventually, shear fracture takes place transgranularly along a plane inclined to TBs by void nucleation and coalescence in the fragmented regions, Reference Xiong, You and Lu10 resulting in the observed shear dimples on the fracture surface [Fig. 5(i)].
(a) The sketch of the fracture surface for thin specimen under nearly plane stress condition. (b) SEM observation on the microstructure underneath the slant fracture surface of the CT specimen with a thickness of ∼1.0 mm. (c, d) The magnification of the denoted rectangle regions in (b).

Above inspections of fracture surfaces and microstructures evidently reveal quite different deformation and fracture behaviors of the Cu with preferentially aligned nanoscale twins under different stress states with respect to TBs. Under plane strain condition with no plastic strain perpendicular to TBs, threading dislocations are majorly activated to glide along the lamellar channels and produce stress concentration and intergranular cracking when they pile-up against GBs. On the contrary, under plane stress condition, plastic yielding normal to TBs becomes free, and therefore other modes of dislocations, such as dislocation slip-transfer across and partial dislocation gliding at TBs [Fig. 6(e)], should be activated as well to accommodate the deformation. In addition, the intergranular cracking is suppressed by plastic relaxation at GBs through enhanced detwinning and shear banding. The nt-Cu specimen finally fails by transgranular shear fracture involving large plastic deformation, enhancing fracture resistance.
V. CONCLUSION
Specimen thickness substantially affects the fracture toughness and fracture behavior of the nt-Cu with highly aligned nanotwins. Below a critical thickness, the crack front is under plane stress condition and the nt-Cu fails in a transgranular shear fracture manner. The fracture toughness increases with increasing thickness until achieving a peak value (43 MPa m1/2) near the critical thickness. Further increasing thickness leads to obvious reduction in the fracture toughness until acquiring inherent size-independent fracture toughness (32 MPa m1/2). At that circumstance, the crack tip is completely under plane strain condition and the nt-Cu ruptures in a flat intergranular fracture mode.
ACKNOWLEDGMENTS
The authors acknowledge financial support from the National Natural Science Foundation of China (Grant Nos. 51420105001, 51371171, 51471172, 51401211, and U1608257) and the Key Research Program of Frontier Sciences, Chinese Academy of Sciences. Z.Y. acknowledges financial support by Natural Science Foundation of Jiangsu Province, China (Grant No. BK20161498).