I. Introduction
We use experimental data to disentangle the signaling and budgetary effects of price on wine demand. The first is the change in perceived quality associated with a price change, and the second is the change in demand associated with a price change holding quality constant. The participants in the experiment are nonprofessional wine tasters who choose a preferred wine and the wine they would buy after tasting four different wines. Because of the experimental design, their stated choices allow us to isolate the signaling effect of price in a simple and intuitive way.
Wine is an interesting product to study because price and quality are subject to a large variation. It is also a complex “experience good” (Ali and Nauges, Reference Ali and Nauges2007), whose quality depends on many attributes (appearance, in glass aroma, in mouth sensations, aftertaste, etc.) and may be fully revealed only by following the complicated protocols of wine tasting. For nonprofessional wine tasters, quality may be difficult to assess even after consumption. This has two consequences. First, prices adjust slowly as consumers learn. For example, Ashenfelter (Reference Ashenfelter2008) shows that weather conditions help predict the quality of Bordeaux wines, but market prices of “negatively” shocked vintages adjust only very slowly over time. If quality were perfectly observable, the process would be instantaneous. Second, there is scope for experts. For example, Ali et al. (Reference Ali, Lecocq and Visser2008) find that with his oenological grades Robert Parker, perhaps the best-known wine expert, is able to influence the demand for wines and their prices. Again, with perfectly observable quality, there would be no need for experts to measure it.
Whenever consumers cannot pin down the value of a product prior to purchase, firms might use a variety of tools to signal quality, including advertising and prices. This implies that product quality, prices, and advertising are jointly determined. Of course, “for a signal to be effective, it must be unprofitable for sellers of low-quality products to imitate it” (Spence, Reference Spence1976). Mahenc (Reference Mahenc2004), Spence (Reference Spence1976), and Tellis and Wernerfelt (Reference Tellis and Wernerfelt1987) show that prices signal quality, unless there are too many uninformed buyers in the market and a pooling equilibrium with just one price prevails. Shapiro (Reference Shapiro1983) shows that, when buyers cannot observe product quality, there is an incentive for sellers to reduce quality and take short-run gains before buyers catch on. To forestall such quality cutting, the equilibrium price–quality schedule involves high-quality items that sell at a premium above their cost. This premium also compensates sellers for their investment in reputation.
Despite the large theoretical literature on the signaling value of prices or advertising (see Bagwell, Reference Bagwell, Armstrong and Porter2007, for an overview), most of the empirical literature focuses on the observed correlation between price and quality in nonexperimetal data. An early paper by Oxenfeldt (Reference Oxenfeldt1950) finds evidence of a positive correlation, but later studies find that the correlation at times is negative. Rao and Monroe (Reference Rao and Monroe1989) and Tellis and Wernerfelt (Reference Tellis and Wernerfelt1987) provide a meta-analysis of these studies. The contrasting results may depend on either the nature of the products under investigation or how informed the consumers are. More importantly, because product quality, prices, and advertising are jointly determined, most of the empirical literature describes statistical associations and provides little information on the causal mechanisms at work. Further, since in nonexperimental data quality is typically correlated with price and is hard to measure, it is unable to isolate the signaling effect of prices from the its budgetary effects.
A few papers have tried to exploit supposedly exogenous variations in signals of product quality. For example, Ippolito and Mathios (Reference Ippolito and Mathios1990, Reference Ippolito and Mathios1995) use variation in regulatory bans against producer advertising to show that consumers of ready-to-eat cereals extract information from advertising. One issue with their approach is that in nonexperimental data it is hard to separate the effect of exposure to advertising from the effect of budgetary constraints, quality, brand loyalty, or experience.
Plasmann et al. (Reference Plassmann, O'Doherty, Shiv and Rangel2008) use brain imaging to show that artificially increasing the price of wines told to tasters not only increases their reported pleasantness but also activates a part of their brain (the medial orbitofrontal cortex) that has been shown to be associated with experienced pleasantness.
Heffetz and Shayo (Reference Heffetz and Shayo2009) perform a lab experiment in which participants choose between two candies with varying relative prices. They find that the pure price elasticities of demand, which they call the budget constraint (BC) price elasticities, are around −1, while the additional effects driven by signaling, which they call non-BC elasticities, are positive but much smaller in absolute value (between 0.09 and 0.18). They also find that these non-BC elasticities become significant only after the candy has been tasted, which is somehow puzzling. They perform an additional field experiment showing that measured non-BC effects are close to zero.
We see our contributions as complementary to those of Heffetz and Shayo (Reference Heffetz and Shayo2009). First, we consider a different type of product (wine), for which the non-BC effect of price is likely to be strong. Since wine tasting is a noisy signal of wine quality, rational consumers should take higher price as a signal of higher quality if there is a positive price–quality relationship in the market. In fact, the data that we collected on Italian wines show a strong positive relationship between price and quality over the price range relevant for our experiment. Second, unlike Heffetz and Shayo (Reference Heffetz and Shayo2009)'s homogeneous sample of 186 students, our sample of wine tasters is more representative of the actual population of wine consumers and allows us to test whether the signaling effect of price depends on background characteristics of consumers.
We find that, for lower-priced wines, the signaling effect of price dominates, so demand increases as price increases, while for higher-priced wines, the budgetary effect dominates. This signaling effect is driven by signaling of quality, not by determination of status. We show that these findings are consistent with the price–quality relationship observed in the Italian market, which is stronger for lower-priced wines in the sense that consumers learn a lot about the quality of these wines from their price. Such nonlinearity in the effect goes against a “status” effect of price. Moreover, the signaling effect is larger among younger and presumably less-experienced consumers, which we view as further evidence that price signals quality rather than status.Footnote 1
Although our data contain only stated choices (without an exchange of money for the product), as opposed to actual choices, the typical concerns about stated preferences do not apply in our setting. Participants were not asked to state willingness to pay, which could be inflated if actual payments are not made.Footnote 2 The alternatives did not differ in “socially desirable characteristics,” which could be overvalued in stated preferences. Wine quality was not revealed to respondents, but could be learned only through tasting.
There are some similarities between our identification strategy and the approach proposed in the marketing literature by Gautschi and Rao (Reference Gautschi, Rao and de Fontenay1990) in order to separate the budgetary from the price-signaling effect. Recently, Rao and Sattler (Reference Rao, Sattler, Gustafsson, Herrmann and Huber2003) and Völckner and Sattler (Reference Völckner and Sattler2005) have run similar experiments that find evidence of a signaling effect. The main difference is that our statistical model allows us to evaluate the statistical significance of the various components of the price effect and permits their effect to vary with the characteristics of the product and the consumers. We also closely link our empirical specification to an explicit model of consumer demand.
The remainder of this paper is organized as follows. Section II lays out our conceptual framework. Section III describes the experimental data that we use. Section IV presents our econometric specifications. Section V illustrates our empirical results. Section VI adds some supporting evidence on the relationship between price and quality. Finally, Section VII is the conclusion.
II. Conceptual Framework
In this section we introduce a simple demand model in which quality is not perfectly observable and prices have a nonbudgetary effect on demand through their signaling value. The model is introduced to discipline the econometric specification in Section IV.
Demand for a good, in our case wine, is assumed to be a smooth function
 $$D = D(X,\;P,\;Q)$$
of a set X of individual characteristics (income, demographics, etc.), the price of the good P, and its perceived quality Q. According to the law of demand, we expect demand to respond negatively to a price increase, that is, D P=∂D/∂P⩽0. We also expect demand to respond positively to an increase in perceived quality, that is, D Q=∂D/∂Q⩾0.
Perceived quality is assumed to be a smooth function
 $$Q = Q(X,\;S_P, \;S_I, \ldots, \;S_m ),$$
of individual characteristics X, product price S P (used as a signal of quality) and a set of signals S 1, … , S m other than price, such as sensory evaluation and other information. We expect perceived quality to respond positively to a price increase, that is, Q SP=∂Q/∂S P⩽0, and we shall henceforth refer to Q SP as the signaling value of price. We also define signals in such a way that Q Sj=∂Q/∂Sj>0, j=1, … , m.
Substituting Equation (2) back into Equation (1) gives the following reduced-form relationship between demand and price
 $$D = D(X,P,Q(X,S_P, S_1, \ldots, S_m )) = \tilde D(X,P,S_P, S_1, \ldots, S_m ).$$
In observational data S P=P, that is, the market price P entered in the demand equation is the same as the price signal S P that influences the consumer's perception of product quality. When P and S P are identical, reduced-form demand is
 $$D^{\rm *} (X,P,S_1, \ldots, {\rm S}_m ) = D(X,P,Q(X,P,S_1, \ldots, S_m )).$$
Estimation of D* reveals only the sum of the budgetary and signaling effects of price
 $$D_P^{\ast} = D_P + D_Q Q_{S_P} $$
If demand does not depend on quality (i.e,, D Q=0), or prices have no signaling value (i.e.,  $Q_{S_P} = 0$), then D*P=D P. In general, however, D Q>0 and
 $Q_{S_P} \gt 0$. So D P cannot be identified from knowledge of D*P alone. Without additional information (e.g., credible instrumental variables restrictions), we can only conclude that D P<D*P. This may be useful if D*P<0. However, if D Q or
 $Q_{S_P} $ are sufficiently large, it may be the case that D P⩽0<D*P.
We use data that offer the unique opportunity to learn separately about D P and  $D_Q Q_{S_P} $. In an experimental setting, consumers could be permitted to buy the product at different prices P, holding fixed the product's market price S P which influences perceived product quality. Variation of P, holding S P fixed, identifies the budgetary effect of price
 $\tilde D_P = D_P $. Variation of P and S P together (holding them equal) identifies the reduced form effect D*P, and hence the signaling effect
 $D_Q Q_{S_P} $.
III. Data
The data that we use contain information on stated choices by a sample of 183 nonprofessional wine tasters who participated, between December 2007 and February 2008, in three blind wine-tasting experiments held near Conegliano, in the northeastern Italian region of Veneto.
The experiments were jointly organized by the Agricultural Research Council-Viticulture Research Center (CRA-VIT) and the Department of Land, Environment, Agriculture and Forestry and the Department of Management and Engineering at the University of Padua. Each experiment was devoted to one of the typical wines from eastern Veneto: the first (52 subjects) to Prosecco from Conegliano-Valdobbiadene (for simplicity, henceforth, Prosecco), the second (59 subjects) to Merlot from Piave (henceforth, Merlot), and the third (72 subjects) to Tocai Italico from Lison-Pramaggiore (henceforth, Tocai). None of the subjects participated in more than one experiment. In what follows, we provide basic information on the experimental design and refer to Tempesta et al. (Reference Tempesta, Arboretti Cristofaro, Corain, Salmaso, Tomasi and Boatto2010) for further details.
In each experiment, five choice tasks (tastings) were proposed involving wines of the same type but different intrinsic quality. Thus, the data from each experiment may be regarded as a balanced panel with repeated observations on each subject. In each choice task, subjects were asked to state their preferred wine profile among the four proposed (the precise wording was “Of the wines that you just tasted, which do you prefer?”), and the profile that they would buy (the precise wording was “Of the wines that you just tasted, which would you buy?”). Since the “none” option (“none of the offered wines”) was also allowed, the available choice set has five alternatives.
A proposed wine profile consisted of a unique combination of three attributes: objective wine quality and randomly assigned price and landscape type. Wine quality was classified into low, medium, or high, depending on the value of a hedonic index constructed using the numerical evaluations assigned to each wine by a panel of 11 wine experts to three attributes (olfactory, gustatory-tactile, and retro-olfactory).Footnote 3 We regard the expert information as an objective attribute of the wine that is assessed by consumers through tasting. Expert evaluations were not revealed to participants in the experiment.
Three price levels were selected: 3, 5, and 8 euros (for a 0.75 liter bottle). Note that 5 euros is roughly the average retail price of nearly 2,000 Italian wines reviewed between 2006 and 2012 by Altroconsumo, an independent consumer association. For Merlot, these prices roughly correspond to, respectively, the lower quartile, the median, and the upper quartile of the distribution of retail prices per bottle in 2007–2008. For Prosecco, which is cheaper than Merlot, they correspond, instead, to the median, the upper quartile, and the upper decile of the distribution of retail prices. The case of Tocai falls in between these two extremes.
As for the third attribute, images were selected for each of four landscape types: evocative (in which a historic building is placed in the background of a vineyard), traditional (showing vineyards cultivated on small plots of land, with scattered hedges, meadows, and trees), modern (showing large-scale vineyards cultivated on large plots), and degraded (in which industrial buildings are visible in the background of a vineyard). These images represented actual vineyards in the area of production of Prosecco (the hills between the towns of Conegliano and Valdobbianee) and the area of production of Merlot and Tocai Italico (the plains between the Livenza and Piave rivers). Tasters were led to believe that the price was the real price of the tasted wines and that the landscape image represented the environment where the tasted wines were produced.
In practice, of the 3×3×4=36 possible wine profiles, only 4×5=20 were randomly selected in each experiment. One feature of the experimental design is that, in each choice task, two of the proposed wines were of the same quality and two had the same price. This design makes it easier to identify the separate effects of quality and price on demand.
The experiments were aimed mainly at studying how wine preferences were linked to landscape features, the basic idea being that “the beauty of the landscape can positively affect the wine quality perception” (Tempesta et al., Reference Tempesta, Arboretti Cristofaro, Corain, Salmaso, Tomasi and Boatto2010). However, because of their design, they can also be used to study how the perception of wine quality is linked to price. Note that price and landscape are often used by producers to signal the quality of a good. In typical observational studies, demand, price, and quality are endogenous. The main advantages of our experimental setting is that, by design, price, landscape, and intrinsic quality are orthogonal to one another and exogenous to demand.
The data also contain background information about the wine tasters, namely, demographic information on age group (18–24, 25–39, 40–60, or 60+), gender, province of residence (Padua, Treviso, or other), and type of residential location (urban center, suburb, rural center, or rural area), plus information on wine consumption patterns, including weekly wine consumption (do not drink, 1/2 liter or less, 1/2 to 1 liter, 1 to 3 liters, or more than 3 liters), type of shop where wine is bought (not mutually exclusive: wineries, wine shops, supermarket/food shops), and previous participation in wine-tasting courses.
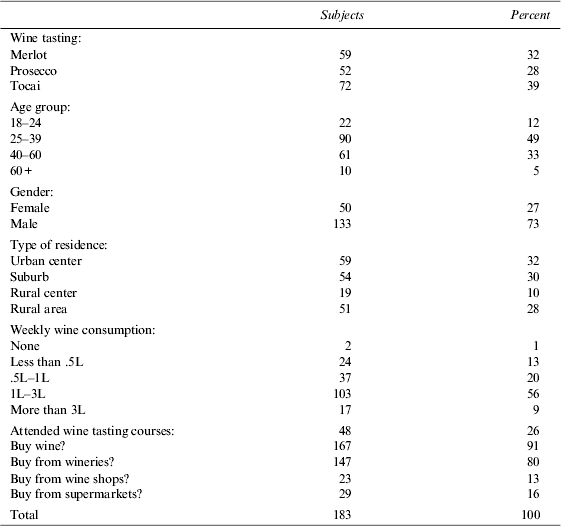
Table 1 summarizes individual characteristics of the wine tasters. The sample consists predominantly of men (73 percent), who live in urban centers or suburbs (62 percent), with weekly wine consumption above 1 liter (65 percent), without previous wine course experience (74 percent), and who buy mostly from wineries (80 percent). Tempesta et al. (Reference Tempesta, Arboretti Cristofaro, Corain, Salmaso, Tomasi and Boatto2010) argue that the sample may be regarded as broadly representative of the wine-drinking population in the Veneto region, an area of Italy where “wine culture” is very important and deeply rooted.
Summary Statistics

We find little evidence of inconsistency between preferred and buying choices. Tasters choose a less expensive wine as their buying choice in 15.7 percent of choice tasks, whereas they choose a more expensive wine to buy in only 3.6 percent of tasks. We do not remove these observations from analysis; instead, our specification allows random components of preferred and buying choices to differ.
IV. Econometric Specification
Labeling by j=0, … , 4 the five alternatives available in each choice task, with the alternative j=0 corresponding to the none option, we interpret the stated preferred choice among the alternatives in choice task t as the result of maximizing the additive random utility
 $$U_P^{\,jt} = \left\{ {\matrix{ {\varepsilon _P^{0t},} & {if\,{\rm \;} j{\rm \;} = {\rm \;} 0,} \cr {V(X,S_P^{\,jt}, S_Q^{\,jt}, S_L^{\,jt} ) + \varepsilon _P^{\,jt},} & {if\,{\rm \;} j{\rm \;} = {\rm \;} 1, \ldots, 4,} \cr}} \right.$$
where V (X, S P, SQ, SL) is the average utility that a consumer with observable characteristics X attributes to wine with quality signals (S P, SQ, SL). In addition to the price S P, we have two other quality signals: wine taste and landscape. S Q is the wine-tasting grade assigned to the wine by a panel of experts. This grade was not revealed to subjects in the experiment, and we use it as a proxy for their own assessment of the wines through tasting. S L is the signal provided by the landscape images.
We similarly interpret the stated buying choice among alternatives j=0, … , 4 in choice task t as the result of maximizing the additive random utility
 $$U_B^{\,jt} = \left\{ {\matrix{ {\varepsilon _B^{0t},} & {if\,{\rm \;} j{\rm \;} = {\rm \;} 0,} \cr {C(X,P^{\,jt} ) + V(X,S_P^{\,jt}, S_Q^{\,jt}, S_L^{\,jt} ) + \varepsilon _B^{\,jt},} & {if\,{\rm \;} j{\rm \;} = {\rm \;} 1, \ldots, 4,} \cr}} \right.$$
where C(X, P) is the disutility of spending P for a consumer with observable characteristics X.
In our empirical specification,  $\varepsilon _P^{\,jt} $ and
 $\varepsilon _B^{\,jt} $ are assumed to be drawn from the same Type I extreme value distribution (implying a conditional multinomial logit specification) and to be distributed independently across alternatives in the same choice task and across individuals. In calculating robust standard errors, we allow the error terms to be correlated across choice tasks for the same individual.
We can map the demand shares in the random utility model to the reduced-form demand function  $\tilde D$ in our conceptual framework. Consider a consumer choosing between K alternative wines with attributes (Pk, S Pk, SQk, SLk), k=1, … , K (not necessarily the same alternatives as offered in the experiment). Then the demand (market share) for alternative k among consumers with the same observable characteristics X equals
 $$\tilde D^k = \tilde D(X,P^k, S_P^k, S_Q^k, S_L^k ) = \displaystyle{{{\rm exp}(C(X,P^k ) + V(X,S_P^k, S_Q^k, S_L^k ))} \over {\mathop \sum \nolimits_{\,j = 1..K} \;{\rm exp}(C(X,P^{\,j} ) + V(X,S_P^{\,j}, S_Q^{\,j}, S_L^{\,j} ))}}.$$
The derivatives of  $\tilde D^k $ with respect to attributes of product k are proportional to the derivatives of C(X, Pk)+V(X, S Pk, SQk, SLk):
 $$\matrix{ {\displaystyle{{\partial \tilde D^k} \over {\partial P^k}}} = \tab\!\!\!\!\! {\tilde D^k (1 - \tilde D^k )\displaystyle{{\partial C(X,P^k )} \over {\partial P^k}},} \cr {\displaystyle{{\partial \tilde D^k} \over {\partial S_P^k}}}= \tab\!\!\!\!\! { \tilde D^k (1 - \tilde D^k )\displaystyle{{\partial V(X,S_P^k, S_P^k, S_L^k )} \over {\partial S_P^k}}.} \cr} $$
When the functions C(·) and V(·) are linear in product attributes, derivatives of the demand function are proportional to their coefficients.
Our specification assumes that C(·) is linear in the product price and V(·) is additive in product attributes:
 $$\eqalign{C(X,P) = &\, \beta _M P, \cr V(X,S_P, S_Q, S_L ) = &\, \beta _0 + V_P (S_P ) + V_Q (S_Q ) + V_L (S_L ).} $$
Our data contain three different values of price signal S P, three different categories of intrinsic wine quality S Q, and four types of landscape images S L. We employ a fully nonlinear specification for  $V_{Pp} $, V Q, and V L, using nested indicator functions for different values to facilitate comparisons:
 $$\eqalign{S_P \in &\, [\euro 3,\;\euro 5,\;\euro 8], \cr V_P (S_P ) = &\, \beta _{P2} {\rm \; I}[S_P \in \{ \euro 5,\;\euro 8\} ] + \beta _{P3} {\rm \; I}[S_P \in \{ \euro 8\} ].} $
In this specification, β P2=V P(€5)−V P(€3) and β P3=V P(€8)−V P(€5). Coefficient β 0 absorbs baseline values of V P(€3), V Q (low), and V L (degraded).
Similarly, our specification for the signaling effects of intrinsic quality and landscape is:
 $$\eqalign{S_Q \in &\, [{\rm low},\;{\rm medium},\;{\rm high}], \cr V_Q (S_Q ) = &\, \beta _{Q2} {\rm \; I}[S_Q \in \{ {\rm medium},\;{\rm high}\} ] + \beta _{Q3} {\rm \; I}[S_Q \in \{ {\rm high}\} ], \cr S_L \in &\, [{\rm degraded},\;{\rm modern},\;{\rm traditional},\;{\rm evocative}], \cr V_L (S_L ) = &\, \beta _{L2} {\rm \; I}[S_L \in \{ {\rm modern},\;{\rm traditional},\;{\rm evocative}\} ] \cr & + \beta _{L3} {\rm \; I}[S_L \in \{ {\rm traditional},\;{\rm evocative}\} ] + \beta _{L4} {\rm \; I}[S_L \in \{ {\rm evocative}\} ].} $$
We first estimate the model on the pooled data. We then estimate the model separately by type of wine and by major demographic group. This allows full interaction between the price and signaling effects and the characteristics of the products and the consumers.
V. Empirical Results
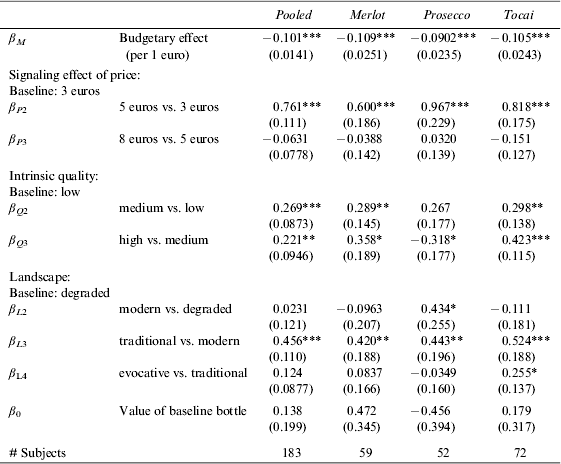
Table 2 presents the results by pooling the data for all wines (second column), and then separately by wine type (Merlot, Prosecco and Tocai).
Results by Wine Type
Notes: For each subject we have five tastings, with four wine alternatives and the choice of none. Standard errors in parentheses (clustered by individual): *** p<0.01, ** p<0.05, * p<0.1.
In line with the laws of demand, the price response of demand (β M) is negative and strongly statistically significant.
The signaling value of price (β P2 and β P3) appears to be nonlinear, as we observe a strong and statistically significant positive effect of increasing the price from 3 to 5 euros but no effect of increasing the price from 5 to 8 euros. In this case, the effect is actually negative, although very small in magnitude and not statistically significant. This is consistent with the finding in Plassmann et al. (Reference Plassmann, O'Doherty, Shiv and Rangel2008) that the effect of a price increase on medial-orbitofrontal cortex activity is larger at low ($5) than at high prices ($10).
As for the signaling value of intrinsic quality, we observe a positive and statistically significant effect of increasing quality. Interestingly, the incremental change from low to medium (β Q2) is about the same as the incremental change from medium to high (β Q3).
As for the signaling value of landscape, we observe no statistically significant difference between degraded and modern landscapes (β L2) or between traditional and evocative landscapes (β L4). However, we observe a strongly positive and statistically significant effect of varying the landscape from modern to traditional (β L3). Thus, it seems that the consumers distinguish only between two types of landscape: degraded or modern, on the one hand, and traditional or evocative, on the other end.
These findings remain essentially the same when we consider each wine type separately. The budgetary effects are strikingly similar. The signaling value of price exhibits a similar strongly nonlinear profile for all wine types. The signaling value of intrinsic quality is the only dimension where a difference emerges between Merlot and Tocai, on the one hand, and Prosecco, on the other hand. While the incremental changes from low to medium quality and from medium to high quality are always positive for the first two wine types, they actually have opposite signs and low statistical significance for Prosecco, so the incremental change from low to high quality (β Q2+β Q3) is close to zero. Thus, consumers appear to have a hard time distinguishing Prosecco quality at a tasting. Finally, the signaling value of landscape is generally consistent across wine types.
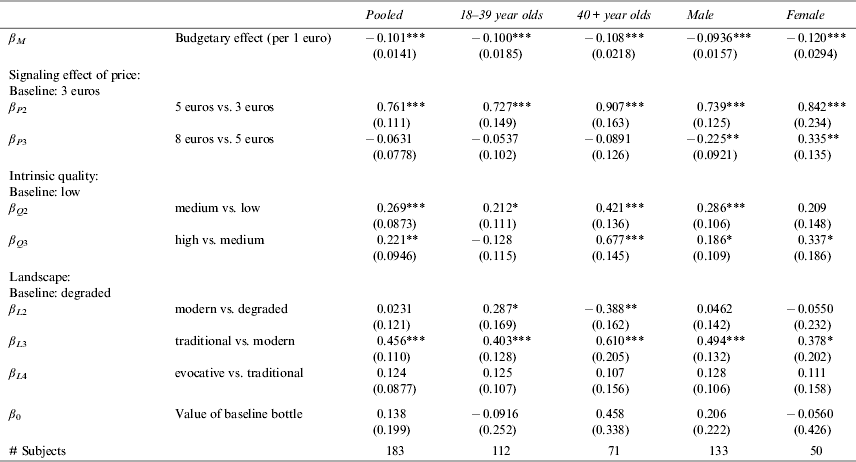
Table 3 investigates the issue of heterogeneity in preferences across major demographic groups. The first column reproduces the first column in Table 2 and contains the results from the pooled data. The next two columns compare younger (18–39 years old) and older consumers (40+ years old), while the last two columns compare men and women.
Results by Demographic Group
Notes: For each subject we have five tastings, with four wine alternatives and the choice of none. Standard errors in parentheses (clustered by individual): *** p<0.01, ** p<0.05, * p<0.1.
While the budgetary effects of prices are the same between younger and older consumers, and the signaling value of prices is similar, the signaling value of quality and landscape appear to be different. As for quality, the incremental change from low to medium is positive for both groups but is much lower and less statistically significant for younger consumers. However, the change from medium to high quality affects the demand of only older consumers positively. Further, in relative terms, the signaling effect of prices is much more important for younger and presumably inexperienced consumers than it is for older ones. This is consistent with the effect of prices carrying some additional information about the quality that less-knowledgeable consumers appreciate more. Finally, younger and older consumers appear to rank landscapes categorized as modern and degraded differently.
As for the comparison between men and women, many coefficients are estimated less precisely for women because they represent only 27 percent of the sample. The main gender difference appears to be the signaling value of prices. While this has a nonlinear profile for both men and women, the incremental change from 5 euros to 8 euros is different—namely, negative for women and positive for men.
VI. Price-Quality Relationship in the Market
Consumers may prefer higher-priced wines even after having a chance to test them, for two reasons. First, price could provide consumers with additional information about product quality even after tasting if they are correlated in the marketplace and tasting provides an imperfect signal of quality. Second, a higher price may have some intrinsic value for consumers (e.g., display social status when consumption is visible to others). In this section, we use wine price–quality data for Italy to show that consumers’ behavior in the experiment is consistent with the signaling theory.
We estimate the price–quality relationship using wine quality ratings provided by Altroconsumo, the main Italian consumer association. This dataset includes 1,950 wines reviewed between 2006 and 2012 in the annual wine guide published by the association and represents the most comprehensive source of price–quality data for commonly consumed Italian wines. Although the guide is not a representative sample of wines from the Veneto region, it covers wines sold countrywide, and we see no reason why the slope of the price–quality relationship should systematically differ for the Veneto region relative to the rest of Italy. The median price in the sample is 4.70 euros and less than 1 percent of rated wines are priced above 15 euros. The price range used in the experiment is covered particularly well: 74% of the rated wines have prices between 3 and 8 euros per bottle. Each wine received a degustation mark ranging from A to D, as well as a composite quality score on a 100-point scale. The composite score uses information from the chemical analysis of the wine in addition to the degustation results.
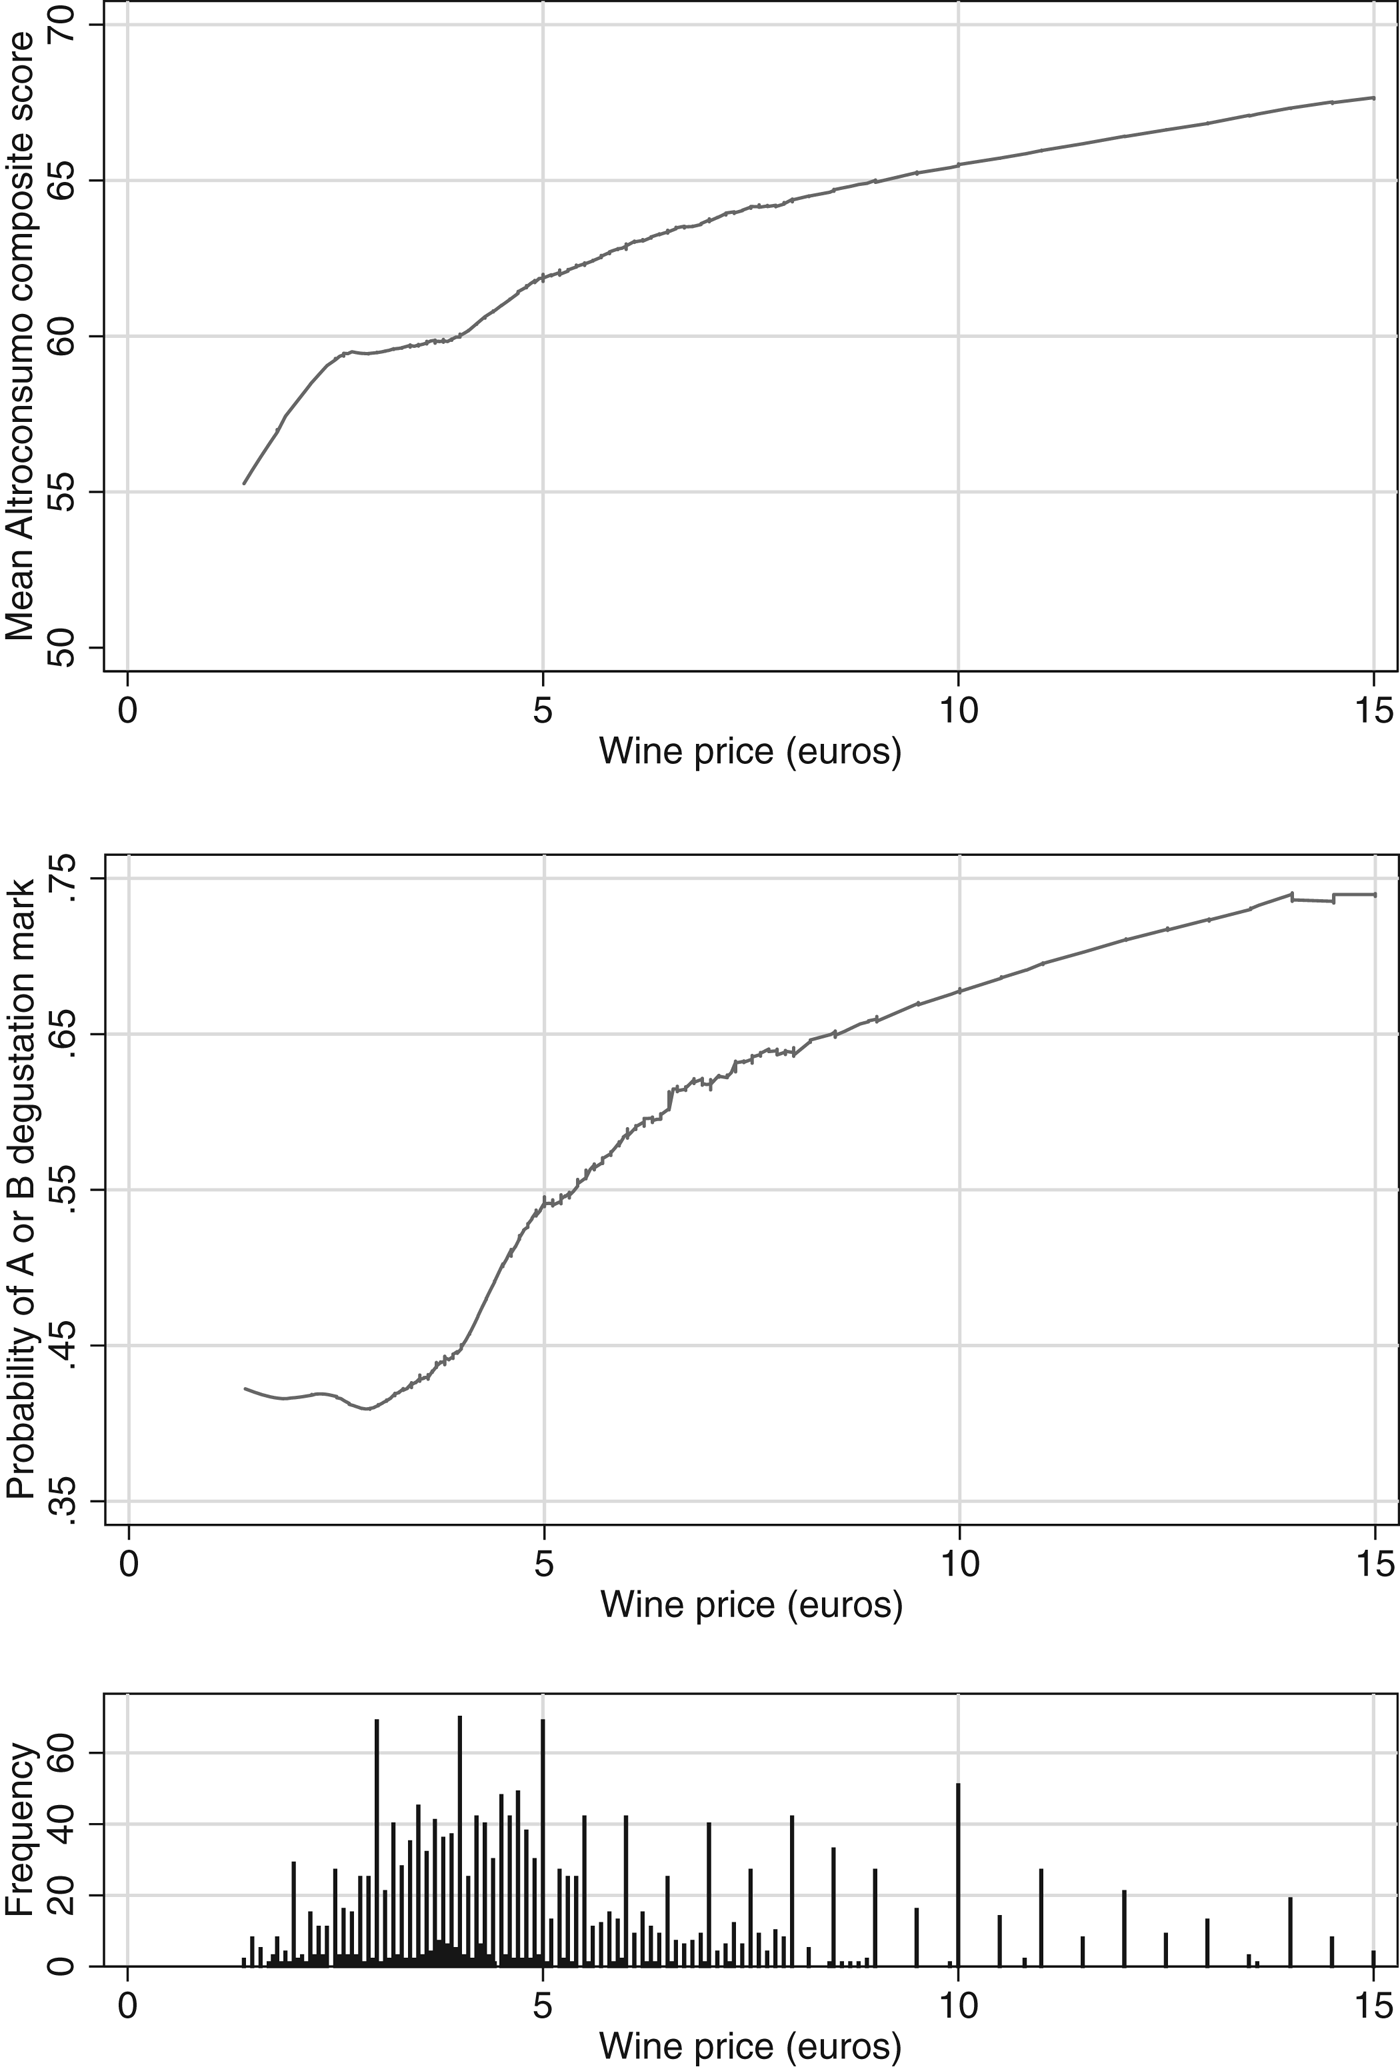
Generally, there is a positive relationship between wine prices and Altroconsumo ratings in the sample. Figure 1 shows a nonparametric regression estimate (LOWESS) of the relationship between price and two quality measures: the average composite score and the probability of getting a high (A or B) degustation grade (the last panel shows the frequency of wine prices). This relationship seems particularly strong for lower prices.
Relationship Between Wine Price and Altroconsumo Quality Measures. Lowess Smoother, 50% Bandwidth
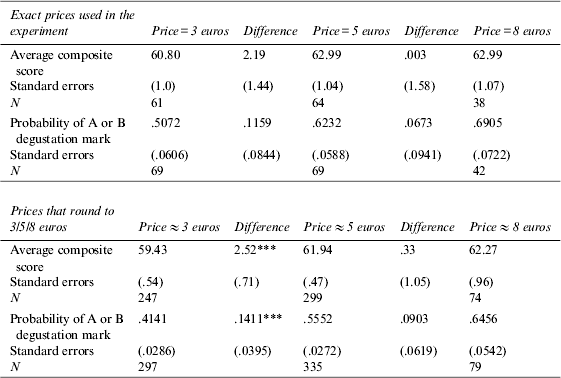
Since the ratings are available for a large number of wines in the price range between 3 and 8 euros, we could directly measure the price-quantity relationship at the price points in our experimental data. The upper half of Table 4 shows the average composite score and the probability of A or B degustation marks for wines with prices exactly equal to 3, 5, and 8 euros. The bottom half of the table compares average quality measures for larger samples of wines whose rounded prices are equal to the price points in our experimental data. The results using the composite quality score match experimental findings most closely: the average scores of 5-euro wines are significantly higher than those of 3-euro wines, while there is only a negligible difference between the average scores of 5- and 8-euro wines. The probability of getting an A or B degustation mark is also significantly higher for 5-euro wines than for 3-euro wines. This probability rises less when moving from 5 euros to 8 euros.
Price–Quality Relationship in Altroconsumo Wine Ratings
The strength of the price–quality relationship could also be measured through their correlation. The correlation between price and composite score equals 0.1087 for prices between 3 euros and 5 euros. For the 5–8-euro price range, the correlation is only 0.0253. The correlations between price and an indicator of A/B degustation mark equal 0.0963 for the lower price range and 0.0392 for the higher price range.
Assuming that Altroconsumo wine ratings are aligned with consumer preferences, rational consumers should take 5 euros as a signal of higher quality than 3 euros, but treat 5 euros and 8 euros as signals of fairly similar quality. Their behavior in the wine-tasting experiment is thus consistent with using price as a signal of quality. Note that Altroconsumo reviews many more wines in the 3–5-euro range than in the 5–8-euro range (this is clearly visible in Figure 1), which may be one of the mechanisms by which consumers are more informed about quality in this segment of the market, and producers have to set prices more in line with the quality. This relationship may be reversed at higher prices, since wine critics are particularly interested in reviewing the best wines.
VII. Conclusions
Our paper isolates and measures the signaling effect of price on wine demand by exploiting the experimental nature of our data. In line with Plassmann et al. (Reference Plassmann, O'Doherty, Shiv and Rangel2008), we find a larger signaling effect of price for lower-priced wines. The signaling effect is positive when going from a low (3 euros) to a medium price (5 euros), but is essentially zero when going from a medium to a high price (8 euros).
Consumers are rational in responding to price signals in this way. In data on price and quality for the Italian wine market, we find a strong positive price–quality relationship for wines in the 3–5-euro price range, but not in the 5–8-euro price range. Lack of a strong positive price–quality relationship at higher prices may be driven by differences in the costs of marketing and distributing wine of different quality. It may also depend on more complicated price strategies by the producers, which might even interact with their reputation. Since we lack product-level time-series data on wines, we leave such questions to future research.
We also find that older consumers appear to be better able to appreciate actual quality than young consumers, which gives more weight to the signaling of quality rather than status (unless we think that the desire to signal status decreases with age).