Nomenclature
-
 ${k_c}$
-
cord volume fractions
-
${k_r}$
-
rubber volume fractions
-
${k_v}$
-
void volume fractions
-
${v_r}$
-
rubber Poisson’s ratio
-
${v_{c12}}$
-
cord Poisson’s ratio along the in-plane direction
-
${v_{c23}}$
-
cord Poisson’s ratio along the transverse-normal direction
-
${E_{11}}$
-
ply stiffness along the longitudinal direction
-
${E_{22}}$
-
ply stiffness along the transverse direction
-
${E_r}$
-
rubber stiffness
-
${E_{c11}}$
-
cord stiffness along the longitudinal direction
-
${E_{c22}}$
-
cord stiffness along the transverse direction
-
${G_r}$
-
rubber shear modulus
-
${G_{c12}}$
-
cord shear modulus along the in-plane direction
-
${G_{c23}}$
-
cord shear modulus along the transverse-normal direction
-
${S_{c11T}}$
-
cord tensile strength along the longitudinal direction
-
${S_{c11C}}$
-
cord compressive strength along the longitudinal direction
-
${S_{rT}}$
-
rubber tensile strength
-
${S_{rC}}$
-
rubber compressive strength
-
${S_{rS}}$
-
rubber shear strength
-
$\tilde p$
-
absolute pressure
-
${p_A}$
-
pressure of the surrounding environment
-
$p$
-
pressure inside the cavity
-
$\theta $
-
ambient temperature
-
$K$
-
bulk modulus of the fluid


1.0 Introduction
When aircraft land, their tyres are most prone to blast failure. The strong airflow or debris generated by tyre blasting may damage the wing, flat tail, landing gear, etc., causing significant safety risks [Reference Kondé, Rosu and Lebon1]. The failure usually occurs when the tyres are exposed to harsh conditions. In fact, there may have been microscopic damage to the tyres before this, which has not been detected.
The cord-rubber composite is the primary structural material of aircraft tyre, which is composed of a cord reinforcement phase and the rubber matrix. Clark [Reference Clark2] and Gough [Reference Gough3] were the first to explore the elastic mechanical properties of cord-rubber composites systematically. Subsequent research on these composites has advanced significantly, both in theoretical frameworks and through simulations. Cord-rubber composites are often used under harsh conditions and have mechanical behaviours such as large deformation and high strain rate. The hyperelastic constitutive relation is often used to fit high-elastic materials such as rubber. The typical ones are the Mooney-Rivlin model [Reference Rivin4], the Ogden model [Reference Ogden5] and the Arruda-Boyce model [Reference Arruda and Boyce6] based on continuum mechanics theory. In recent years, research on the theory of cord-reinforced rubber composites has begun to consider the strain rate effect. Pouriayevali [Reference Pouriayevali, Guo and Shim7] proposed an integral-form viscoelastic constitutive equation to describe the response of elastomers to large deformations under high strain rates. Tsai et al. [Reference Yao, Yue, Geng and Wang8] established a viscoplastic model to characterise polymer composites’ high strain rate response to describe the nonlinear rate-dependent behaviour. Gan [Reference Gan, Wei and Fang9] established the viscoelastic constitutive relationship of rubber composites, which can explain the nonlinear behaviour under impact or explosion. Levin et al. [Reference Levin, Zingerman and Vershinin10] used the finite element simulation method to study the relationship between the tensile properties, cord spacing and cord angle by establishing the finite element models of single cord-rubber composites and double cord-rubber composites, respectively. Wei et al. [Reference Wei and Olatunbosun11] used the finite element analysis method to study the effects of cross-sectional area, spacing, vertex angle and strength of cord-rubber composites on tyre relaxation length. Kim et al. [Reference Kim, Park and Moon12] characterised the superelastic and viscoelastic properties of rubber through material tests and material models and found that cord diameter, spacing, elastic modulus and reinforced crown angle controlled tyre relaxation length.
In the tyre industry, the finite element method is employed to model the structure of cord-rubber composites. This approach involves macro-scale modelling, wherein rebar elements representing fibres are embedded within solid hyperelastic rubber elements [13]. L’Anson et al. [Reference L’Anson, Pena and Postic14] discussed Michelin’s application of FEA to the design of aircraft tyres and gave examples of its application in tyre and rim contact pressure analysis. They verified the main landing gear tyres’ finite element analysis predictions and experimental results. Behroozie et al. [Reference Behroozi, Olatunbosun and Ding15] developed three finite element models to determine the accuracy of model results for different types of analysis by comparison with measured test data, where hyperelastic material properties were assumed for simulating cord-rubber composites. Li and Schindler [Reference Li and Schindler16] used the analytical method and finite element method to simulate the tyre-soil interaction through dampers, considering the soil-damping effect. The laminated shell and steel bar elements in ABAQUS represent the tyre cord-rubber composites, which have anisotropic and nonlinear mechanical properties. Wei and Olatunbosun [Reference Wei and Olatunbosun17] carried out the numerical simulation of the tyre crossing obstacles of different sizes by using the verified tyre finite element model in ABAQUS. Compared with the experiment, satisfactory dynamic response results were obtained. Baranowski et al. [Reference Baranowski, Malachowski and Janiszewski18] considered the viscoelasticity of rubber material, observed the arrangement of tyre cord by using CT technology and electron microscopy, established a FEA model of truck tyre type 315/70 R 22.5. The free fall process of the tyre was simulated and compared with the experimental results, and it was found that the test results were close to the simulation results. Guo et al. [Reference Guo, Bastien and Blundell19] found that the superelasticity of the material has a significant influence on the results of finite element simulation, modified the superelastic constitutive model of rubber and cord, simplified the rim and ground as a rigid body and established a detailed bias aircraft tyre model by LS-Dyna. Finally, the response characteristics of aircraft tyres from soft landing to hard landing are dynamically analysed. Yao et al. [Reference Yao, Yue and Geng20] developed a comprehensive aircraft tyres model, which incorporates data from reliable rubber material tests. The landing process of aircraft tyres was numerically simulated using the CV and CPM methods. The outcomes of these simulations closely align with the experimental data, and dynamic simulations are carried out for different landing weights and vertical landing speeds. Baranowski et al. [Reference Baranowski, Malachowski and Mazurkiewicz21] simulated the interaction between the tyre and the local shock wave of a military logistics truck to improve the explosion resistance of the tyre. The main problem in the calculation is estimating the rope angle’s influence in each layer.
In the previous tyre research, the cord-rubber composite material was usually used as a macroscopic model, and the rebar element was used as the cord to be embedded in the solid superelastic rubber element. In this way, the matrix and the rebar element share the same node; the shear response can not be obtained, so tyre analysis has some limitations. Damage initiation occurs at the cord-rubber interface or within individual components in tyre rubber-cord composites. Analyses need to incorporate the properties of the constituent materials to assess failure at this level accurately. The absence of such detailed knowledge impedes the application of micromechanics-based theories in evaluating the structural damage progression in tyres throughout their service life. Therefore, this work aims to put forward a cross-scale simulation method to model the cord-rubber composites in aircraft tyres more accurately and to analyse the dynamic landing of aircraft tyres under the impact on this basis. The study investigated the effects of void volume fraction, cord volume fraction and material scale factor in composites on tyre deformation history and overall impact force.
2.0 Multi-scale analysis method of aircraft tyres
2.1 Material characterisation
In the traditional modelling method of tyre cord-rubber composites, the shear stress between cord elements is calculated by establishing fine mesh in the cord region at the macro level. This modelling method makes the calculation very inefficient, and it is also impossible to analyse the influence of the structural characteristics of the cord-rubber composite components on tyre performance at the microscopic level. In previous tyre analyses, the properties of rubber cord composites need to be obtained through expensive material testing, and this method is not efficient. In this paper, a micromechanical analysis theory proposed by Chamis et al. [Reference Chamis, Abdi and Garg22] is employed to simulate the belt layer region of aircraft tyres. By analysing the in-plane performance derived from five standard American Society for Testing and Materials (ASTM) tests, the mechanical properties of the cord rubber composite can be reverse-engineered, effectively capturing the influence of failure in cord-rubber composite on the impact behaviour during aircraft tyres landing. These tests include longitudinal and transverse tension (ASTM D3039), longitudinal and transverse compression (ASTM D6641) and in-plane shear (ASTM D3518).
Following this reverse engineering process, the effective Young’s modulus, Poisson’s ratio, and the longitudinal tensile and compressive strengths of the cord/rubber composite can be assayed. The predictive equations, grounded in micromechanics theory, estimate the ply modulus, Poisson’s ratio, and strengths as outlined in the Ref. [Reference Murthy and Chamis23].
Modification for voids in tyres cord and rubber volume fractions:
 \begin{align}{\bar k_c} = \left( {1 - {k_v}} \right){k_c}\end{align}
 \begin{align}{\bar k_r} = \left( {1 - {k_v}} \right){k_r}\end{align}
where
 ${k_c}$
,
 ${k_r}$
and
 ${k_v}$
are cord, rubber and void volume fractions, respectively.
 ${\bar k_c}$
,
 ${\bar k_r}$
are the corrected parameters in tyres analysis.
Ply Poisson’s ratio:
 \begin{align}{v_{12}} = {v_r} + {\bar k_c}\left\{ {{v_{c12}} - {v_r}} \right\}\end{align}
 \begin{align}{v_{13}} = {v_{12}}\end{align}
 \begin{align}{v_{23}} = {\bar k_c}{v_{c23}} + {\bar k_r}\left( {2{v_r} - \frac{{{E_{22}}}}{{{E_{11}}}}{v_{12}}} \right)\end{align}
where
 ${v_r}$
,
 ${v_{c12}}$
and
 ${v_{c23}}$
are the rubber Poisson’s ratio, cord Poisson’s ratio along the in-plane direction and cord Poisson’s ratio along the transverse-normal direction, respectively.
 ${E_{11}}$
is the ply stiffness along the longitudinal direction,
 ${E_{22}}$
is the ply stiffness along the transverse direction.
Ply stiffness:
 \begin{align}{E_{11}} = {\bar k_c}{E_{c11}} + {\bar k_r}{E_r}\end{align}
 \begin{align}{E_{22}} = \frac{{{E_r}}}{{1 - \sqrt {{{\bar k}_c}} \left\{ {1 - \frac{{{E_r}}}{{{E_{c22}}}}} \right\}}}\end{align}
 \begin{align}{E_{33}} = {E_{22}}\end{align}
where
 ${E_r}$
is the rubber stiffness,
 ${E_{c11}}$
is the cord stiffness along the longitudinal direction and
 ${E_{c22}}$
is the cord stiffness along the transverse direction.
Ply shear modulus:
 \begin{align}{G_{12}} = \frac{{{G_r}}}{{1 - \sqrt {{{\bar k}_c}} \left\{ {1 - \frac{{{G_r}}}{{{G_{c12}}}}} \right\}}}\end{align}
 \begin{align}{G_{22}} = \frac{{{G_r}}}{{1 - \sqrt {{{\bar k}_c}} \left\{ {1 - \frac{{{G_r}}}{{{G_{c23}}}}} \right\}}}\end{align}
 \begin{align}{G_{13}} = {G_{12}}\end{align}
where
 ${G_r}$
is the rubber shear modulus,
 ${G_{c12}}$
is the cord shear modulus along the in-plane direction and
 ${G_{c23}}$
is the cord shear modulus along the transverse-normal direction.
Ply longitudinal tensile strength:
 \begin{align}{S_{11T}} = {\bar k_c}{S_{c11T}}\end{align}
where
 ${S_{c11T}}$
is the cord tensile strength along the longitudinal direction.
Ply longitudinal compressive strength:
 \begin{align}{S_{11C}} = {\bar k_c}{S_{c11C}}\end{align}
where
 ${S_{c11C}}$
is the cord compressive strength along the longitudinal direction.
Ply transverse tensile strength:
 \begin{align}{S_{22T}} & = \left\{ {1 - \left( {\sqrt {{V_c}} - {V_c}} \right)\left( {1 - {E_r}/{E_{c22}}} \right)} \right\}\nonumber\\& * {S_{rT}}\left( {\left[ {1 - \sqrt {4{V_v}/\pi \left( {1 - {V_c}} \right)} } \right]} \right)\end{align}
where
 ${V_c}$
is the cord volume fraction,
 ${S_{rT}}$
is the rubber tensile strength and
 ${V_v}$
is the void volume fraction.
Ply transverse compressive strength:
 \begin{align}{S_{22C}} & = \left\{ {1 - \left( {\sqrt {{V_c}} - {V_c}} \right)\left( {1 - {E_r}/{E_{c22}}} \right)} \right\}\nonumber\\& * {S_{rS}}\left( {\left[ {1 - \sqrt {4{V_v}/\pi \left( {1 - {V_c}} \right)} } \right]} \right)\end{align}
where
 ${S_{rS}}$
is the rubber compressive strength.
Ply in-plane shear strength:
 \begin{align}{S_{12S}} & = \left\{ {1 - \left( {\sqrt {{V_f}} - {V_f}} \right)\left( {1 - {G_r}/{G_{c22}}} \right)} \right\}\nonumber\\& * {S_{rS}}\left( {\left[ {1 - \sqrt {4{V_v}/\pi \left( {1 - {V_f}} \right)} } \right]} \right)\end{align}
where
 ${S_{rS}}$
is the rubber shear strength.
As demonstrated, the ply strength of tyres can be calculated by analysing the tensile, compressive and shear strengths of both the cord and rubber components. Specifically, the longitudinal tensile and compressive strengths of the layers are predominantly determined by the characteristics of the cord, whereas the transverse tensile, compressive and in-plane shear strengths of the layers are primarily influenced by the rubber’s mechanical properties.
2.2 Multi-scale progressive analysis
Cord-rubber composites have multi-scale characteristics, including the macro-scale of the laminate structure, the mesoscale of the component materials and microscopic scales such as pore spaces and microcracks. Due to its multi-scale characteristics, the damage, failure and stiffness reduction of cord-rubber composite structures in aircraft tyres during impact loading also shows strong multi-scale characteristics. The composite material micromechanics method considers the damage and failure behaviour of the component materials at the microscopic scale under external loads. The existing computing power and calculation efficiency are limited if the analytical model is established entirely from the microscopic scale. Therefore, it is necessary to develop a multi-scale analysis method to establish the connection between macroscopic structures and microscopic physical phenomena to ensure the high efficiency of macroscopic analysis and the accuracy of microscopic models. This work uses a multi-scale progressive analysis method to consider the effects of cord-rubber composite microscopic void volume fraction, cord volume fraction and material scale factor of composites on tyre deformation history and overall impact force; the basic calculation process is shown in Fig. 1.
The aircraft tyre multi-scale progressive analysis process.

The multi-scale progressive analysis of cord-rubber composite structure in aircraft tyres is mainly divided into three steps:
-
(1) Analyse the macrostructure of aircraft tyres, taking into account the macrostructure design, material properties, plying methods and overall influence of the loading mode of the structure on the stress and strain distribution inside the structure.
-
(2) Analyse the key tyre belt region using the multi-scale analysis method. The loading conditions of the macroscopic structural elements or integration points are transferred to the microscopic unit cell model. The maximum stress — or strain-based failure criterion is used to judge the failure of the rubber and cord, respectively.
-
(3) The material stiffness of the damaged corresponding element is reduced, and after homogenisation processing, the macroscopic properties of the damaged material are assigned to the corresponding element in the macrostructure. The macroscopic structure is reanalysed and iterated until convergence, at which point it enters the next iteration step.
This paper uses the commercial finite element analysis software ABAQUS/Standard to complete the multi-scale analysis and realise the coupling among different scale models. The information transfer between the macroscopic structural finite element model and the microscopic finite element model is established through a user-defined subroutine UMAT (User subroutine to define a Material’s mechanical behaviour) in ABAQUS. The finite element calculation framework for the multi-scale analysis of aircraft tyres is shown in Fig. 2.
The finite element calculation framework for multi-scale analysis of aircraft tyre.

The following functions are mainly implemented in UMAT [Reference Behroozinia, Taheri and Mirzaeifar24]:
-
(1) SDV (state-dependent variables) is used in UMAT to record the damage status of macroscopic and corresponding microscopic model elements. In instances where damage is induced by tension, the stiffness of the macro model element is diminished to 1% of its initial elastic modulus. If the damage results from shear, the stiffness is reduced to 10% of the initial elastic modulus, and if it stems from compression, the reduction is to 20% of the initial elastic modulus.
-
(2) Transfer the failed microscopic model element information recorded in SDV to the microscopic model, reduce the material properties of the corresponding microscopic element, and apply the load conditions.
-
(3) Process the microscopic model result file(.odb) in PDE, extract the stress of the microscopic model elements to conduct failure judgements on the microscopic model elements that did not fail in the previous step, and then store the failed element information in an external file. Finally, the information on the new failed element is returned to SDV.
-
(4) Return all the microscopic failure element information in the SDV to the unit cell model and apply the load conditions to solve the macroscopic elastic modulus.
3.0 The aircraft tyre numerical modeling details
The structure of aircraft tyres is inherently complex, comprising components such as tread, sidewalls, inner liners, belts, rims, etc. Additionally, the landing process of aircraft tyres is intricate. To accurately simulate the working conditions, developing a detailed and precise finite element model of aircraft tyres is essential. The aircraft tyre involved in this study is the 680 × 220 aircraft tyre provided by Guilin Lanyu Aircraft Tyre Development Co., Ltd. (Guilin, China).
3.1 The fluid cavity element simulates the effects of inflation pressure
In the analysis of automobile tyres, the effect of internal pressure is minimal due to the relatively small loads and deformations encountered during simulations. Consequently, researchers often utilise a distributed pressure approach to simulate the inflation pressure of these tyres. In contrast, aircraft tyres undergo significant deformation during operation, and this volume change substantially impacts the internal inflation pressure, which cannot be overlooked. The ABAQUS simulation platform offers a surface-based fluid cavity element capable of simulating a closed structure filled with air or liquid. This study employs the fluid cavity element to model the air pressure within aircraft tyres, capturing the variations in internal air pressure resulting from tyre deformation during landing, as shown in Fig. 3.
Finite element model based on surface fluid cavity element.

Assuming that the air within the aircraft tyre behaves as an ideal gas, the Equation of state for an ideal gas is expressed as follows:
 \begin{align}\tilde p = \rho R\left( {\theta - {\theta ^z}} \right)\end{align}
 \begin{align}\tilde p = p + {p_A}\end{align}
Where
 $\tilde p$
is the absolute pressure,
 ${p_A}$
is the pressure of the surrounding environment,
 $p$
is the pressure inside the cavity,
 $R$
is the gas constant,
 $\theta $
is the ambient temperature,
 ${\theta ^z}$
is absolute zero,
 $R$
can also be determined by the universal gas constant
 $\tilde R$
and the molecular mass of the gas
 $MW$
:
 \begin{align}R = \frac{{\tilde R}}{{MW}}\end{align}
The current fluid volume can be expressed as:
 \begin{align}\bar V = \sum {{{\bar V}^e}} \left( {p,\theta } \right) = \sum {m^e/\rho } = m/\rho\end{align}
Then the corresponding volume pressure can be satisfied as:
 \begin{align}\frac{{d\bar V}}{{dp}} = - \frac{m}{{{\rho ^2}}}\frac{{d\rho }}{{dp}} = - \frac{{mR\left( {\theta - {\theta ^z}} \right)}}{{\left( {p + {p_A}} \right)}}\end{align}
The compressibility of a fluid can be expressed by its bulk modulus:
 \begin{align}p = - K\left( {\frac{{V - {V_0}}}{{{V_0}}}} \right) = - {K_{\rho R}}\left( {{\rho ^{ - 1}} - \rho _0^{ - 1}} \right){V_0}\end{align}
Where
 $K$
is the bulk modulus of the fluid,
 $V$
is the current volume of the fluid,
 $\rho $
is the density at the current pressure,
 ${\rho _0}$
is the density at the current temperature when the air pressure is zero,
 ${V_0}$
is the volume at the initial temperature when the pressure is zero.
3.2 Numerical model of the aircraft tyre
This study divides a 680 × 220 aircraft tyre model into nine sections, as illustrated in Fig. 4. The radial tyre features cords that extend to the bead at an angle of approximately 90° relative to the centreline of the tread. A circumferential belt serves to stabilise the carcass. In developing the finite element model, simplifications can be made to ensure accurate simulation results are obtained under convergence conditions, provided the actual requirements permit. The simplifications include the following:
-
(1) Consideration of only the longitudinal tread grooves.
-
(2) The assumption is that the road surface behaves as a rigid body.
Finite element model of aircraft tyre section.

The Mooney-Rivlin constitutive Equation characterises the nonlinear properties of rubber. The analysis utilises a total of 22,800 C3D8R elements, which are 8-node linear hexahedra with reduced integration. The deformation potential energy within the Mooney-Rivlin model is quantified using a specific Equation:
 \begin{align}U = \sum\limits_{i = 1}^N {{C_{i0}}} {\left( {{{\bar I}_1} - 3} \right)^i} + \sum\limits_{i = 1}^N {\frac{1}{{{D_i}}}{{\left( {{{\bar J}_{e1}} - 1} \right)}^{2i}}} \end{align}
The strain energy potential (
 $U$
), elastic volume ratio (
 ${\bar J_{e1}}$
), first invariant of the deviatoric strain (
 ${\bar I_1}$
), shear behaviour parameter (
 ${C_{i0}}$
) and compressibility parameter (
 ${D_i}$
) are key parameters used to characterise rubber materials.
The viscoelastic material property response is modeled as follows [Reference Wei and Olatunbosun17]:
 \begin{align}{g_R}\left( t \right) = 1 - \sum\limits_{i = 1}^N {\bar g_i^p\left( {1 - {e^{ - t/\tau _i^G}}} \right)} \end{align}
where
 $\bar g_i^p$
and
 $\tau _i^G$
are the material constants determined by modeling the physical test in ABAQUS [Reference Wei and Olatunbosun17]. Table 1 provides a summary of the rubber material parameter values utilised in this study.
Rubber material parameter values

The reinforced material properties are assumed to be homogeneous and orthotropic. The model defines the belt layer using SFM3D4R surface elements, with the reinforced layers BELT-1 and BELT-2 comprising 2,600 and 2,400 finite elements, respectively. For the tyre bead section, 1,200 C3D8R finite elements are employed for discretisation. The steel cord is represented as an elastic material. Table 2 summarises the reinforced material parameter values utilised in this study.
The reinforced material parameter values

Two different approaches to model the cord-rubber composite: (a)rebar element approach, and (b)micromechanical-base element approach.

To analyse the mechanical properties of cord-rubber composites, rebar elements are commonly utilised in tyre structures. In this approach, the rebar element represents the cord, while the solid element represents the rubber. However, this method cannot capture the shear response in tyre structures and evaluate the structural damage evolution of aircraft tyres during service. To address this limitation, a micromechanics-based element is introduced in this study to model the cord-rubber composite, as illustrated in Fig. 5. Subsequent tyre analyses will compare two different modelling approaches. The impact load scenario simulation was performed on a 16-core AMD Ryzen 9 3950X supercomputer (Dell), equipped with 2 CPUs operating at 1.6 GHz per core. The entire simulation process required one hour to complete.
4.0 The aircraft tyre experiment and validation
The aircraft tyre testing apparatus includes several key components: an impact platform, a low-friction sliding mechanism, a lifting system, a fixture system and a data acquisition system, as depicted in Fig. 6. The impact test is conducted in a free-fall manner, utilising an effective impact weight (comprising a basket and additional weight) to replicate the impact load and imitating vertical velocity by adjusting the height of the basket with a concrete slab emulating the road surface. The slide rails must exhibit a requisite degree of smoothness to minimise friction. The impact platform is supported by three pillars, which contain load sensors. The load sensors assessed the vertical load applied to the tyre. Additionally, a displacement sensor measured the vertical deflection resulting from tyre compression. The entire control system consists of three primary components: a hydraulic system, a lifting mechanism and a remote control system. After the electric motor lowers the basket to the predetermined height and secures the hook, the impact system descends and acquires test data once the system is securely in place. A 24-channel, concurrent working, 100–512 kHz frequency impact test data acquisition system capture the data collected during the impact test. A computer is employed for data recording and overseeing the position and release of the impact mass. Furthermore, a high-speed camera documents the experiment.
Aircraft tyre test platform.

4.1 Static load scenario validation
In this case, the tyre modelling involves two sequential stages: the generation of a two-dimensional axisymmetric inflation model and the development of a three-dimensional symmetric static load model. The two-dimensional axisymmetric inflation model is applied to the corresponding rim. The tyre is inflated to the recommended 630 kPa value specified by the manufacturer. The static loaded radius of an aircraft tyre is defined as the vertical distance from the axle centreline to the tyre surface when the tyre is initially inflated to its rated pressure and subsequently subjected to its rated load, as illustrated in Fig. 7. According to FAA regulations, both tyre pressure and load must maintain the static loaded radius within specified limits [Reference Yao, Yue and Geng20]. The study compared the influence of the fluid cavity element and uniform pressure on the sidewall in simulating tyre inflation pressure under static load conditions.
The static loaded radius of an aircraft tyre.

Figure 8 displays the vertical load-deformation curves of the tyre under various vertical loads at a rated inflation pressure of 630 kPa. The static deformations of aircraft tyres are 20.0 mm, 18.1 mm, 16.2 mm, 12.1 mm and 10.0 mm at test loads of 5,000 N, 4,500 N, 4,000 N, 3,500 N, 3,000 N and 2,500 N, respectively. The change curve of the vertical load and deformation of the aircraft tyre indicates that simulating inflation pressure in the way of the fluid cavity element closely aligns with experimental results. Therefore, the volume changes caused by the deformation of aircraft tyres during operation significantly impact the internal inflation pressure, which cannot be ignored. Furthermore, the numerical simulation results exhibit strong consistency with the experimental results and previous research findings [Reference Guo, Bastien and Blundell19].
Deformation versus vertical load curves in static load scenario.

4.2 Impact load scenario validation
The aircraft tyre impact process was simulated using dynamic numerical calculations in ABAQUS, as depicted in Fig. 9. In this study, a rigid model was employed to simulate non-deformable ground. The tyre-ground interaction utilised the penalty method and a friction coefficient was set to 0. A concentrated mass was placed at the tyre’s centre to simulate the aircraft’s weight, and gravitational forces were applied to the entire tyre model. Additionally, the vertical landing speed was introduced by setting a predefined initial velocity field for the model. The initial boundary conditions in the finite element analysis (FEA) aligned with those established in tyre impact experiments. The entire tyre impact process is conducted with an impact mass of 300 kg, an inflation pressure of 630 kPa, and an impact vertical velocity of 2 m/s.
The aircraft tyre impact process in ABAQUS.

The tyre impact test platform measures the aircraft’s deformation and impact load using displacement and force sensors. Figure 10 displays the load curve in the impact test and the tyre load curve simulated by two different model methods. The tyre model simulation in the micromechanical-base element approach is more closely related to the experimental results than the model simulated in the rebar element approach. The time of the peak value in the numerical simulation varies slightly under two different model methods, with a certain lag observed in the model that simulates the rebar element approach. Furthermore, it is apparent that the tyre load steadily increases before reaching its peak at 0.36 s, at which point the tyre is compressed to its maximum deformation.
The aircraft tyre experiment and simulation in impact load.

5.0 Results
The deformations of aircraft tyres were determined through numerical analysis. The time history of tyre deformations (impact mass is 300 kg, inflation pressure is 630 kPa, and impact vertical velocity is 2 m/s) during the landing process is illustrated in Fig. 11. During the ongoing compression of the aircraft tyre, the deformation contour of the tyre at three time points is compared with the actual test images captured by the high-speed camera, and the findings indicate that the simulation yields favourable results. The vertical displacement of the tyre is primarily distributed across the tread and sidewalls, representing a typical pattern of tyre deformation. This observation underscores the significant influence of the tyre’s lateral stiffness on its deformation.
Variation curve of tyre deformation in impact process.

It is evident from Fig. 11 that the tyre deformation continuously increases until it reaches a peak value of 53.2 mm at 0.36 s. Subsequently, the tyre deformation begins to decrease, indicating that it reached its maximum deformation at t = 0.36 s and started to rebound, consistent with Fig. 10. It is important to note that the deflections of aircraft tyres do not increase linearly with time. Instead, the rate of increase in deformation shows a pattern of initial increase followed by a decrease as time progresses. This behaviour can be attributed to the unique structure of aircraft tyres, which enables them to absorb impact energy during landing. Additionally, voids and damage within the cord rubber composite contribute to these outcomes.
Composite structures frequently incur damages and voids during manufacturing and service phases, adversely affecting their performance. The void volume fraction is a critical factor influencing the mechanical properties of laminated composites. Equations (1) and (2) illustrate the impact of void volume fraction on the stiffness of these materials. Increasing the void volume fraction impacts the volume fractions of both the cord and the rubber matrix, consequently diminishing the strength of the composite. Figure 12 illustrates the damage of the belt layer area of the tyre model at different void volume fractions. The simulation results indicate that the primary failure mode is shear within the belt region, with areas of damage depicted in red. Notably, the composite with a void volume fraction of 0 has fewer damaged elements than the composite with a void volume fraction of 0.05.
The damage of the belt layer area of the tyre model at different void volume fractions: (a)Kv = 0 and (b)Kv = 0.05.

6.0 Discussion
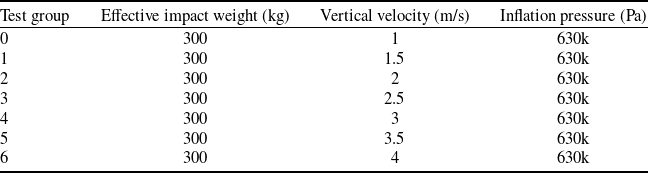
The results from finite element simulation and experiments indicate that the multi-scale modelling method of cord rubber composite in aircraft tyres has been successfully achieved. Figures 13–15 compare and analyse the effects of three parameters on the impact maximum force of aircraft tyre landings: material void volume fraction, cord volume fraction and material scale factor. The test and simulation conditions are outlined in Table 3.
The influence of void volume fraction on the maximum impact force.

The test and simulation conditions

The influence of cord volume fraction on the maximum impact force.

The influence of scale factor on the maximum impact force.

The aircraft tyre multi-scale model was simulated using void volume fractions of 0, 0.05 and 0.15 for the cord rubber composite material. The study compared the maximum impact force of the tyre under various impact velocities, as depicted in Fig. 13. The graph represents a positive correlation between impact load and land speed. Additionally, at a consistent impact velocity, a higher void volume fraction results in a lower maximum impact force that the tyre can endure. As the void volume fraction increases, the maximum impact force’s growth rate initially accelerates before decelerating. This phenomenon can be attributed to voids within the cord-rubber composite material, which diminishes the strength of the tyre belt layer. Consequently, this reduction in strength leads to a decrease in overall tyre stiffness and an increase in the contact area between the tyre and the ground. It is crucial to note that the tyre load remains within an acceptable range under simulated conditions. However, when the impact velocity or effective impact mass exceeds a certain threshold, an increase in void volume fraction heightens the risk of failure and damage to aircraft tyres.
The impact force of the tyre at various impact velocities is depicted in Fig. 14 for different cord volume fractions of cord-rubber composite materials. The cord volume fraction is a crucial characteristic that significantly influences the performance of composite materials under diverse loading conditions. As indicated in Equations (6) and (7), an increase in the cord volume fraction leads to enhanced strength and stiffness of the cord rubber composite material and an overall increase in the tyre’s stiffness. Consequently, the tyre’s deflection decreases, the radius of the tyre contact area increases, and a higher cord volume fraction corresponds to a greater maximum impact force that the tyre can endure.
The thickness of the cord rubber composite material in tyres can be modified by a parameter known as the scale factor, which dictates the number of cords incorporated into the rubber laminate. As illustrated in Fig. 15, an increase in the scale factor of the composite material correlates with a reduction in the maximum impact force that the tyre can endure at a constant impact speed. This phenomenon arises from the influence of the scale factor on the strength and stiffness of the composite material, ultimately affecting the overall strength and stiffness of the tyre. This observation aligns with the findings of Behroozinia et al. [Reference Behroozinia, Taheri and Mirzaeifar24], which indicates that a higher scale factor in composite materials leads to diminished overall strength.
7.0 Conclusions
This paper presents a novel multiscale analytical model for tyre cord rubber composites that accounts for the effects of manufacturing and service process-induced defects(including void volume fraction, cord volume fraction and laminate thickness) on the maximum impact force experienced by aircraft tyres during landing scenarios. The findings of this study hold significant implications for tyre design and engineering, as well as for the understanding of factors influencing tyre performance and safety.
The study first investigated the effects of the fluid cavity element and uniform pressure on the sidewall in simulating tyre inflation pressure under static load. The results indicate that the fluid cavity element more closely corresponds to experimental findings. As such, the volume changes resulting from the deformation of aircraft tyres during operation significantly affect the internal inflation pressure. Subsequently, the dynamic response simulation and test of aircraft tyre landing were carried out. The simulation results under the impact load of the tyre model based on the micromechanical-base element approach show good consistency with the experimental results. Finally, the influence of void volume fraction, cord volume fraction and material scale factor on the maximum impact force of aircraft tyres was systematically compared and analysed. The findings indicate that the maximum impact force decreases with increased void volume fraction and scale factor. In contrast, an increase in cord volume fraction correlates with a rise in the maximum impact force. The variations in maximum impact force arising from changes in tyre structural strength and deformation can be explained by modifications in specific material parameters.
Acknowledgments
Supported by Natural Science Foundation of Hunan Province of China(No.2024JJ6431).