Rice is a considerable source of anthropogenic methane (CH4), accounting for about 5–19% of the global CH4 emission (Smith et al. Reference Smith, Martino, Cai, Gwary, Janzen, Kumar, McCarl, Ogle, O'Mara, Rice, Scholes, Sirotenko, Howden, McAllister, Pan, Romanenkov, Schneider and Towprayoon2007). CH4 emission from paddy soils is closely related to human activity. The return of rice straw (RS) to fields is a common practice in soil nutrient management and provides degradable organic carbon, nitrogen and other plant nutrients (Tirol-Padre et al. Reference Tirol-Padre, Tsuchiya, Inubushi and Ladha2005), but usually increases CH4 production (Conrad et al. Reference Conrad, Klose, Lu and Chidthaisong2012; Bao et al. Reference Bao, Xiao, Chen, Yao and Zhu2014; Wang et al. Reference Wang, Lai, Sardans, Wang, Datta, Pan, Zeng, Bartrons and Peñuelas2015). In addition, chemical N fertilisers have been applied intensively to rice fields to obtain increased yields over the last few decades (Cui et al. Reference Cui, Shi, Groffman, Schlesinger and Zhu2013), and their amounts are likely to increase further to feed growing populations (Ding et al. Reference Ding, An, Li, Zhang and Zhu2014). Nitrate (NO3–) is generally produced from the oxidation of ammonium (Scheid et al. Reference Scheid, Stubner and Conrad2004; Chen et al. Reference Chen, Zhu, Xia, Shen and He2008) in the oxic surface soil and rice rhizosphere. In farming systems it is typical that the application of chemical fertilisers is combined with straw residues in rice fields. Inorganic N added to soil may be immobilised by soil microorganisms (Nannipieri & Eldor Reference Nannipieri and Eldor2009). These microbes may be subsequently remineralised and redistributed in soil organic matter (Devêvre & Horwáth Reference Devêvre and Horwáth2001). Mineralisation and immobilisation of N by microorganisms are generally coupled with decomposition and stabilisation of soil organic matter, and the balance between these processes ensures the availability of N for plant uptake (Devêvre & Horwáth Reference Devêvre and Horwáth2001). Modern rice cultivation affects the soil microbiome and the function of microbial diversity (Zhu et al. Reference Zhu, Su, Cao, Xue, Quensen, Guo, Yang, Zhou, Chu and Tiedje2016). Rice paddy soil usually has a strong denitrification potential (Zhu et al. Reference Zhu, Liu, Han, Zhang and Xing2003; Ma et al. Reference Ma, Sun, Zhang, Yang, Wang, Yin, Yan and Xiong2013; Lan et al. Reference Lan, Han and Cai2015). Facultative anaerobic microorganisms use NO3– as their terminal electron acceptors during heterotrophic growth, and this leads to the reduction of nitrogen oxides (NO3– and NO2–) to gaseous end products (nitric oxide, nitrous oxide (N2O) and nitrogen gas (N2)) when oxygen is limited. Organic matter and nitrate usually act as the dominant metabolic sources for these denitrifying communities.
Previous studies have demonstrated the highly dynamic structure of the methanogenic archaeal community during straw decomposition (Peng et al. Reference Peng, Lü, Rui and Lu2008). Members of the methanogenic community respond differently to variation in incubation conditions, such as organic residue type (straw residues or root residues), incubation temperature and period (Conrad & Klose Reference Conrad and Klose2006; Peng et al. Reference Peng, Lü, Rui and Lu2008; Conrad et al. Reference Conrad, Klose, Lu and Chidthaisong2012; Lu et al. Reference Lu, Fu, Lu, Floor and Ma2015). The relative abundances of some members of the methanogens such as Methanosarcinaceae and/or Methanobacteriales have been reported to increase after straw incorporation (Conrad & Klose Reference Conrad and Klose2006; Peng et al. Reference Peng, Lü, Rui and Lu2008; Bao et al. Reference Bao, Xiao, Chen, Yao and Zhu2014). The concentrations of acetate and hydrogen (H2) derived from the decomposition of straw regulate the shift of methanogenic archaeal composition during incubation (Conrad Reference Conrad2007). Nitrate addition also affects the methanogenic archaeal community through the competition of denitrifiers for substrates (e.g., acetate or H2) with methanogens, or the toxic effect of nitrogen oxides on methanogens (Klüber & Conrad Reference Klüber and Conrad1998a, Reference Klüber and Conradb). Numerous studies have shown that soil organic matter and NO3– can influence denitrifying communities (Jones & Hallin Reference Jones and Hallin2010; Morrissey et al. Reference Morrissey, Jenkins, Brown and Franklin2013; Yang et al. Reference Yang, Cheng, Li and Miao2013). The effect of soil organic carbon on denitrifying abundance or community composition has been widely studied (Henderson et al. Reference Henderson, Dandie, Patten, Zebarth, Burton, Trevors and Goyer2010; Morales et al. Reference Morales, Cosart and Holben2010; Chen et al. Reference Chen, Hou, Zheng, Qin, Zhu, Wu and Wei2012; Miller et al. Reference Miller, Dandie, Zebarth, Burton, Goyer and Trevors2012). It has been indicated that RS in combination with mineral fertilisers has a strong effect on nirS-bearing denitrifying communities (Chen et al. Reference Chen, Luo, Hu, Wu, Wu and Wei2010).
However, little work has focused on the effects of RS combined with nitrate addition on both methanogenic archaeal and denitrifying communities. The responses of active and total methanogenic populations to straw and/or nitrate addition based on 16S rDNA and 16S rRNA analyses respectively are poorly understood. The objective of this study was thus to investigate whether both the methanogenic archaeal and denitrifying communities responded to RS and/or nitrate amendments in a typical paddy soil from southern China via an anaerobic incubation experiment. Molecular techniques including terminal restriction fragment length polymorphism (T-RFLP) profiling, real-time polymerase chain reaction (PCR), cloning and sequencing were used to investigate the methanogenic archaeal community based on methanogenic archaeal 16S rDNA and 16S rRNA analyses, and to investigate the denitrifying community based on analyses of nirS and nosZ genes in the examined paddy soil.
1. Materials and methods
1.1. Preparation and incubation of soil slurries
The surface soil samples (0–20cm depth) were taken in October 2014 from rice fields [28°12′22.2″N, 116°56′02.2″E] located in Jiangxi province of China. Soil pretreatment and characteristics were described in our previous study (Bao et al. Reference Bao, Xiao, Chen, Yao and Zhu2014). Soil samples were air dried and passed through a 2-mm sieve. RS, the above-ground parts of the rice after harvest, had a carbon content of 39.83%, nitrogen content of 0.63%, a C:N ratio of 63.22 was dried for 48h at 60°C, and cut into <1-mm lengths. Soil samples (15g), RS (0.15g) and autoclaved and degassed water (21.5mL) were put into 100-mL sterilised glass bottles and mixed; then the bottles were sealed with sterilised butyl stoppers and crimped with aluminium caps before being flushed three times with nitrogen gas. Nitrate was added as potassium nitrate at a final concentration of 200mgNkg–1 dry soil (about 10mM in pore water), by injecting 1mL of sterile anoxic solutions (final ratio of water to soil was 1.5:1). All bottles were incubated at 30°C in the dark for 3 months. There were four treatments (n=3 per treatment) including control (Ctrl), straw addition (RS), nitrate addition (N), and both straw and nitrate addition (RS+N). Each set of the bottles in each treatment was used for molecular analysis of soil slurries by destructive sampling.
1.2. Nucleic acid extraction and purification
A 20-mL bolus of soil slurry samples was taken from each bottle for nucleic acid extraction at day 0, 3, 5, 11, 23, 60 and 90. The total DNA and RNA were co-extracted using a published protocol (Ma et al. Reference Ma, Conrad and Lu2012). In brief, 0.5g of soil was extracted with 700μL of TPMS buffer (50mM Tris-HCl, pH 7.0, 1.7% (wt/vol) polyvinylpyrrolidone K25, 20mM MgCl2, 1% (wt/vol) sodium dodecyl sulphate) once and then extracted twice with 700μL of phenol-based lysis buffer (5mM Tris-HCl, pH 7.0, 5mM Na2EDTA, 1% (wt/vol) sodium dodecyl sulphate, 6% (vol/vol) water-saturated phenol). The supernatants were further extracted with 500μL of water-saturated phenol, 500μL of phenol–chloroform–isoamyl alcohol (25:24:1 (vol/vol/vol)), and 500μL of chloroform–isoamyl alcohol (24:1 (vol/vol)). The total nucleic acids were precipitated with cold ethanol and sodium acetate (Ma et al. Reference Ma, Conrad and Lu2012). RNA was obtained by removal of co-extracted DNA with RNase-Free DNase Set (Takara, China) at 37°C for 30min. RNA samples were purified using RNeasy Mini Kit (Qiagen, Hilden, Germany) as described by previous studies Ma et al. (Reference Ma, Conrad and Lu2012) and Xu et al. (Reference Xu, Ma, Huang, Liu and Lu2012). The quality of DNA and RNA extracts was checked by 1% agarose gel electrophoresis and quantified using a UV-Vis Spectrophotometer (ND-1000, NanoDrop, USA).
The average concentrations of DNA and RNA were 67ngμL–1 and 43ngμl–1, respectively. The purity of DNA and RNA was estimated from the 260/230 ratio and the 260/280 ratio. The average values of 260/230 ratio were 1.45 and 1.72 for DNA and RNA, respectively. The average values of 260/280 were 1.87 and 2.10 for DNA and RNA, respectively.
1.3. cDNA synthesis
rRNA was reversely transcribed into complementary DNA (cDNA) using PrimeScript® 1st strand cDNA Synthesis Kit (Takara) as described by Xu et al. (Reference Xu, Ma, Huang, Liu and Lu2012), and subjected to subsequent T-RFLP analysis, cloning and quantitative analysis. A control reaction was performed with nuclease-free water instead of reverse transcriptase to verify the absence of DNA.
1.4. PCR amplification and T-RFLP analysis
Amplifications of methanogenic archaeal 16S rDNA and 16S rRNA fragments were carried out using primer set Ar109f and Ar912r (Yuan & Lu Reference Yuan and Lu2009), with DNA and RNA (after cDNA synthesis) samples being used as PCR template, respectively. PCR reactions followed the same protocols as previously described (Yuan & Lu Reference Yuan and Lu2009), with the reverse primer labelled with 5′-FAM for T-RFLP analysis. Fragments of nirS (425bp) and nosZ genes (267bp) were amplified using the primer pairs cd3aF/R3cd (Throbäck et al. Reference Throbäck, Enwall, Jarvis and Hallin2004) and nosZ-2F/2R (Henry et al. Reference Henry, Bru, Stres, Hallet and Philippot2006) respectively. For T-RFLP assays, the reverse primers R3cd and nosZ-2R were labelled with 5′-HEX and 5′-FAM, respectively. The PCR reaction mixtures and thermal profiles for amplifications of nirS and nosZ genes were the same as reported in previous studies (Throbäck et al. Reference Throbäck, Enwall, Jarvis and Hallin2004; Henry et al. Reference Henry, Bru, Stres, Hallet and Philippot2006). The amplified products were examined on 1.2% agarose gels by electrophoresis and then purified using a Qiaquick PCR Purification Kit (Qiagen, Germany) following the manufacturer's instructions. The purified PCR products of methanogenic archaeal 16S rDNA and 16S rRNA were digested at 65°C for 3h by TaqI (Fermentas, Canada) (Lueders & Friedrich Reference Lueders and Friedrich2000). The purified PCR products of nirS and nosZ genes were digested at 37°C for 3h and 10min using the restriction enzyme HhaI (New England BioLabs, Ipswich, MA) and HpyCH4V (New England Biolabs, Germany) respectively (Enwall et al. Reference Enwall, Throbäck, Stenberg, Söderström and Hallin2010; Töwe et al. Reference Töwe, Wallisch, Bannert, Fischer, Hai, Haesler, Kleineidam and Schloter2011). All the digestion products were size-separated using a 3730xl Genestic Analyzer (Applied Biosystems). The relative abundance of each terminal restriction fragment (T-RF) was calculated as described previously (Bao et al. Reference Bao, Xiao, Chen, Yao and Zhu2014).
1.5. Cloning, sequencing and phylogenetic analysis
Based on the T-RFLP results the clone libraries were constructed for methanogenic archaeal 16S rDNA and 16S rRNA retrieved from the RS+N treatment on day 60, and for nirS and nosZ genes from the N treatment on day 11. PCR amplification used the same primers as described above without fluorescent labels. PCR products of the correct size were purified and ligated into the pGEM-T Easy Vector (Promega, Madison, WI) according to the manufacturer's instructions. Plasmids were transformed into Escherichia coli cells. In total, 101, 77, 66 and 61 randomly selected positive clones were sequenced for methanogenic archaeal 16S rDNA and 16S rRNA, nirS and nosZ genes, respectively. Phylogenetic trees were constructed from DNA sequences of methanogenic archaeal 16S rDNA and 16S rRNA and amino acid sequences similarity of nirS and nosZ genes with MEGA 4.0 using the neighbour joining method. Clones with >99% (for methanogenic archaeal 16S rDNA and 16S rRNA) and >95% (for nirS and nosZ genes) sequences similarity were considered as the same operational taxonomic unit (OTU). The clone sequences were aligned using Clustal X (1.83), and neighbour-joining trees were produced using MEGA 4.0. Bootstrap analysis was used to estimate the reliability of the phylogenetic reconstruction (1000 replicates).
The nucleotide sequences of methanogenic archaeal 16S rDNA/16S rRNA, nirS gene and nosZ gene fragments determined in this study were submitted to the GenBank database under the following accession numbers: KU522052-KU522090 (methanogenic archaeal 16S rDNA); KU522029-KU522051 (methanogenic archaeal 16S rRNA); KU522091-KU522117 (nirS gene); KU522005-KU522024 and KU522026-KU522028 (nosZ gene).
1.6. Quantitative analysis of methanogenic archaeal 16S rDNA, methanogenic archaeal 16S rRNA, nirS and nosZ genes by real-time PCR
All real-time PCR amplifications were performed on an iCycler iQTM Thermocycler (Bio-Rad). For methanogenic archaeal 16S rDNA and 16S rRNA copy numbers were determined using a primer pair Ar364f/Ar934r (Yuan & Lu Reference Yuan and Lu2009), and the thermal cycles and fluorescence signal acquisition followed the same protocols as earlier reported (Kemnitz et al. Reference Kemnitz, Chin, Bodelier and Conrad2004). For nirS and nosZ genes their copy numbers were determined using the primer pairs cd3aF/R3cd (Throbäck et al. Reference Throbäck, Enwall, Jarvis and Hallin2004) and nosZ-2F/2R (Henry et al. Reference Henry, Bru, Stres, Hallet and Philippot2006) respectively. Each reaction was performed in a 25μL volume containing 12.5μL of SYBR Green Premix ExTaq (Takara, Japan), 0.5μL of each 20μM primer, 0.25μL of 25μM BSA and 1μL of template DNA. Thermal cycling conditions for nirS gene followed the same protocols as given by Guo et al. (Reference Guo, Deng, Qiao, Mu and Zhu2011). For nosZ gene, amplification conditions were as follows: pre-incubation at 95°C for 2min, the initial six cycles started with the annealing temperature at 65°C, then reduced 1°C by after each cycle for 30s, followed by 40 cycles consisting of denaturation at 95°C for 15s, annealing at 60°C for 30s, extension at 72°C for 30s, and fluorescence was read during each cycle at 83°C for 15s, followed by melting curve analysis at 55–95°C (0.5°C per reading) at a 10s hold. Amplification of the correct products was checked by melting curve analysis and agarose gel electrophoresis. The standard curves for real-time PCR were established using methanogenic archaeal 16S rDNA, methanogenic archaeal 16S rRNA, nirS and nosZ gene fragments cloned into plasmid pGEM-T Easy Vector (3015bp, Promega, Madison, USA) respectively. Positive clones with the right fragment were extracted using a Qiagen Plasmid Mini Kit (Qiagen Nordic) and plasmid DNA concentrations were determined using a UV-Vis Spectrophotometer (ND-1000, NanoDrop, USA). The copy numbers of methanogenic archaeal 16S rDNA, methanogenic archaeal 16S rRNA, nirS and nosZ genes were directly calculated from the concentrations of the corresponding extracted plasmid DNA.
2. Statistical analysis
For the means and the standard errors, data were processed using EXCEL 2007. Size and relative abundances of different terminal restriction fragments (T-RFs) were calculated using PeakScan version 1.0 (Applied Biosystems, Inc.). T-RFs with a size of more than 50bp for cluster analysis. We only analysed the fragments with a signal intensity above 1% of the sum of all peak areas. The T-RFLP data-based Shannon–Weiner diversity index (H) was calculated using the following formula:
 $$H^\prime = - \sum (Pi) (\log_2 Pi)$$
where Pi is the proportion of a single T-RF relative to the total T-RFs (Xiao et al. Reference Xiao, Bao, Bao, Jia, Huang, Su and Zhu2013). One-way analysis of variance was performed to test significant differences in diversity indices among treatments using the SAS program (SAS Institute, Cary, IN).
3. Results
3.1. Dynamics of the methanogenic archaeal community structures
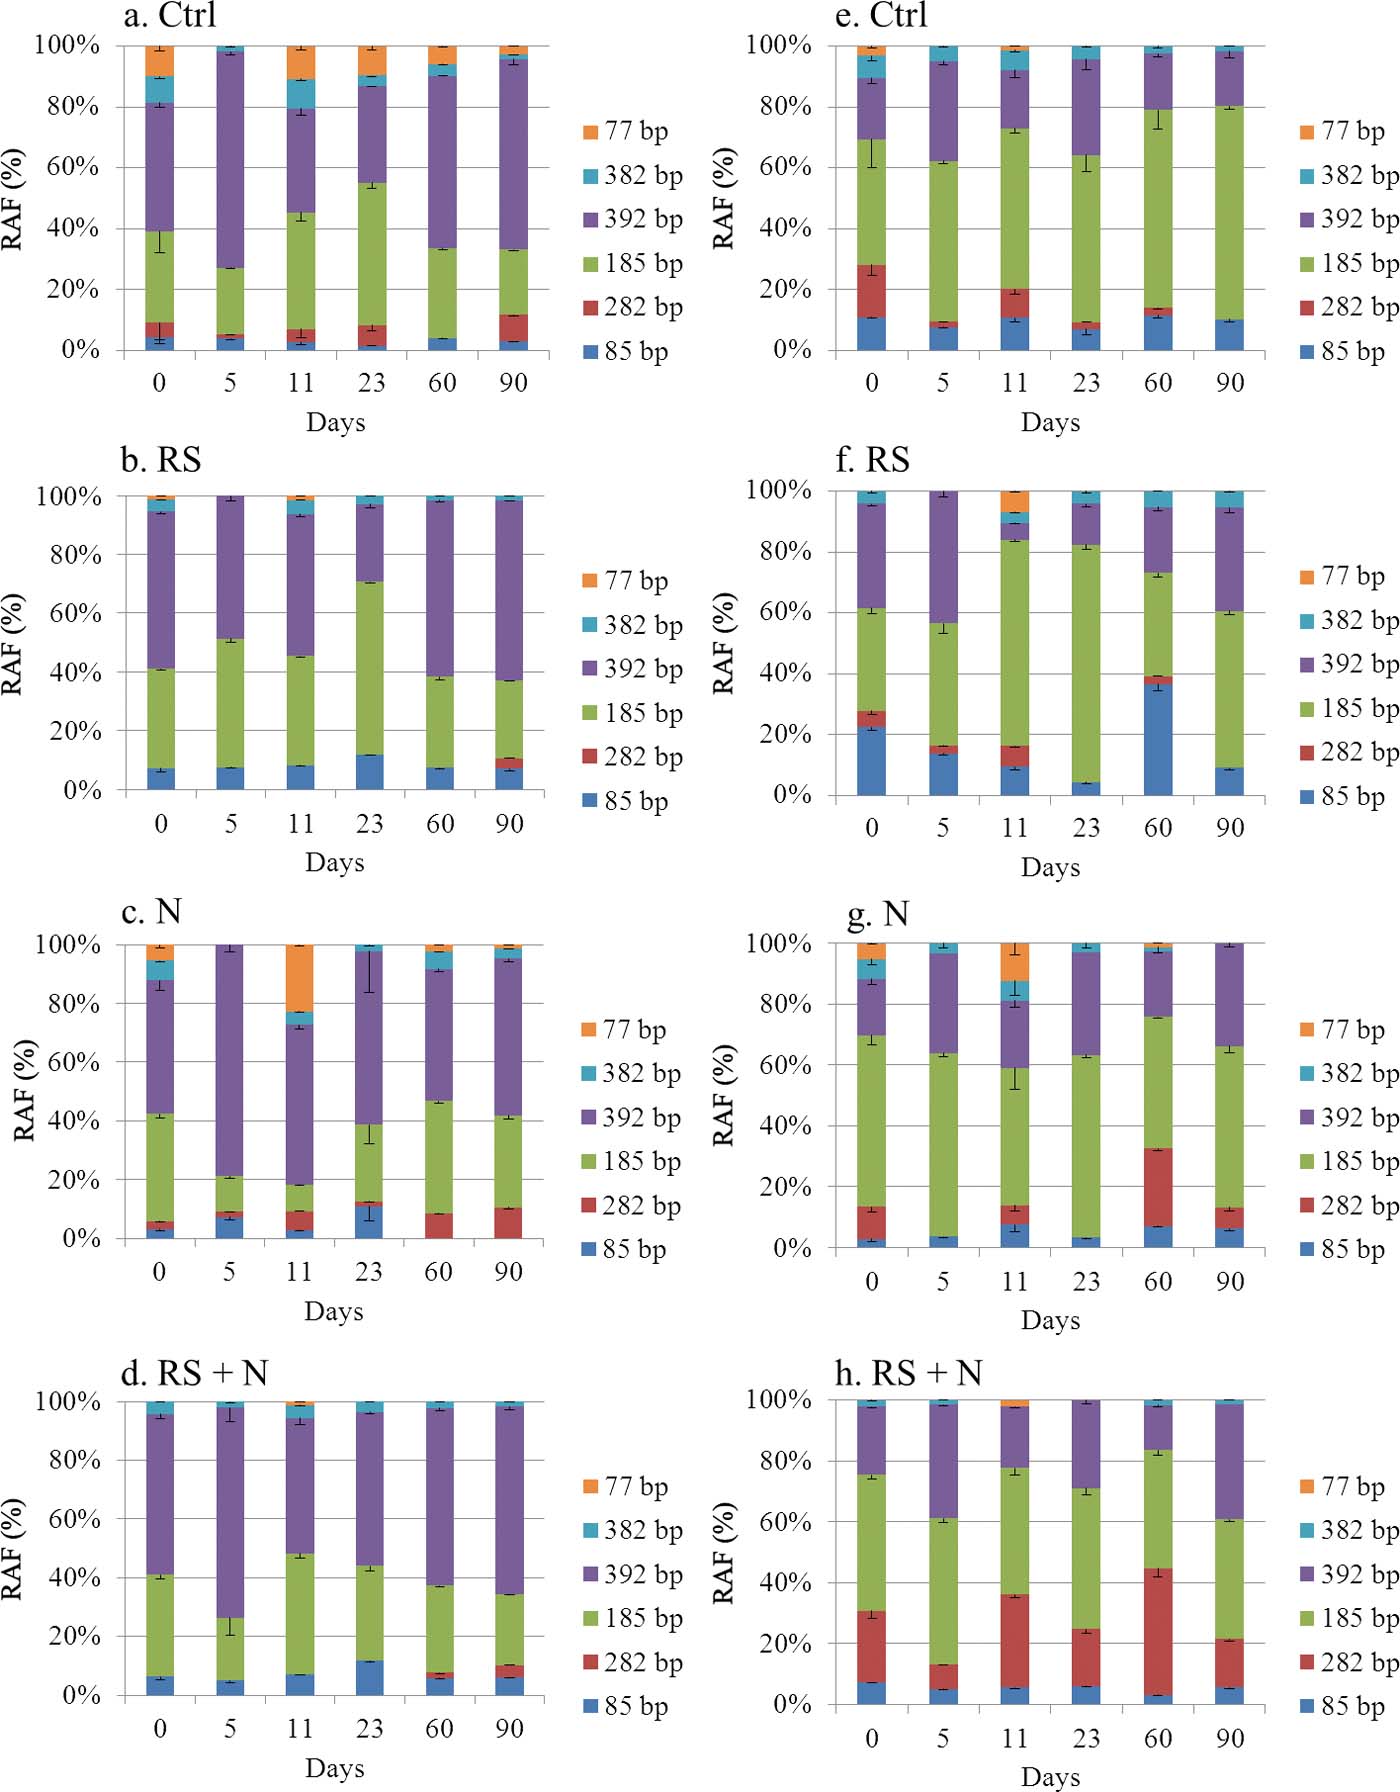
The dynamics of methanogenic archaeal community was determined based on T-RFLP analyses targeting both methanogenic archaeal 16S rDNA (Fig. 1a–d) and 16S rRNA (Fig. 1e–h). Six fragments (77, 85, 185, 282, 382 and 392bp) were detected as major peaks in the T-RFLP profiles. These T-RFs could be assigned to the following lineages: Methanosarcinaceae (185bp), Methanocellaceae (392, 382 and 77bp), Methanosaetaceae (282bp), and Methanomicrobiaceae (85bp) according to in silico terminal restriction analysis of the archaeal sequences in this study and previously published sequence information (Peng et al. Reference Peng, Lü, Rui and Lu2008; Yuan et al. Reference Yuan, Conrad and Lu2011; Bao et al. Reference Bao, Xiao, Chen, Yao and Zhu2014).
The dynamics of the methanogenic archaeal community structure based on T-RFLP analysis targeting methanogenic archaeal 16S rDNA (a–d) and methanogenic archaeal 16S rRNA (e, f) in anaerobically incubated rice field soil after the addition of RS and/or nitrate. Data are the relative abundances of T-RFs (mean±SE; n=3). Only major T-RFs are shown. Abbreviations: RAF=relative abundance frequency; Ctrl=control treatment; N=treatment with nitrate alone; RS=treatment with RS alone; RS+N=treatment with both straw and nitrate.

The total methanogenic archaeal community structure remained relatively stable among treatments based on 16S rDNA analysis. In all treatments, Methanocellaceae (392bp, 382bp and 77bp) were the most dominant groups, and followed by Methanosarcinaceae (185bp). Compared with these groups, Methanosaetaceae (282bp) and Methanomicrobiaceae (85bp) had much lower relative abundances. The relative abundance of Methanosaetaceae (282bp) in Ctrl and N treatments were slightly (0.9–10%) (P>0.05) greater than that in RS and RS+N treatments, but a little more (5–16%) (P>0.05) Methanomicrobiaceae (85bp) were observed in RS and RS+N treatments. The relative abundances of Methanocellaceae (382bp) and Methanosarcinaceae (185bp) fluctuated over the time. The relative abundance of Methanocellaceae (392, 382 and 77bp) decreased (especially the T-RF of 77bp) but Methanosarcinaceae (185bp) increased on day 11 and 23 in all treatments except the N which showed opposite patterns from them in the same periods.
In contrast the T-RFLP patterns of the methanogenic archaeal 16S rRNA, which represented the community structure of active methanogens, exhibited obvious differences. The most dominant groups were Methanosarcinaceae (185bp), followed by Methanocellaceae (392, 382 and 77bp) in all treatments. The relative abundances of individual groups also fluctuated in different treatments with incubation time. The relative abundance of Methanosarcinaceae (185bp) increased but Methanocellaceae (392bp) decreased on days 11 and 23 in the RS treatment. Methanosaetaceae (282bp) as the third dominant groups in RS+N exhibited obvious fluctuation with incubation time. In the N treatment Methanosaetaceae (282bp) also significantly increased on day 60. Methanomicrobiaceae (85bp) showed great abundance in the RS treatment and increased on day 60.
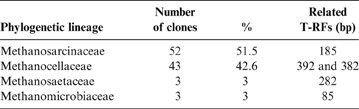
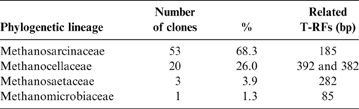
Two clone libraries for methanogenic archaeal 16S rDNA and 16S rRNA were constructed from the soil sample collected on day 60 in the RS+N treatment. The sequencing results of the randomly selected clones showed that the methanogenic archaeal community contained four families including Methanosarcinaceae, Methanocellaceae, Methanosaetaceae and Methanomicrobiaceae (Tables 1 and 2), and Methanosarcinaceae and Methanocellaceae dominated the methanogenic archaeal community in these samples.
Assignment of T-RFs and analysis of the clone library of methanogenic archaeal 16S rDNA. The methanogenic archaeal 16S rDNA clones were obtained from DNA sample collected on day 60 in the anoxic incubation treated with both RS and nitrate.

Assignment of T-RFs and analysis of the clone library of methanogenic archaeal 16S rRNA. The methanogenic archaeal 16S rRNA clones were obtained from mRNA sample collected on day 60 in the anoxic incubation treated with both RS and nitrate.

3.2. Dynamics of the nirS and nosZ-containing denitrifying community structures
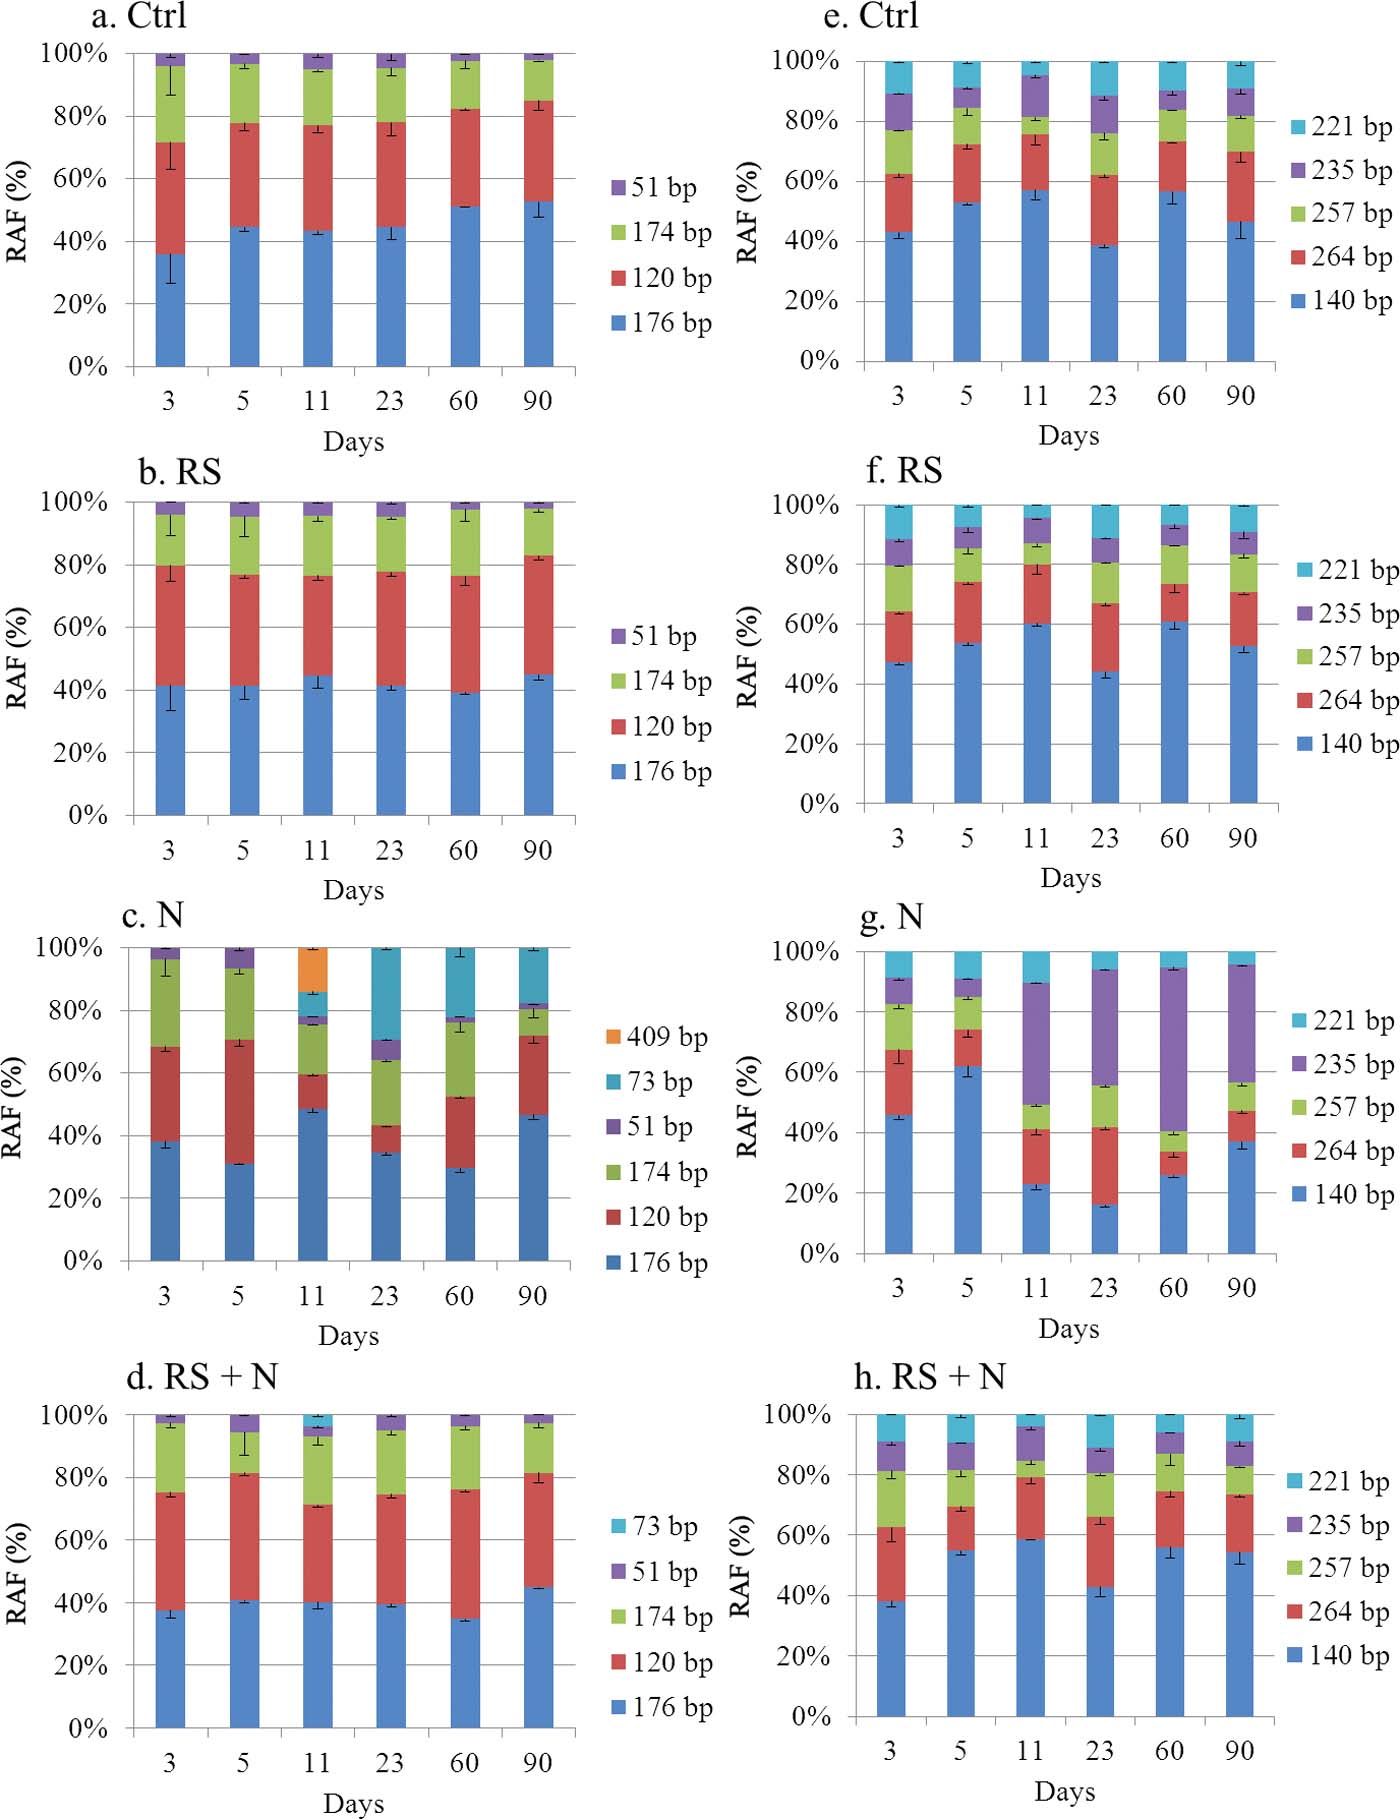
T-RFLP analyses of nirS and nosZ genes were performed to characterise the group dynamics of denitrifiers during anoxic incubation of soil slurries. The T-RFLP patterns of nirS gene in the N treatment were distinct from the other treatments, and individual groups fluctuated greatly with the incubation time (Fig. 2a–d). A total of six T-RFs (409, 73, 51, 174, 120 and 176bp) were detected in the N treatment; the T-RF of 176bp was the most dominant group at all time points, and the T-RF of 120bp was the second dominant group but its relative abundance decreased on day 11 and day 23. In addition, the T-RF of 409bp only emerged on day 11 in this treatment. The relative abundance of T-RF 73bp increased from day 11 to day 90. For the other treatments (Ctrl, RS and RS+N), the T-RFLP patterns were similar to each other, and the relative abundance of each T-RF remained almost constant through the whole incubation period. The T-RFs of 176 and 120bp were the most dominant group, and followed by the T-RF of 174bp. The relative abundances of T-RFs of 51 and 73bp were extremely low.
The dynamics of denitrifying structures based on T-RFLP analysis targeting nirS gene (a–d) and nosZ gene (e, f) in anaerobically incubated rice field soil after the addition of RS and/or nitrate. Data are the relative abundances of T-RFs (mean±SE, n=3). Only major T-RFs are shown. Abbreviations: RAF=relative abundance frequency; Ctrl=control treatment; N=treatment with nitrate alone; RS=treatment with RS alone; RS+N=treatment with both straw and nitrate.

A total of five fragments (221, 235, 257, 264 and 140bp) were observed in T-RFLP profiles of the nosZ gene (Fig. 2e–h). Like the nirS gene, the T-RFLP profiles of nosZ gene in the N treatment were different from the other treatments. The relative abundance of 235bp T-RF markedly increased but that of 140bp T-RF decreased after 11 days of incubation. The relative abundances of T-RFs of 264 and 257bp decreased on both day 60 and day 90. The T-RFLP patterns in the other treatments were almost identical, with the relative abundance of each T-RF fluctuating a little with incubation time. The most dominant group was 140bp T-RF, and followed by the T-RFs of 257 and 264bp. The relative abundances of T-RFs of 221 and 235bp were relatively low.
The phylogenetic tree was constructed based on the sequences of nirS and reference sequences, which were obtained from the Genbank database and divided into eight clusters of nirS sequences (Clusters I-VIII). The clones of nirS were throughout the tree (Fig. 3). Most of the T-RFs observed in T-RFLP analysis could be assigned to more than two different clusters. According to the in silico analyses of nirS clone sequences, the clones (174bp) which were grouped in clusters I, II, VI and VIII were related to the nirS of Burkholderiales, Rhizobiales, Rhodospirillales and Pseudomonadales respectively. The clones (120bp) which were grouped in clusters I were related to the nirS of Burkholderiales. The clones (51bp) in clusters I, III and VII were related to the nirS of Burkholderiales and Rhodocyclales. The clones (62bp) in cluster IV were related to the nirS of Rhizobiales. The clones (73bp) in cluster I were related to the nirS of Burkholderiales, and the clones (106bp) in cluster VIII were related to the nirS of Pseudomonadales.
Neighbour-joining tree based on partial nirS sequences (410 nucleotide positions). nirS clones were obtained from the treatment with nitrate alone after 11 days of anoxic incubation. Clones were named with NIRS and numbers. The number in parentheses represented clone number of each OTU. In silico T-RF size is shown after the clone name. GenBank accession numbers of reference sequences are indicated. The scale bar represents 2% sequence divergence.

The dendrogram of deduced amino acids of nosZ can be divided into five clusters of nosZ sequences (clusters I–V) (Fig. 4). Most of the T-RFs could be assigned to more than two different clusters and all the T-RFs could be assigned to different nosZ-bearing denitrifiers lineages by in silico analyses of nosZ clones sequences. Most of the nosZ clones (containing different sizes of T-RFs) were grouped in cluster I and related to Bradyrhizobiaceae together with cluster III. The clones in cluster II and cluster IV were related to Rhodospirillaceae and the clones in Cluster V were related to Hyphomicrobiaceae.
Neighbour-joining tree based on partial nosZ sequences (270 nucleotide positions). nosZ clones were obtained from the treatment with nitrate alone after 11 days of anoxic incubation. Clones were named with NOSZ and numbers. The number in parentheses represented clone number of each OTU. In silico T-RF size is shown after the clone name. GenBank accession numbers of reference sequences are indicated. The scale bar represents 2% sequence divergence.

3.3. Diversity of the methanogenic archaea and denitrifiers
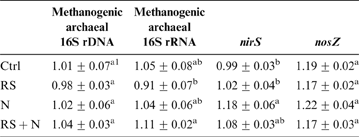
The diversity of the methanogenic archaeal community and denitrifying community was evaluated by the Shannon–Weiner index based on the results obtained from T-RFLP analysis (Table 3). There was no significant (P>0.05) difference in the diversity indices of methanogenic archaeal 16S rDNA among treatments. However, the diversity indices of methanogenic archaeal 16S rRNA showed significant differences between the RS and the RS+N treatments (P<0.01). For nirS-bearing denitrifiers, their diversity indices significantly increased in the N treatment when compared with the control. For nosZ-bearing denitrifiers, their diversity indices did not differ significantly among treatments.
Shannon–Weiner diversity index based on T-RFLP data. Abbreviations: Ctrl = control treatment; RS=treatment with RS alone; N=treatment with nitrate alone; RS+N=treatment with both straw and nitrate.

1 Mean±SE (n=6). The data are average values of all time points. Different letters within the same column indicate significant differences (P<0.05) among treatments tested by ANOVA.
3.4. Abundance of methanogenic archaea and denitrifiers
For methanogenic archaeal 16S rDNA, their copy numbers in the RS and RS+N treatments gradually increased during the first 60 days, and the extent of increase in the RS+N treatment was much greater than in the RS treatment (Fig. 5a). The highest numbers of methanogenic archaeal 16S rDNA in the RS and RS+N treatments were 2.45×10¹¹ and 3.9×10¹¹ copiesg–1 soild.w., respectively, which were greater than those in the Ctrl and N treatments. After 60 days the copy number of methanogenic archaeal 16S rDNA in the RS treatment decreased, while that in the RS+N treatment changed little until the end of the incubation period. The copy numbers of methanogenic archaeal 16S rDNA showed no significant differences between the Ctrl and N treatments, and they remained almost constant throughout the incubation period. For methanogenic archaeal 16S rRNA, their copy numbers in the RS and RS+N treatments greatly increased during the first 23 days and then decreased gradually during the remaining incubation period. Moreover, no significant (P>0.05) difference was found between these two treatments throughout the incubation (Fig. 5b). The greatest copy numbers of methanogenic archaeal 16S rRNA in the RS and RS+N treatments were 1.63×10¹² and 1.99×10¹²g–1 soild.w., respectively. Compared with the RS and RS+N treatments, the copy numbers of methanogenic archaeal 16S rRNA were significantly lower in the Ctrl and N treatments, and both slightly fluctuated over time. There were no obvious difference between the Ctrl and N treatments throughout the incubation.
Dynamics of abundances of methanogenic and denitrifying populations revealed by quantitative PCR analyses based on (a) methanogenic archaeal 16S rDNA; (b) methanogenic archaeal 16S rRNA; (c) nirS gene; and (d) nosZ gene during 90-day incubation in all treatments. Errors bars represent standard errors of triplicate samples. Abbreviations: Ctrl=control treatment; N=treatment with nitrate alone; RS=treatment with RS alone; RS+N=treatment with both straw and nitrate.

The copy numbers of nirS and nosZ genes in the N treatment increased at the early stage of incubation, and reached their peaks on day 23 (2.61×10¹⁰copiesg–1 soild.w. for nirS gene) and day 11 (7.41×10⁷copiesg–1 soild.w. for nosZ gene), respectively, and then decreased gradually with incubation time (Fig. 5c, d). The greatest copy numbers of nosZ gene in the Ctrl (1.59×10⁷copiesg–1 soild.w.), RS (1.39×10⁷copiesg–1 soild.w.) and RS+N (1.75×10⁷copiesg–1 soild.w.) treatments were also less than in the N treatment.
4. Discussion
4.1. The effect of RS and/or nitrate addition on methanogenic archaeal community composition
In this study, we investigated the dynamics of total and active methanogenic archaea based on 16S rDNA and 16S rRNA analyses. The traditional cultivation and DNA-based analysis of methanogenic archaea might only show the existence or the growth of methanogens (Yuan & Lu Reference Yuan and Lu2009; Yuan et al. Reference Yuan, Conrad and Lu2011). The simultaneous analyses of methanogens at both DNA and RNA levels were anticipated to be more powerful than that at DNA level alone. In the present study methanogenic archaeal 16S rDNA analysis showed that the methanogenic community did not respond to straw and/or nitrate addition during different incubation periods (Fig. 1a–d), but more fluctuations were observed based on archaeal 16S rRNA level analysis (Fig. 1e–h). Peng et al. (Reference Peng, Lü, Rui and Lu2008) report a highly dynamic structure of the methanogenic archaeal community at the DNA level in a RS amended microcosm, but N fertilisation did not influence the methanogenic community composition as reported by Wu et al. (Reference Wu, Ma, Li, Ke and Lu2009). The methanogenic archaeal communities were composed of Methanosarcinaceae, Methanocellaceae, Methanosaetaceae, and Methanomicrobiaceae, which was consistent with findings of previous studies (Yuan & Lu Reference Yuan and Lu2009; Lu et al. Reference Lu, Fu, Lu, Floor and Ma2015). The T-RFLP patterns of methanogenic archaeal 16S rDNA showed that the relative abundance of Methanocellaceae nearly dominated in all treatments followed by Methanosarcinaceae, but just the opposite in the T-RFLP patterns of 16S rRNA. Methanocellaceae were more abundant in the treatment with nitrate alone than in the other treatments based on both 16S rDNA and 16S rRNA analyses. It has been well documented that Methanocellaceae are favoured by a low H2 concentration in rice field soils (Lu & Conrad Reference Lu and Conrad2005; Peng et al. Reference Peng, Lü, Rui and Lu2008). A small H2 concentration had been observed in a nitrate alone treatment in our previous study (Bao et al. Reference Bao, Huang, Wang, Nie, Graeme, Yao and Ding2016). For Methanosarcinaceae the addition of straw alone stimulated their growth and activity, especially in the early incubation stage. Similar results have also been reported (Peng et al. Reference Peng, Lü, Rui and Lu2008; Conrad et al. Reference Conrad, Klose, Lu and Chidthaisong2012). Methanosarcinaceae are known as fast-growing and substrate-versatile methanogens, can use large concentrations of acetate (0.2–1.2mM), but also H2-CO2 or methanol (Jetten et al. Reference Jetten, Stams and Zehnder1990; Conrad Reference Conrad2007). Acetate and H2 resulting from anaerobic straw decomposition accumulated to marked concentrations in the treatment with the addition straw at an early phase of incubation as reported in our previous study (Bao et al. Reference Bao, Huang, Wang, Nie, Graeme, Yao and Ding2016). These suggest that Methanosarcinaceae might contribute greatly to CH4 production in straw amendment treatments as high CH4 production and Methanosarcinaceae enrichment occurred at the same time. The methanogenic archaeal 16S rDNA analysis showed that the abundances of Methanosaetaceae were very small in all treatments during the entire incubation period, but slightly greater in treatments with no straw than with straw. This possibly resulted from a lower acetate concentration, as we also have observed a low acetate concentration in straw and/or nitrate addition in our previous study (Bao et al. Reference Bao, Huang, Wang, Nie, Graeme, Yao and Ding2016). The Methanosaetaceae utilise acetate over a smaller range of concentrations, and they are described as slow-growing methanogens (Jetten et al. Reference Jetten, Stams and Zehnder1992). However, methanogenic archaeal 16S rRNA analysis showed that there was a great abundance of them in treatments with both straw and nitrate. This may have resulted from the changes in the relative abundance of Methanosarcinaceae or adaptation of the Methanosaetaceae to H2 dynamics (Peng et al. Reference Peng, Lü, Rui and Lu2008; Lu et al. Reference Lu, Fu, Lu, Floor and Ma2015); a smaller H2 concentration occurred in both the straw and nitrate treatments compared with straw alone as in our previous study (Bao et al. Reference Bao, Huang, Wang, Nie, Graeme, Yao and Ding2016). For Methanomicrobiaceae, the greater relative abundance of them was observed in the straw added treatments (RS and RS+N) according to methanogenic archaeal 16S rDNA analysis, and the greater abundances of this population were detected in the straw alone treatment based on 16S rRNA analysis. These results also indicated that the combined application of nitrate and straw suppressed the activity of Methanomicrobiaceae compared with the straw alone treatment, and thus inhibiting methanogenesis to some extent as shown by our previous study (Bao et al. Reference Bao, Xiao, Chen, Yao and Zhu2014). Moderately thermophilic methanogens, Methanomicrobiaceae, have been detected in a range of rice field soils (Peng et al. Reference Peng, Lü, Rui and Lu2008; Lu & Conrad Reference Lu and Conrad2005; Lu et al. Reference Lu, Fu, Lu, Floor and Ma2015), and they could be enriched by rice roots (Conrad et al. Reference Conrad, Klose, Noll, Kermnitz and Bodelier2008; Wu et al. Reference Wu, Ma, Li, Ke and Lu2009).
The diversity of methanogenic archaeal communities showed a more distinct response to the addition of straw (RS and RS+N) at archaeal 16S rRNA level than at archaeal 16S rDNA level (Table 3), possibly because RNA is more sensitive and responsive to environmental change than DNA (Yuan & Lu Reference Yuan and Lu2009; Yuan et al. Reference Yuan, Conrad and Lu2011). Straw alone addition seemed to have adverse effects on the diversity of methanogens, as the diversity index slightly decreased compared with Ctrl at both 16S rDNA and 16S rRNA levels. However, there was an increasing trend in the diversity index when straw was added together with nitrate, especially at the archaeal 16S rRNA level. It is assumed that the simultaneous provision of inorganic nitrogen together with straw as energy substrates are beneficial for keeping or improving the diversity of methanogens to maintain the microbial ecological balance.
4.2. The effect of RS and/or nitrate addition on the abundance of methanogenic archaeal communities
RS application (RS and RS+N) seemed to stimulate the growth of both total and active methanogenic archaeal populations and consequently led to an increase in the methanogenic archaeal abundance (Fig. 5a, b). This is probably due to sufficient supply of substrates (H2 and acetate) derived from the decomposition of straw (Conrad & Klose Reference Conrad and Klose2006; Conrad et al. Reference Conrad, Klose, Lu and Chidthaisong2012; Bao et al. Reference Bao, Huang, Wang, Nie, Graeme, Yao and Ding2016). The size of the methanogenic archaeal population increased to a greater extent from the RS+N treatment than in the RS treatment. A possible explanation for this could be that more N was supplied as energy substrates to methanogenic archaea. For the RS and RS+N treatments, the change pattern in 16S rRNA-based methanogenic archaea as the decline occurred after day 23 for the 16S rRNA-based methanogenic archaeal abundance, but after day 60 for the 16S rDNA-based methanogenic archaeal abundance. This suggested that the growth of active methanogenic archaea was more sensitive to substrate consumption than that of total methanogenic archaea. The comparatively small abundances of archaeal 16S rDNA and 16S rRNA were observed in both the Ctrl and N treatments during the entire incubation period. This might be explained by the low levels of substrate as low H2 and acetate in the nitrate added treatment had been observed in our previous study (Bao et al. Reference Bao, Huang, Wang, Nie, Graeme, Yao and Ding2016). It has been well documented that substrate availability is a limiting factor for microbial growth and activity (Liesack et al. Reference Liesack, Schnell and Revsbech2000; Bao et al. Reference Bao, Xiao, Chen, Yao and Zhu2014), and affects microbial-mediated processes.
4.3. The effect of RS and/or nitrate addition on denitrifying community composition
The nirS- and nosZ-containing denitrifying community structures only changed following the addition of nitrate alone, and the relative abundance of the individual group of nirS and nosZ-containing denitrifiers varied over the time (Fig. 2). These results together with stimulation of N2O production by nitrate addition alone as shown in our previous study (Bao et al. Reference Bao, Huang, Wang, Nie, Graeme, Yao and Ding2016) suggest that nitrate addition might promote the denitrification process through altering denitrifying community composition in rice paddy soil. Significant close relationships between denitrifying community structure and nitrate concentration have also been found in long-term fertilisation experiments (Jones & Hallin Reference Jones and Hallin2010; Tang et al. Reference Tang, Yan, Zhang, Chi, Li, Lian and Wei2010), even along natural gradients in soil nitrate (Bañeras et al. Reference Bañeras, Ruiz-Rueda, López-Flores, Quintana and Hallin2012; Yang et al. Reference Yang, Cheng, Li and Miao2013).
The addition of straw (RS and RS+N) did not influence the nirS and nosZ-bearing denitrifying community structures in the present study. As was the case in our earlier study, the community structure of nirS-bearing denitrifiers did not respond to application of nitrate in combination with soluble carbon (glucose) (Bao et al. Reference Bao, Ju, Gao, Qu, Christie and Lu2011). However, a full factorial design study found that the community composition of nirS denitrifiers was interactively conducted by both nitrate concentration and organic matter, but the changes were relatively consistent throughout the incubation time (Morrissey & Franklin Reference Morrissey and Franklin2015). The change in nosZ denitrifiers community structure has also been observed in response to organic or inorganic fertilisation (Wolsing & Prieme Reference Wolsing and Prieme2004; Enwall et al. Reference Enwall, Philippot and Hallin2005; Dambreville et al. Reference Dambreville, Hallet, Nguyen, Morvan, Germon and Philippot2006). In our previous study, we observed the transient accumulation of NO2– and N2O when RS was added together with nitrate (Bao et al. Reference Bao, Huang, Wang, Nie, Graeme, Yao and Ding2016). These results suggest that denitrifiers might respond functionally without structural shifts. The short incubation period in our study might also result in the no response of denitrifying community structures to straw addition (RS and RS+N) as an earlier study has found that the structure of nosZ-containing denitrifying community significantly changed under a 17-year application of RS (Chen et al. Reference Chen, Hou, Zheng, Qin, Zhu, Wu and Wei2012).
The phylogenetic analysis showed that most of the nirS gene sequences were related to Pseudomonadales, Rhodocyclales and Burkholderiales (Figs 3, 4), indicating that these bacterial groups may be involved in denitrification in the paddy soil examined which agrees with the results from previous studies in paddy soils in Japan (Satio et al. Reference Satio, Ishii, Otsuka, Nishiyama and Senoo2008; Ishii et al. Reference Ishii, Yamamoto, Kikuchi, Oshima, Hattori, Otsuka and Senoo2009). A relatively large part of nirS gene sequences were related to Rhizobiales, indicating that these groups may also participate in denitrification in paddy soils (Satio et al. Reference Satio, Ishii, Otsuka, Nishiyama and Senoo2008). Furthermore, it is noteworthy that the T-RF of 409bp of the nirS gene that was only detected on day 11 in the N treatment could not be identified via in silico analysis of nirS gene sequencing. A possible reason was that the sequences of nirS clones were insufficient to assign all the T-RFs observed in T-RFLP analysis in this study. The nosZ-bearing denitrifying community consisted of Rhodospirillaceae, Bradyrhizobiaceae and Hyphomicrobiaceae which was accorded with results from previous studies (Guo et al. Reference Guo, Deng, Qiao, Mu and Zhu2011; Chen et al. Reference Chen, Hou, Zheng, Qin, Zhu, Wu and Wei2012).
For nirS-bearing denitrifiers, only nitrate addition (N) significantly increased their diversity, suggesting that these denitrifiers were sensitive to easily available nitrate nitrogen. In addition, the diversity indices of nosZ-bearing denitrifiers were generally greater than those of the nirS-bearing denitrifiers in this study, indicating that the nosZ-bearing denitrifiers have a relatively large diversity in the selected paddy soil. The values of the diversity indices of nirS and nosZ in all treatments in our study (0.99–1.22) were much smaller than those previously reported for paddy soils (>2) (Yoshida et al. Reference Yoshida, Ishii, Otsuka and Senoo2009; Guo et al. Reference Guo, Deng, Qiao, Mu and Zhu2011). One possible explanation could be that nirS or nosZ-bearing denitrifiers have converged due to low redox potential under continuous flooding condition in the present study (Yoshida et al. Reference Yoshida, Ishii, Otsuka and Senoo2009). Another possible explanation could be the divergence among different paddy soils which might be induced by different sampling sites, parent materials or management practices, and those soils in previous studies may contain more diverse groups of nirS or nosZ-bearing denitrifiers than the paddy soil investigated in this study.
4.4. The effect of RS and/or nitrate addition on denitrifying community abundance
There was no influence of RS or RS+N treatments on the abundances of nirS or nosZ-bearing denitrifiers. However, Chen et al. (Reference Chen, Luo, Hu, Wu, Wu and Wei2010) found that RS incorporation resulted in significantly greater abundances of nirS-harbouring denitrifiers in the long-term fertilised soils. This discrepancy might be due to the short incubation period in our experiment with straw application. In this study only the N treatment markedly increased the abundance of both nirS and nosZ genes within a short time (on day 11) during the incubation suggesting that the soil nitrogen level was an important factor influencing the abundance of denitrifiers in the paddy soil (Sun et al. Reference Sun, Guo, Wang and Chu2015). The greater abundance of denitrifiers induced by nitrate addition alone has the potential to promote denitrification. This was supported by our previous study that reported that N2O emission was increased by nitrate amendment in paddy soils (Bao et al. Reference Bao, Huang, Wang, Nie, Graeme, Yao and Ding2016). Previous studies also showed that the abundance of the nirS gene was greater in fertilised (including urea, mineral fertiliser and mineral fertiliser in combination with RS) than in unfertilised paddy soil (Chen et al. Reference Chen, Luo, Hu, Wu, Wu and Wei2010), and the abundance of nirS-bearing denitrifiers positively correlated with nitrate concentration (Jones & Hallin Reference Jones and Hallin2010). A recent study also reports that long-term application of NPK fertilisers significantly increased the abundance of nosZ-bearing denitrifiers (Sun et al. Reference Sun, Guo, Wang and Chu2015). Furthermore, the abundance of soil denitrifiers may be an important factor affecting denitrifying potential activity (Philippot & Hallin Reference Philippot and Hallin2005). Morales et al. (Reference Morales, Cosart and Holben2010) have assessed the use of denitrifying gene abundance (nirS and nosZ) as for determining N2O emissions from soils. The copy numbers of nirS gene were three orders of magnitude greater than those of the nosZ gene during the whole incubation period. However, the greatest value of nosZ gene copy numbers emerged earlier (on day 11) than that of the nirS gene (on day 23). It is thus assumed that nosZ-containing denitrifiers might be more sensitive to the change in substrate concentrations than nirS-containing denitrifiers though the latter were more abundant than the former in the paddy soil studied. More studies that focus on the controlling factors affecting the abundances of nirS and nosZ genes at RNA level will be needed for a better understanding of the ecological roles of NO2– and N2O reducers and their functions in paddy soil systems.
5. Conclusions
Our study indicates that RS and RS+N induced great increases in methanogenic archaeal abundance targeting both 16S rDNA and 16S rRNA, indicating that either total or active methanogenic archaeal population sizes were more responsive to the RS application than N. In addition, RS addition resulted in obvious changes only in active methanogenic archaeal community structure and diversity targeting 16S rRNA suggesting that the community structure and diversity of methanogenic archaea were less sensitive to the RS application compared with their abundance. Unlike methanogens, the community structures and abundances of the nirS and nosZ-bearing denitrifiers, and the diversity of nirS-bearing denitrifiers responded to the addition of N alone. Investigating the dynamics of the methanogenic archaeal and denitrifying community upon RS and/or N addition in paddy soils would provide important suggestions for understanding the C and N biogeochemical cycles in rice fields, and even further for regulating CH4 and N2O emissions from rice field soils. In order to reveal the functional responses of denitrifiers to environmental changes, further study should focus on denitrification genes by mRNA-based analysis.
6. Acknowledgements
This project was supported by the Strategic Priority Research Program of Chinese Academy of Sciences (Grant No. XDB15020402), the National Natural Science Foundation of China (Grant No. 41430858, 41601242) and the Natural Science Foundation of Tianjin (Grant No. 16JCQNJC08100).