Introduction
For microwave device manufacturing, the conductivity is an important parameter to evaluate in the high-frequency (HF) range. Additively manufactured electronics (AME), produced through printing technologies, face challenges related to the important surface roughness of the substrate and reduced conductivity of the employed inks [Reference Li and Yang1].
Two of the most commonly used direct printing technologies for depositing metal layers are Aerosol Jet Printing (AJP) and micro-dispensing (MD) techniques. AJP technique enables the deposition of thin layers (thickness of a few micrometers) with fine resolution (down to 10 µm)
[Reference Cooper and Hughes2, Reference Delage, Delhote, Verdeyme, Bonnet, Carpentier, Schick, Chartier and Chaput3], while MD allows the printing of thicker conductive pastes (tens of µm) with a trace width down to 200 µm depending on the surface roughness of the substrate [Reference Kacar, Weller and Mumcu4]. These printing technologies offer the advantage of being compatible with a wide variety of deposited materials and substrate types (flexible, rigid, flat, 3D, etc.), significantly reducing both manufacturing time and steps.
However, the electrical conductivity is notably affected by the composition of the inks (silver inks in most works), where metal nanoparticles are combined with solvents and organic additives. Consequently, various curing methods such as using laser [Reference Djebbi, Delhote, Verdeyme, Tantot, Pereira, Boyer, Durand and Valentin5] or intense pulsed light [Reference Hajjaji, Delhote, Verdeyme, Piechowiak and Durand6], DC current [Reference Roberson, Wicker and MacDonald7] or infrared [Reference Gu, Yuan, Zhong, Wu, Zhou, Lin and Cui8] have been established to improve the electrical conductivity for the manufacturing of microwave devices. In this context, the characterization of the effective conductivity at microwave frequencies is important to identify the performance of the printed metal layer. The skin effect restricts current penetration to a narrow surface, and consequently, the roughness of this deposit’s surface significantly influences metallic losses, thereby impacting effective conductivity [Reference Beck and Dawson9].
Traditional methods, such as the four-probe direct-current (DC) conductivity measurement, are heavily dependent on the thickness of the metallic layer and do not account for the impact of surface roughness at microwave frequencies. Different microwave conductivity measurement methods exist, based on the transmission coefficient of a transmission line or using a resonant cavity technique inspired by the work of Feuray et al. [Reference Feuray, Delage, Abdelghani, Sence, Tantot, Bila, Frigui, Baillargeat, Verdeyme, Delhote and Staelens10]. The transmission line method using waveguide or planar coplanar and microstrip lines is based on the extraction of the conductivity through the attenuation of the line [Reference Kacar, Weller and Mumcu4]. The main limitation of this method is the necessity of long lines in order to enhance the sensitivity of the attenuation of the line to conductivity variation. Typically, for an electrical conductivity in the range of 5 MS/m, lengths around 180 mm are required to achieve an accuracy of around 26%. The resonant cavity method proposed by Djebbi et al. [Reference Djebbi, Delhote, Verdeyme, Tantot, Pereira, Boyer, Durand and Valentin5] is based on conductivity extraction from the quality factor and resonant frequency variation of selected modes while adding the metallic sample. This method enables conductivity characterization at different frequencies using different cavity dimensions. For conductivity characterization at Ku-Band, large samples are needed (diameter >50 mm), which is a limiting factor for additively printed metallic layers because printing and post-treatment time are increased, as well as the possibility of having different surface defects due to substrate surface roughness and inhomogeneity. New probe methods are also investigated by Dvorsky et al. [Reference Dvorsky, Qaseer and Zoughi11], which aim to characterize conductivities by reflection coefficient measurements. However, the authors do not provide the measurement errors associated with such a technique, even if the results were coherent with the tested samples, and a characterization at 15 GHz using this method would require a sample having a size larger than 20 mm × 20 mm.
P. Krkotić et al. [Reference Krkotić, Aguasca and O’Callaghan12] present a method for measuring the microwave surface resistance of metal coatings commonly used in additive manufacturing. The study employs a rutile dielectric resonator (DR) operating at a frequency of 9.1 GHz with a required sample size of approximately 12 × 12 mm2. Córdoba-Erazo et al. [Reference Gumbleton, Cuenca, Hefford, Nai and Porch13] used samples of 25 × 20 mm2 for a method that is designed to evaluate microwave surface resistance at frequencies associated with parallel plate resonators, specifically 5.3 GHz (transverse electromagnetic [TEM]001 mode) and 6.4 GHz (TEM010 mode) [Reference Córdoba-Erazo, Rojas-Nastrucci and Weller14].
Also, several commercial and academic systems currently exist for HF conductivity mapping, notably scanning microwave impedance microscopy (sMIM) platforms developed by Bruker [15] and Oxford Instruments [16], which offer nanometer-scale spatial resolution using AFM-based near-field probes. Academic contributions such as those by Prof. Zhi-Xun Shen (Stanford) [Reference Barber, Ma and Shen17] and Haddadi et al. [Reference Haddadi, Marzouk, Gu, Arscott, Dambrine and Lasri18] have significantly advanced near-field microwave microscopy for quantum and material analysis.
While these systems demonstrate exceptional sensitivity and resolution, they often require complex infrastructure, such as atomic force microscopes and controlled environments, and are typically suited for submicron-scale samples. In contrast, the system developed in this work is designed for robust, non-destructive conductivity characterization on small metallic patches (as small as 5 × 5 mm2), especially suited for additively manufactured structures on polymer substrates. Its contact-based configuration, high-frequency structure simulator (HFSS)-based calibration, and low-complexity integration make it a cost-effective and versatile alternative to existing solutions, particularly for surface characterization in industrial or prototyping contexts.
Therefore, rather than aiming to compete with high-end commercial systems in terms of spatial resolution, our approach offers a complementary solution, optimized for flexibility, ease of use, and small sample compatibility, which fills a practical gap in current conductivity characterization techniques.
In this contribution, an in situ characterization method of electrical conductivity is investigated using a DR-based probe at 13.28 GHz in order to limit the size of the sample under test while maintaining a measurement error comparable with other reported techniques. The introduced method thus enables a non-contact characterization of a small printed metal square (5 × 5 mm2) through the near-field interaction between the DR and the metal deposit. The objective is to be able to characterize the conductive materials used for the fabrication of AME by just having a small test sample that could be printed next to other components, when other reported methods would need much larger samples.
The DR is excited in its transverse electric mode with azimuthal index 0, radial index 1, and an open (non-integer) axial field variation denoted by δ (TE01δ mode), which is the most sensitive one to conductivity variation, and that is excited using a ridged waveguide in this paper.
In the first part of this article, the principle of the method is described as well as the simulation steps. The second part will detail the measurement setup and conductivity extraction with both methods: a resonant cavity method at 10 GHz (using 60 × 60 mm2 samples) that will be used as a reference method, and the probe method at 13 GHz with 5 × 5 mm2 squares on a dielectric substrate.
Beyond these initial validations, this method is applied to additively printed metallic squares on a poly-ether-ketone-ketone (PEKK) polymer substrate and compared to their DC conductivities.
Furthermore, the research advances the method by introducing a second-generation probe designed for contact-based characterization at the frequency of 15 GHz, enabling the evaluation of metallic samples with arbitrary dimensions. This new probe supports detailed surface conductivity mapping using a computer-driven bench, offering insights into the impact of surface roughness on HF conductivity. An earlier version of this paper was presented at the 2024 European Microwave Conference (EUMC 2024) and was published in its Proceedings [Reference Djebbi, Delhote, Verdeyme, Tantot, Pereira, Boyer and Durand19].
Characterization method principle and simulation
Method principle
The method principle is based on the quality factor variation of a DR when it is close to a metal sheet. Therefore, there will be a direct relation between the unknown electrical conductivity of the sheet and the measured unloaded Q factor; its value will be evaluated using a full-wave electromagnetic simulator. DRs can be used for compact filters or for antenna applications due to their minimal loss, lightweight, and adaptability [Reference Alsirhani, Abdalmalak, Lee, Santamaría-Botello, Segovia-Vargas and García-Muñoz20]. The selection of DRs for this characterization technique is based on their ability to serve as compact devices when compared to cavities while maintaining a relatively high-quality factor.
Based on literature and preliminary EigenMode simulations using HFSS, the TE01δ mode was selected due to its advantageous field distribution. It offers strong electric fields (Ey) near the resonator’s surface and minimal radiation loss, making it particularly sensitive to variations in surface conductivity [Reference Matthaei, Young and Jones21].
This mode has been successfully used in material characterization applications, such as the work by Córdoba-Erazo and Weller [Reference Córdoba-Erazo and Weller22], where a TE01δ-based DR was used for near-field permittivity measurements of liquids. It is also commonly used in split-post DRs for planar substrate evaluation [Reference Gungor, Olszewska-Placha, Celuch, Smajic and Leuthold23].
The field distributions of this mode in a cylindrical resonator are shown in Fig. 1.
(a) E-field of TE01δ mode vectors, (b) H-field of TE01δ mode vectors.

To couple the resonator and use it on its TE01δ mode, a waveguide excitation is selected. This choice facilitates the design of a probe, allowing the exploitation of the magnetic field leakage extending beyond the resonator to interact with the samples for characterization [Reference Matthaei, Young and Jones21]. Regarding the selection of the characterization frequency, it was based on the operational bands of our additively manufactured devices, which operate in the X and Ku bands. The chosen DR (Exxelia E4030) possesses a dielectric constant of 29.50 and a Q factor of 15,000 GHz at 10 GHz. The dimensions of the DR are as follows: height = 4 mm and radius = 2 mm.
To achieve a compact probe design, a ridged waveguide (WRD110, 11–26 GHz) is selected. This choice is driven by the objective of reducing the dimensions of the metal sample under test and the probe as well, as ridged waveguides not only offer larger bandwidths but also have more compact dimensions compared to regular waveguides [Reference Sulistyaningsih, Hamid, Khayam, Wijayanto and Munir24]. Additionally, ridged waveguides provide a better mechanical form, facilitating fixation of the DR in the desired position around the metallic ridges (Fig. 2). A hollow cylindrical Teflon support was also added in order to maintain the resonator.
(a) DR fixation into the ridged WRD 110 waveguide, (b) Electric field distribution in the ridged waveguide.

The dimensions of the DR were selected to be compatible with the 5 × 5 mm2 metal patches routinely used in our work for four-point probe DC conductivity measurements. This choice allows a direct comparison between DC and HF results using identical test samples. Accordingly, a resonator with a suitable footprint was selected to ensure strong coupling with such patch sizes.
The waveguide geometry (WRD110) was chosen based on the target operating frequency range around 13 GHz and mechanical compatibility with the resonator. Full-wave simulations were used to optimize the resonator’s placement within the guide, taking into account manufacturing constraints (e.g., machining tolerances). These considerations guided the final dimensions presented in this work.
As illustrated in Fig. 2, the DR was intentionally shifted from the center of the ridged waveguide to effectively couple the resonator on its TE01δ mode using the Ey of the waveguide. The optimal offset distance between the center of the ridged waveguide and the DR is carefully determined to achieve the maximum quality factor. Other parameters that were investigated are the dimensions of the metallic patch, set at 5 × 5 mm2 (compatible with DR dimensions), and the distance between the DR and the metallic patch. Given that the ultimate goal of this probe is to characterize metallic squares printed on polymer substrates, the simulations involve a dielectric substrate on which the metallic square is printed, all placed on a metallic support (Fig. 3).
(a) 3D geometry of the probe modeled in HFSS, used for full-wave electromagnetic simulations. With substrate and metallic square (b) Actual measurement conditions (metallic square, PEKK polymer substrate, and copper metallic support).

The measurement principle is based on the electromagnetic interaction between a DR, excited in its TE01δ mode, and a conductive square patch positioned directly underneath it. In this system, the conductive sample does not merely introduce losses to the DR mode; it behaves as a resonant structure itself, interacting with the resonator’s fields and creating a coupled system. This interaction depends critically on the geometry, size, and positioning of the patch and affects the resonance response of the whole system.
Due to the complexity of this coupling mechanism and its sensitivity to geometrical and material parameters, the relationship between Q₀ and σ is established through full-wave electromagnetic simulations using Ansys HFSS. For each conductivity value, the reflection coefficient S₁₁ is simulated, and the Q-factor is extracted using a circle-fit method in MATLAB. This process yields a Q₀(σ), which is used to determine the conductivity of unknown samples by projecting the measured Q₀.
To efficiently excite the TE₀₁δ mode, the DR is inserted into a ridged waveguide (WRD110), where the vertical Ey is strongly confined between the ridges (see Fig. 4). Meanwhile, the DR presents a null Ey at its center and a maximum at its periphery. As a result, the DR is intentionally shifted laterally inside the waveguide, so that its high-field region aligns with the maximum Ey of the waveguide. This configuration ensures proper mode excitation and optimal coupling with the sample.
(a) Electric field distribution in the ridged waveguide WRD110, (b) Lateral offset of the dielectric resonator from the waveguide center, (c) Proper TE01δ mode coupling with the resonator shifted from the center.

The effect of this offset was studied parametrically through electromagnetic simulations to maximize the coupling and thus the sensitivity of Q₀ to σ.
Two critical parameters were optimized:
• The lateral offset of the DR inside the waveguide.
• The vertical distance between the DR and the sample.
Parametric simulations revealed that optimal excitation of the TE01δ mode occurs when the dielectric resonator is laterally shifted by approximately 2.5 mm from the center of the ridged waveguide. This position aligns the high-intensity Ey regions of both the resonator and the guide, maximizing the coupling strength and leading to a sharp, well-defined resonance peak. That is, a symmetric peak that allows a proper extraction of the loaded (QL) and unloaded (Q0) quality factors, as it will be thoroughly explained in Section Probe conductivity extractions. Beyond this offset, coupling deteriorates, and the resonance becomes broader and weaker.
The vertical spacing between the DR and the metal sample was found to strongly influence the resonator’s quality factor. Distances that are too small suppress the resonance due to overcoupling, while larger distances weaken the interaction. An optimal distance of 0.25 mm yielded the highest Q₀ and best sensitivity to conductivity variations. This distance was maintained using a high-precision vertical positioning system with ±0.001 mm accuracy.
The conductive patch size plays a critical role in the formation of the coupled resonance. The 5 × 5 mm2 patch was found to be optimal, enabling full interaction between the DR’s electromagnetic field and the metal surface. Smaller patches led to asymmetric or disappearing resonances due to poor coupling, while larger patches introduced parasitic detuned resonances or field distortions. This confirmed the resonant nature of the DR–patch interaction and justified the fixed patch size used throughout this study.
Simulation steps
Simulations were conducted using the Ansys HFSS electromagnetic simulator to assess the sensitivity of the quality factor variation as a function of the square’s conductivity. In Fig. 5, an example of the reflection coefficient (S11) is presented for different electrical conductivities of the square (0.1 and 35 MS/m), showing quality factors that are respectively equal to 729 and 1972. This approach exhibits enhanced sensitivity of the probe, especially for conductivity below 20 MS/m. However, for conductivity values higher than 20 MS/m, there is a proportional increase in extraction errors. Given that this probe is specifically designed to be used with additively printed metallic deposits on polymer substrates, it is noteworthy that the conductivities in such applications tend to be low [25].
Simulated reflection coefficient response with a metal square’s conductivity equal to 0.1 MS/m (red) and 35 MS/m (green).

For instance, employing the MD technique with nScrypt technology to carry out silver deposition on PEKK substrate and using a conventional oven sintering for 17 hours typically yields DC conductivities in the range of 7 to 10 MS/m. Alternatively, the AJP technique allows reaching DC conductivities around 15–20 MS/m after a similar thermal curing of suitable silver deposits.
Probe assembly and characterization method validation
Measurement setup
In order to validate this characterization method, known metals are used, and the extracted electrical conductivities at 13.28 GHz are compared to the values measured by a resonant cavity method at the frequency of 10 GHz [Reference Djebbi, Delhote, Verdeyme, Tantot, Pereira, Boyer, Durand and Valentin5] that will be used as a reference method.
In the first place, the different parts of the probe were assembled. The dielectric resonator is first inserted into a fabricated Teflon holder, machined in-house. The WRD110 ridged waveguide was precisely machined in the lab workshop to include an insertion slot matching the Teflon holder dimensions. The assembled Teflon piece containing the DR is then press-fitted into this slot, ensuring accurate alignment and mechanical stability as shown in Fig. 6a and 6b.
(a) Before probe assembly, (b) after, (c) probe attached to a metallic support to control the vertical movement.

The resonator position is investigated through different simulations in order to maximize the quality factor sensitivity to conductivity variations. A metallic support that holds the probe (Fig. 6c) is fabricated, ensuring its vertical alignment and allowing precise control of the distance along the Z-axis through a motion controller for automated probe movement.
The detailed dimensions of the key components of the first-generation probe are provided below:
Dielectric Resonator (Exxelia E4030):
• Diameter: 4.00 mm
• Height: 4.00 mm
Ridged Waveguide (WRD110):
• Overall width (outer): 14.00 mm
• Overall height (outer): 7.59 mm
• Ridge height: 2.36 mm
• Ridge width: 2.99 mm
Metallic sample under test:
• Lateral dimensions: 5 × 5 mm2
• Thickness: 0.05–0.2 mm (depending on printing conditions) Substrate (PEKK):
• Lateral dimensions: 10 × 10 mm2
• Thickness: 1.500 mm
The measurement setup comprises a vector network analyzer (VNA) Rohde and Schwarz ZVA40, K (2.92 mm) coaxial cable, a coaxial to WRD110 adapter with K connectors, a mechanical metallic support, the probe, and a motion controller for precise control of the probe altitude (Fig. 7). Additionally, a calibration kit, including a short offset/short and load, is essential for accurate measurements. The calibration is made for the rigid waveguide and is performed on the face where the waveguide will be connected afterwards.
Complete measurement setup.

Measurement procedure – step-by-step
1. System calibration: Calibration is performed at the end of the coaxial adapter using three steps: short/offset short and load.
2. Resonator insertion and positioning: After fixing the ridged waveguide to the adapter using four screws, the DR is inserted into the waveguide using a Teflon support.
3. Sample alignment and distance control: the motion controller is utilized to drive the three axes, with the Z-axis adjusting the probe to the desired height to maximize the quality factor. This involves bringing the probe into contact with the sample and then retracting it to the specified distance. Subsequently, the X- and Y-axes are employed to center the sample, ensuring the highest possible quality factor when the DR and the square sample are aligned.
4. S11 measurement: Measure the reflection coefficient S11 over a frequency span of typically ±500 MHz around the expected resonance (13.28 GHz). Repeat the measurement several times to assess repeatability.
5. Quality factor (Q₀) extraction: Use a MATLAB implementation of the Circle Fit method to process the complex S₁₁ response. The Circle Fit theory is mainly about how the S₁₁ response describes a circular trajectory, consisting of fitting a circle to this portion of the S11 (f) and extracting the resonance frequency, the loaded quality factor, and the coupling coefficient β.
If the system is over- or under-coupled, the intrinsic quality factor Q₀ is calculated as:
 \begin{equation*}Q_{\text{0 = }}Q_L{\text{(1 + }}\beta {\text{)}}\end{equation*}
6. Conductivity extraction: Projection of the measured Q₀ onto a calibration curve Q₀(σ) obtained from full-wave electromagnetic simulations using HFSS and then using interpolation to determine the corresponding electrical conductivity σ. It is followed by the propagation of the uncertainty on Q₀ (estimated at ± 4%) onto the Q₀ (σ) curve to determine error bars on σ, as detailed in Section Probe conductivity extractions (“Uncertainty Evaluation”).
For the initial measurement, six metals: aluminum, brass, stainless steel, bronze, nickel, and carbon steel were chosen, and these were readily available in laminated sheets with a thickness of approximately between 0.1 and 0.2 mm.
Metallic squares of dimensions 5 × 5 mm2 and 60 × 60 mm2 (Fig. 8a) were fabricated to facilitate a comparison between the probe measurements and those obtained using a 10 GHz cavity method (Fig. 8b).
(a) Metal 5 × 5 mm2 squares and 60 × 60 mm2 squares (50 × 50 mm2 for carbon steel), (b) 10 GHz resonant cavity with a 60 × 60 mm2 sample closing the cavity.

Reference cavity characterization method
Cylindrical resonant cavities are widely used for the characterization of HF electrical conductivity due to their precision, analytical simplicity, and robustness. The principle relies on the excitation of resonant modes (typically TE01(2n + 1)) in a cylindrical copper cavity, allowing the extraction of the sample’s effective conductivity from the quality factor (Q) of the resonator. The setup used in this work is based on a copper cavity resonating near 10 GHz in the TE011 mode, with the sample replacing the top of the cavity. The electromagnetic energy is coupled into the resonator using non-aligned magnetic loops to avoid direct coupling and parasitic modes. The characterization procedure consists of two steps: First, a calibration measurement of the empty copper cavity is performed to determine its intrinsic Q0 and the effective conductivity of the copper. Then, the upper lid is replaced with the conductive sample to be tested (as in Fig. 8b), and the shift in Q is used to extract the unknown material’s conductivity. As expected, materials with conductivity close to copper induce higher Q values, which in turn lead to increased uncertainty. Nevertheless, the global uncertainty remains well characterized, and the method remains reliable for a wide range of conductivities.
Based on repeated measurements and full-wave simulations, the typical uncertainty on extracted conductivity is estimated to be ±5% for samples with conductivity between 1 and 30 MS/m, primarily limited by Q-factor determination accuracy.
This method has been extensively validated and offers excellent repeatability and robustness [Reference Feuray, Delage, Abdelghani, Sence, Tantot, Bila, Frigui, Baillargeat, Verdeyme, Delhote and Staelens10]. Its frequency of operation, close to 10 GHz, is sufficiently near the probe’s working frequency (13 GHz) to serve as a suitable and accurate reference for validation purposes. The stable, well-defined uncertainty model associated with this technique justifies its use as a reference standard in this study.
The equivalent electrical conductivity (and measurement errors) extracted using the resonant cavity method at 10 GHz is presented in Table 1. These values will be used as reference values and will be compared to the measurements performed with the proposed probe, as explained in the next section.
Extracted conductivity of reference metals shown in Figure 8

Probe conductivity extractions
For each sample, dimensions and thickness are measured and integrated into the simulation in order to extract the evolution of the probe quality factor as a function of the metal square’s conductivity. The measured distance between the sample and the DR is also carefully fixed by the motion controller. An optimized distance of 0.25 mm was selected and used for all the tested samples. However, small variations in the resonance frequency are observed at the same fixed distance between simulation and experiments, which could be explained by the DR alignment and assembly in the ridged waveguide that are not as perfect as they were simulated. As an example, for the aluminum sheet, the obtained trace in Fig. 9 was simulated considering the real dimensions of the sample and different simulated conductivities. This graph is then used to deduce a conductivity range of the metal from the measured quality factor.
Simulated quality factor as a function of the sample’s conductivity while considering its real size and thickness as well as the PEKK substrate dielectric constant 3.05 and loss tangent 0.006.

In that case, the measured unloaded Q (1842) corresponds to a conductivity around 22.00 MS/m, which agrees with the obtained conductivity with the resonant cavity method (23.00 ± 3.40 MS/m). The uncertainties of conductivity extraction through this method are investigated. The errors to be considered include uncertainties in the relative permittivity and loss tangent of the dielectric substrate, as well as errors associated with substrate and metal thicknesses and sample dimensions.
Uncertainty evaluation and characterization results
The uncertainty analysis was conducted in accordance with the general principles of the GUM (Guide to the Expression of Uncertainty in Measurement), using a Type B evaluation based on known tolerances, measurement specifications, and simulation-based sensitivity studies.
Several key sources of uncertainty were identified and quantified:
• Resonance frequency uncertainty due to fabrication and extraction variability: ±70 MHz
• Dielectric constant (εᵣ) of the substrate: 3.29 ± 0.06 (measured using the slotted cavity method)
• Loss tangent (tanδ): 0.0058 ± 0.0003
• Metal patch thickness: ±5 µm
• Substrate thickness: ±50 µm
• Patch lateral dimensions: ±5 µm
• VNA reflection measurement uncertainty: ±0.05 dB
Each parameter was individually varied in Ansys HFSS, and the resulting variation in the unloaded Q-factor (Q₀) was recorded. This simulation-based perturbation method allowed us to evaluate the sensitivity of Q₀ to each physical parameter. The cumulative effect of these uncertainties yielded an estimated overall uncertainty of approximately ±4% on Q₀.
The Q₀ was then used as input on the calibration curve Q₀(σ), and the uncertainty was projected accordingly to determine the final error bars on the measured conductivity (σ). Figure 9 illustrates this projection. Q₀ was extracted from the simulated and measured S11 response using a Circle Fit method, implemented in MATLAB, which fits a circle to the complex S11 response in the Smith chart. This method provides a more accurate and objective estimation of Q₀, QL, and the coupling factor and reduces the impact of non-idealities and human bias. Figure 10 shows a typical fitted circle used for Q₀ extraction.
Illustration of the Circle Fit method used for Q₀ extraction from the complex S11 response.

This evaluation was conducted for two distinct conductivities (1 and 30 MS/m). Referring to the graph in Fig. 8, the conductivity extraction errors are observed to be around 19% for low conductivities (<15 MS/m) and up to 27% for higher conductivities. The same process is applied to the other metals, with results shown in Table 1.
Characterization of printed metals on polymer substrates and roughness study
In this validation phase, the results obtained are promising, yielding conductivities that closely align with those obtained through the resonant cavity method. Then the main objective of this characterization probe is to characterize printed samples with different printing technologies (micro dispensing, AJP…) and post-treated with different techniques. For example, in our work, we are interested in conductivity improvement using laser curing. The fact that the probe is compatible with samples of reduced dimensions will help to quantify conductivity variation through the different steps in a shorter manufacturing time than using a 10 GHz resonant cavity method, for example, where large samples (60 × 60 mm2) are needed. To conclude this section, two printed silver samples with the MD technique were characterized with the proposed probe. One square was laser sintered (S1), and the second one was only dried on a hot plate for 30 min (S2), as shown in Fig. 11.
(a) Sample 1 (S1) with laser sintering, (b) S2 without laser sintering.

The printed squares have an average thickness of around 70 µm. The conductivity range obtained with the probe method (Table 2) demonstrates values lower than the measured DC conductivity. This trend is anticipated, as in HF scenarios, the roughness effect influences effective conductivity. This phenomenon is supported by various roughness models, as illustrated by Huang et al. in the gradient model [Reference Huang and Jia26].
Extracted conductivity of additively manufactured squares

Figure 12 illustrates the decrease in effective conductivity with increasing frequency for three surface roughness levels (Rq = 0.25, 0.50, and 1 µm). As expected, higher roughness leads to stronger degradation, confirming the significant role of surface roughness in HF conduction losses [Reference Chen, Tang and Mao27].
Evolution of the effective conductivity (in MS/m) as a function of frequency, for different surface roughness values: Rq = 0.25, 0.5, and 1 µm.

To better understand the variations in effective HF conductivity observed across samples, surface roughness was systematically measured using a stylus profilometer. In our measurements, two sources of surface roughness are identified: the metallic layer and the underlying polymer substrate. The latter exhibits dominant roughness features as in Fig. 13, and both contributions are considered in the evaluation of effective conductivity. The extracted root mean square roughness values (Rq) range from 5 to 7 µm.
Surface profile of a metallic trace measured by stylus profilometer over a 10 mm length.

Several models from the literature describing the impact of roughness on conductor losses were reviewed and compared, including those of Hammerstad & Jensen, Groisse, Huray, and the Gradient model. Each model is based on a different physical representation of the rough surface and is valid within specific frequency ranges:
The Hammerstad & Jensen model, based on an empirical correction factor, is accurate up to ∼5 GHz and primarily used for printed circuit board conductors with moderate roughness [Reference Hammerstad and Jensen28].
The Groisse model extends this concept up to ∼15 GHz by refining the dependence on Rq and is directly supported in HFSS through a roughness correction factor based solely on Rq [Reference Groiss, Bardi, O.Biro and Richter29].
The Huray model, or “snowball model,” is valid up to 50 GHz or more and assumes the surface is composed of spherical nodules. It requires two key parameters: the surface ratio (SR), representing the ratio of the real rough surface area to the ideal flat area, and the average nodule radius (a). These parameters were extracted in our case from SEM images using ImageJ-based image analysis techniques [Reference Huray, Oluwafemi, Loyer, Bogatin and Ye30].
The Gradient model provides a more advanced continuous approach valid up to 100 GHz and accounts for local variations in roughness with depth, but its complexity and lack of native support in HFSS made it less practical for routine use [Reference Chen, Tang and Mao27].
Based on our target frequency range (10–50 GHz) and the compatibility with our simulation environment (Ansys HFSS), we selected the Groisse and Huray models for implementation. In HFSS, the Groisse model only requires the Rq value, while the Huray model needs both the Rq- derived nodule radius (a) and SR, which we computed from SEM image analysis.
Second-generation contact-based probe for arbitrary sample dimensions
Motivation and design optimization
While the second-generation probe builds on the geometry of the first, it is based on a distinct physical mechanism. The first relies on a coupling between two resonant structures, whereas the second operates as a loaded cavity. For clarity and to reflect the natural evolution of the design, the two probes are presented sequentially in the manuscript.
The first-generation probe demonstrated promising results in characterizing small metallic samples of fixed dimensions of 5 × 5 mm2. However, its reliance on precise sample dimensions and substrate properties limited its practical applications. To address these limitations, a second-generation contact-based probe was developed with enhanced versatility. The primary objective was to enable conductivity characterization for samples of any dimensions and varying surface properties while maintaining or improving sensitivity to electrical conductivity variations.
The main innovation in this design is the incorporation of a metallic (copper) cylindrical cavity around the dielectric resonator (DR). The internal diameter of the cavity is fixed to 5 mm for a height of 3.3 mm, enabling a resonating system around the frequency of 15 GHz and providing the best balance between measurable Q factors and sensitivity to the conductivity of the metal sample to be tested. Figure 14 shows the different elements that constitute the second-generation probe and their assembly.
Configuration of the second-generation probe with a cylindrical cavity around the DR in contact with the characterized metallic part.

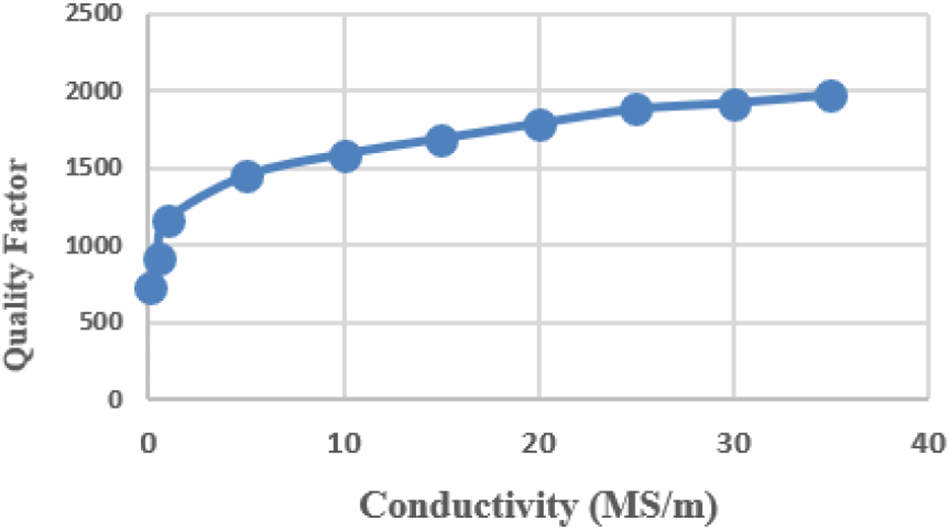
Unlike the previous design, where Q-factor sensitivity was dependent on sample thickness and dimensions, this new configuration standardizes the extraction process, allowing for consistent results using the same chart of quality factor variation as a function of conductivity. This was achieved through electromagnetic simulations using Ansys HFSS, which optimized the cavity geometry, positioning, and interaction with the DR. The Q-factor variations observed in the simulations ranged from 830 to 2583 for conductivities between 0.1 and 30 MS/m (Fig. 15). Above 25 MS/m, sensitivity decreased, consistent with the expected field distribution effects at higher conductivities. The addition of a cylindrical cavity also minimized uncertainties related to sample positioning and ensured uniform interaction with the DR’s electromagnetic fields.
Quality factor variation as a function of the conductivity of the second-generation probe.

Experimental validation with reference metals
For the attachment of the cylindrical metallic part to the first designed structure, silver conductive glue was initially considered for this task. But the high temperatures required for curing risked causing deformations or modifications to the Teflon part. Ultimately, an acrylic-based adhesive was used. This early-stage solution is functional and enables the realization of several tests, but remains very delicate, as the cylinder frequently detaches after repeated contact with the sample, complicating measurement consistency. The probe assembly is shown in Fig. 16 and was sufficient as a proof of concept, even if a better mechanical assembly is required to provide long-term robustness for repeated measurements.
Probe assembly with the added copper cylinder around the DR.

To validate the performance improvements, the second-generation probe was tested on a set of reference metals, including aluminum, brass, stainless steel, bronze, nickel, and carbon steel, as for the first-generation probe. The results, summarized in Table 3, demonstrate excellent agreement between the two methods, with acceptable uncertainty margins.
Extracted conductivity of reference metals shown in Figure 8 with the second-generation probe

The probe’s precision was particularly evident for low-conductivity materials, where the uncertainties were limited to approximately 4%. For higher conductivities, deviations increased slightly due to the reduced sensitivity of the Q-factor to conductivity variations in this range. The obtained results are satisfactory but could be further optimized by addressing various sources of error to reduce uncertainties. This method will also be applied to additively manufactured metals treated with laser sintering, featuring larger surfaces than 5 × 5 mm2 and deposited on various substrates. The main advantage of this second-generation probe is its ability to adapt to samples of any dimensions and properties, marking a significant step forward in HF conductivity characterization.
Characterization of additively manufactured metals of arbitrary dimensions
A series of metallic deposits (10 × 10 mm2, Fig. 13) printed on glass substrates using the nScrypt system served as test samples. These deposits underwent laser sintering tests and DC conductivity measurement, which serve as a reference in order to compare with the HF characterizations. Table 4 presents the obtained characterization results using the second-generation probe in comparison with the DC conductivity measurement.
Comparison of DC conductivity and 15 GHz (probe of 2nd generation) conductivity of laser-sintered deposits printed on glass

These results demonstrate slightly lower HF conductivities compared to DC measurements. This discrepancy is largely attributed to the significant surface roughness of the printed metallic deposits. Surface topography analysis of one deposit, illustrated in a profilometer scan over a 2 mm area (Fig. 17), revealed pronounced height variations, with undulations reaching depths of up to 15 µm. These features are inherent to the successive extrusion of conductive ink filaments. Such surface irregularities have a pronounced impact on effective HF conductivity. For instance, a DC conductivity of 3 MS/m corresponds to a skin depth of approximately 2.3 µm at 15 GHz. Given that the root mean square roughness (Rq) of the deposits is between 3 and 5 µm, the roughness significantly exceeds the skin depth, thereby diminishing conduction efficiency at this frequency.
Topographical surface profile of sample V3 measured over a 2 mm area using a profilometer and the tested V1, V2, and V3 samples (10 × 10 mm2) (Due to the uncontrolled nature of surface roughness in printed electronics, the resulting roughness varies between samples).

This analysis demonstrates the critical role that surface roughness plays in degrading effective HF conductivity and provides valuable insights into the achievable conductivity range for additively manufactured metals operating in the Ku-band. Moreover, an additional advantage of the second-generation probe is its ability to conduct localized conductivity measurements across various regions of a large conductive surface, enabling the creation of a conductivity map. This mapping capability is particularly useful for correlating surface roughness with potential printing defects in specific areas, offering a comprehensive tool for quality assessment and performance prediction in HF devices. In the next section, this functionality is applied to perform surface mapping on a sample with variable surface roughness, validating the method’s effectiveness in characterizing HF conductivity under diverse surface conditions.
High-frequency surface conductivity mapping
Electrical conductivity mapping is a widely employed technique in DC characterization, often used to measure the resistivity of metals based on the thickness of specific zones. This approach typically relies on measurement probes to assess the conductivity across defined areas of a surface. In the literature, methods such as the Eddy Current technique utilize magnetic induction to assess surface resistivity through the interaction of time-varying magnetic fields with conductive materials [31].
In HF characterization, the challenge shifts to evaluating how surface roughness impacts effective conductivity, particularly at microwave frequencies. The second-generation probe offers a capability for localized HF conductivity mapping, enabling the correlation of surface quality directly with electromagnetic losses. This feature is especially critical for additively manufactured components, as in our case of research, where surface roughness often varies significantly across different regions.
Surface conductivity mapping using cylindrical cavity
To establish a baseline for comparing our results, we began by conducting surface conductivity mapping using a 35 GHz resonant cavity with a 12.5 mm diameter, applied to various metallic samples having different surface irregularities. The method presented in Section Reference cavity characterization method is still applied here with just a smaller cavity in order to translate its TE011 mode close to 35 GHz. These samples, provided by AML Innovation (France), underwent diverse surface smoothing processes, resulting in varying and non-uniform roughness levels.
The samples are composed of a thick (20–40 µm) layer of conductive Ag-based coating that was applied on a titanium plate. Four distinct types of samples were analyzed: untreated (raw), lightly polished, micro sandblasted, and mirror-polished. Each sample underwent progressively intensive polishing, ranging from unprocessed metal to a highly polished mirror finish.
These samples, measuring 29 × 40 mm2, were large enough to facilitate characterization using the resonant cavity method, with each measurement focusing on a 12.5 mm diameter region. After the conductivity measurements, the surface roughness of each characterized zone was measured and correlated with the conductivity results. This approach highlighted the significant influence of surface roughness on the electrical properties of the metallic deposits. The measurements revealed a strong correlation between surface roughness and conductivity. For instance, the mirror-polished sample, with the lowest surface roughness (0.02 µm) observed, exhibited a conductivity of close to 20 MS/m. In contrast, the untreated sample, with an average surface roughness of approximately 4.5 µm, demonstrated conductivities ranging from 0.8 MS/m to 0.96 MS/m at 35 GHz. It is worth noting that the surface roughness of the untreated sample exceeded the skin depth at 35 GHz (3 µm), underscoring the substantial impact of roughness on effective conductivity at high frequencies.
These findings were visually supported by a conductivity map for each sample, accompanied by a color-coded scale representing conductivity and roughness values across the tested regions, as shown in Fig. 18.
Surface mapping of the HF conductivity of the different polished metals with measured surface roughness.

Surface conductivity mapping using the second-generation probe
The conductivity mapping process using the probe involved dividing the metal sample into zones, each with a diameter of 5 mm, as demonstrated in Fig. 19. The probe, equipped with a computer-driven motion controller, was systematically positioned over each zone to measure the Q-factor, from which the conductivity was extracted. The micro sandblasted metallic sample was selected for this validation, as it presents notable variations in conductivity within its surface.
Characterization areas of the micro sandblasted sample for probe measurements.

Figure 20 illustrates the conductivity mapping of the micro sandblasted metal surface across different zones, with dashed lines indicating the characterization areas used for the 15 GHz cavity method. An average conductivity value for each zone was calculated to compare with those obtained using the cylindrical cavity method with a larger 12.5 mm diameter.
Surface mapping of the HF conductivity (unit is MS/m) of a micro sandblasted sample (exact conductivity in white).

The obtained results show that the conductivity values measured with the contact probe generally align with those from the cylindrical cavity method at 35 GHz. However, the probe results are slightly higher, attributed to the amplified influence of surface roughness at high frequencies, particularly at 35 GHz. The discrepancy between the two methods becomes more pronounced for higher conductivities compared to lower ones, due to increased extraction errors as conductivity rises.
These results are highly promising and demonstrate the potential of this new method for precise mapping of metallic surface conductivities with a small spatial resolution of 5 mm at 15 GHz.
Beyond providing detailed conductivity mapping, this approach also indirectly reflects surface conditions, offering a means to characterize roughness and other surface properties critical for HF applications.
Córdoba-Erazo et al. [Reference Córdoba-Erazo, Rojas-Nastrucci and Weller14] present a localized method for HF conductivity mapping using a near-field microwave probe with a 50 µm tip diameter. This enables conductivity measurements on surface areas as small as 100 × 100 µm2, with results correlated to surface roughness measured via profilometry. Their work achieves high sensitivity in a conductivity range of 0.5 to 10 MS/m and roughness values from 0.1 to 5 µm. While offering excellent spatial resolution and greater efficiency for localized scanning, this method is less practical for larger samples, such as 30 to 40 mm surfaces.
In comparison, our second-generation probe offers a good balance between resolution and scalability, with a scanning diameter of 5 mm, making it suitable for characterizing larger surfaces over several centimeters.
Compared to studies of Dvorsky et al. [Reference Dvorsky, Qaseer and Zoughi11] and Krkotić et al. [Reference Krkotić, Aguasca and O’Callaghan12], which operate at similar frequencies, the proposed probes exhibit a more compact design and require significantly smaller sample surfaces. This feature is particularly beneficial for accelerating the development and optimization of conductive inks or printing parameters, as it reduces both material usage and processing time. On the other hand, while the near-field methods demonstrate outstanding spatial resolution, they are primarily intended for submicron samples and laboratory environments (discussed in references [Reference Córdoba-Erazo, Rojas-Nastrucci and Weller14–Reference Haddadi, Marzouk, Gu, Arscott, Dambrine and Lasri18]). The samples targeted in our study, based on additive manufacturing techniques, are typically millimetric in size and involve different practical constraints.
Moreover, the proposed measurement setup is robust, low-footprint, and compatible with deployment close to additive manufacturing equipment. This enables real-time or near-line testing of metallic deposits during fabrication, offering a practical tool for iterative evaluation of ink formulations, curing strategies, or deposition uniformity.
A comparative summary with key state-of-the-art techniques is presented in Table 5 below.
Comparative overview of HF conductivity characterization techniques

Conclusion
This study presents significant advancements in the characterization of electrical conductivity at microwave frequencies, addressing the challenges posed by additively manufactured metallic layers. Initially, a contactless probe method was introduced, utilizing a DR excited in the TE01δ mode at 13.28 GHz. The approach enabled the characterization of small metallic samples (5 × 5 mm2) with notable accuracy, as validated by comparison with a resonant cavity method at 10 GHz. This validation demonstrated strong agreement between the two methods, particularly for low conductivity materials (<20 MS/m), where the probe’s uncertainties remained minimal. These results provided a robust foundation for further exploration of the conductivity of additively printed metallic deposits and their curing processes.
Building on the strengths and limitations of the first-generation probe, a second-generation contact-based probe was developed to overcome the reliance on precise sample dimensions and substrate dependencies. The new design incorporates a cylindrical cavity around the DR, enabling consistent and scalable conductivity characterization for samples of arbitrary sizes. This significant enhancement eliminates the need for recalibrating extraction charts for varying sample geometries, improving measurement efficiency and reliability. The second-generation probe demonstrated its ability to characterize larger metallic deposits (e.g., 10 × 10 mm2 and more), but it needs to be in contact with them.
A key advancement of this work lies in the ability of the second-generation probe to perform detailed surface conductivity mapping. This feature allows localized measurements of electrical conductivity at microwave frequency, facilitating the identification of variations caused by surface roughness or defects in the metallic layers. Through a case study using a micro-sandblasted metallic sample, the probe successfully correlated surface roughness with effective conductivity. The mapping capability also provides a pathway for evaluating large, non-homogeneous surfaces using a computer-controlled bench, which is critical for the characterization of additively manufactured components.
Looking forward, the integration of an automated alignment system and extending the probe’s operational frequency range are the next steps to enhance the characterization system. Additionally, the implementation of iterative algorithms for automated conductivity extraction using electromagnetic simulations will further refine the accuracy and reduce user dependency.
Acknowledgement
This activity is part of the TRECAFA project supported by the Nouvelle-Aquitaine region and cofounded by the CTTC (Limoges, France). The measurements were conducted at the PLATINOM platform (www.unilim.fr/platinom), supported by the European Regional Development Fund (ERDF) and the French government in collaboration with the Nouvelle-Aquitaine region (FEDER-PILIM 2015-2020). The authors would like to thank AML Innovation for providing the samples used with the second generation of the proposed probe.
Funding statement
This activity was supported the region Nouvelle-Aquitaine (TRECAFA project) and the CTTC.
Competing interests
The authors report no conflict of interest.

Dr Roua Djebbi received her Ph.D. degree in Science and Engineering for Information from the University of Limoges, France, in December 2024. Her doctoral research focused on “Contributions to the Realization of Hybrid Additive Manufacturing Technologies for 3D Multi-material Microwave Components.” Her main research interests include the design and characterization of high-frequency components using advanced additive manufacturing techniques.

Dr Nicolas Delhote (44 years old) received his Ph.D. degree in 2007 from the University of Limoges, Limoges, France, and has been with the XLIM research Institute since that date. He specializes in 3D manufacturing technologies to fabricate RF and millimeter wave passive components (filters, waveguides, and RF transitions) and tunable variants. He has particularly focused most of his activity on additive manufacturing technologies and advanced materials for high-end applications (space telecommunications, airborne radar applications, and high-frequency wireless telecommunications). He has been the head of the MACAO research group since 2016 (6 permanent members, 11 Ph.D. students, and postdoc).

Pr Serge Verdeyme received a Ph.D. from the University of Limoges, Limoges, France, in 1989. He is currently a professor at XLIM, Laboratory of the CNRS and the University of Limoges, and works in the RF System Department. His primary field of interest concerns the design and optimization of microwave components.

Dr Olivier Tantot received the Ph.D. degree in electronics from the University of Limoges, Limoges, France, in 1994. Since 1994, he has been a Researcher at the Institut de Recherche en Communications Optiques et Microondes, Limoges, France. Since 1997, he has been an Associate Professor at XLIM Laboratory of Limoges, Limoges, France. He works on new methods of material characterization for thin films or bulk materials at low and high frequencies. More recently, his interest has focused on the characterization of microwaves at
very high temperatures. He also has an interest in microwave tunable filters for space applications and additive manufacturing for RF components.

Dr Elodie Pereira obtained her PhD from the University of Limoges in 2010, following experimental research on surface processes. With eight years of experience in cermet coatings for electromagnetic shielding and the semiconductor industry, she joined the Centre for Technology Transfers in Ceramics (CTTC) in Limoges in 2018 as a Project Manager. Currently, she oversees projects related to Additive Manufacturing Electronics (AME) and the development of a pilot line for hybrid 3D-AME.

Eng. Laurence Boyer has a technical background in chemistry and materials. She has 15 years of experience in the ceramic industry acquired in France, Spain, in the UK. She joined the Centre for Technology Transfers in Ceramics (CTTC) at Limoges in 2018 as the head of the Resourcing and Technologies Department for defining and monitoring the collaborative research and scientific resourcing activities. She is in charge of a team composed of doctors, engineers, and technicians working on the development of new materials and manufacturing processes of technical ceramics. She also uses her international experience to set up and carry out European projects and the dissemination of results.

Dr Olivier Durand received his Ph.D. at the University of Limoges in 2006 after fundamental research work on the crystallography of tellurium oxides. After a 3-year postdoctoral fellowship on ceramic processes, he joined the Centre for Technology Transfers in Ceramics (CTTC) at Limoges in 2009, working as a project manager for 5 years and then as the Materials and Processes Department manager for 3 years. He has registered one patent and has collaborated on five research articles. He is currently the CEO of CTTC, a Research and Technology Organization specializing in ceramic materials and the processes thereof.