1. Introduction and aim of the study
The reconstruction of the past kinematics and tectonic history in ancient fold–thrust belts requires the knowledge of the successive local/regional directions of shortening through time. Fractures are the most common response of brittlely deformed rocks submitted to tectonic stresses and are therefore classical and reliable indicators of palaeostress/strain patterns in sedimentary rocks.
Fold geometry and kinematics have for a long time been recognized as the most important factors that control fracturing. Stearn & Friedman (Reference Stearns and Friedman1972) proposed a pioneering classification of fold-related fractures, including an axial extensional set running parallel to the fold axis, a cross-axial extensional set oriented perpendicular to the fold axis and two sets of conjugate shear fractures oblique to the fold axis with their obtuse angle intersecting the trend of the fold axis. Since then, numerous studies have attempted to relate the development of mesostructures to either the structural domains of the fold (e.g. McQuillan, Reference McQuillan1974; Srivastava & Engelder, Reference Srivastava and Engelder1990; Fischer, Woodward & Mitchell, Reference Fischer, Woodward and Mitchell1992; Erslev & Mayborn, Reference Erslev and Mayborn1997; Thorbjornsen & Dunne, Reference Thorbjornsen and Dunne1997) or to quantitatively estimated curvature of strata (Lisle, Reference Lisle, Cosgrove and Ameen2000; Hennings, Reference Hennings2000; Bergbauer & Pollard, Reference Bergbauer and Pollard2004). Alternatively, recent works have instead attempted to relate orientation and intensity of macrostructures (such as fractures and cleavages) and microstructures to the progressive deformation of sedimentary strata during folding (Sanderson, Reference Sanderson1982; Couzens & Dunne, Reference Couzens and Dunne1994; Anastasio et al. Reference Anastasio, Fisher, Messina and Holl1997; Storti & Salvini, Reference Storti and Salvini2001; Tavani et al. Reference Tavani, Storti, Fernandez, Munoz and Salvini2006; Bellahsen, Fiore & Pollard, Reference Bellahsen, Fiore and Pollard2006; Amrouch et al. Reference Amrouch, Lacombe, Bellahsen, Daniel and Callot2010a, Reference Amrouch, Robion, Callot, Lacombe, Daniel, Bellahsen and Faureb).
However, several studies have also drawn attention to the occurrence within folded strata of fracture sets having originated before folding and being unrelated to either fold geometry or kinematics (e.g. Bergbauer & Pollard, Reference Bergbauer and Pollard2004; Bellahsen, Fiore & Pollard, Reference Bellahsen, Fiore and Pollard2006; Ahmadhadi, Lacombe & Daniel, Reference Ahmadhadi, Lacombe, Daniel, Lacombe, Lavé, Vergès and Roure2007; Ahmadhadi et al. Reference Ahmadhadi, Daniel, Azzizadeh and Lacombe2008). These fractures are commonly reopened or sheared or passively tilted during folding, but interestingly it has been argued that they could also have prevented development of classical sets of fold-related fractures. Occurrence of such pre-folding fracture sets within folded strata obviously changes the common view of fracture–fold relationships; not only have these non-fold-related fractures to be carefully considered in order to build realistic conceptual fold–fracture models, but they are potential witnesses of the early tectonic history including stress build-up in collisional forelands when strata were still horizontal. Reconstructing the pre-folding shortening directions therefore requires careful characterization and analysis of these fractures.
The study of fracture patterns and their possible genetic relationships to cover folding is of key importance in the Zagros. Several giant oil fields are found, especially in the Dezful Embayment (Fig. 1a). The Asmari Formation is an Oligocene–Early Miocene platform carbonate which is the most prolific oil reservoir in Iran, and it is commonly regarded as a classic fractured carbonate reservoir, with production properties that depend strongly on the existence of fracture networks (e.g. Stephenson et al. Reference Stephenson, Koopman, Hillgartner, McQuillan, Bourne, Noad, Rawnsley, Lonergan, Jolly, Rawnsley and Sanderson2007). Basically, fracture systems observed in folded strata in the Zagros result from the interplay between kinematic boundary conditions (e.g. far-field collisional stresses transmitted away from the Arabia–Central Iran plate boundary, foreland flexural stresses, etc.) and local deformational events such as fold growth or movements along major faults.
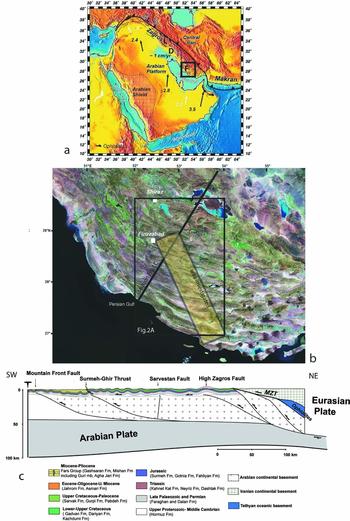
(Colour online) Geological setting. (a) Geodynamic setting of the Arabia–Eurasia collision. Arabia–Eurasia convergence vectors after NUVEL-1 (DeMets et al. Reference Demets, Gordon, Argus and Stein1990) (black) and GPS studies (Vernant et al. Reference Vernant, Nilforoushan, Hatzfeld, Abbassi, Vigny, Masson, Nankali, Martinod, Ashtiani, Bayer, Tavakoli and Chéry2004) (white). Velocities in cm yr−1. The frame indicates the study area. L – Lorestan; D – Dezful; F – Fars. (b) Landsat TM image (https://zulu.ssc.nasa.gov/mrsid/) with locations of Figure 2a, the area investigated and the section shown in (c). (c) Crustal-scale section of the Zagros Simply Folded Belt (after Mouthereau et al. Reference Mouthereau, Tensi, Bellahsen, Lacombe, De Boisgrollier and Kargar2007b). MZT – Main Zagros Thrust.

While fracture systems were extensively described in the Dezful Embayment (Fig. 1a), there are only few available fracture data in the Fars (e.g. Mobasher & Babaie, Reference Mobasher and Babaie2008). The aim of this paper is to take advantage of the outstanding quality of the outcrops in the Simply Folded Belt (SFB) in the Fars to present new observations that help to distinguish fracture sets unrelated to folding from those which are clearly fold-related and, using complementary fault-slip data as kinematic-palaeostress indicators, to use these non-fold-related fracture sets to better constrain successive palaeostress/strain patterns related to the early regional tectonic history of the Zagros.
The fact that contractional tectonics shortly postdates deposition of the (mainly Neogene) sedimentary formations from which measurements were mainly taken is an interesting characteristic of this area with respect to this objective. Indeed, the observed structures cannot be related to many tectonic events but rather to stress build-up in the Zagros cover and progressive deformation related to the Zagros orogeny. Our work will also benefit from the availability of fault-slip data (Lacombe et al. Reference Lacombe, Mouthereau, Kargar and Meyer2006), calcite twin data (Lacombe et al. Reference Lacombe, Amrouch, Mouthereau and Dissez2007) and anisotropy of magnetic susceptibility (AMS) data (Aubourg et al. Reference Aubourg, Smith, Eshrahi, Lacombe, Authemayou, Amrouch, Bellier, Mouthereau, Leturmy and Robin2010) in neighbouring areas. Comparison of newly collected microtectonic data with existing palaeostress/strain data will allow us to discuss competing kinematic models proposed to account for palaeostress changes though time (e.g. clockwise block rotations related to the kinematics of the right-lateral Kazerun–Karebass–Sabz-Pushan fault zones (Bahktari et al. Reference Bakhtari, Frizon De Lamotte, Aubourg and Hassanzadeh1998; Lacombe et al. Reference Lacombe, Mouthereau, Kargar and Meyer2006) versus regional anticlockwise rotation of the regional stress field during the Neogene (Aubourg et al. Reference Aubourg, Smith, Eshrahi, Lacombe, Authemayou, Amrouch, Bellier, Mouthereau, Leturmy and Robin2010)), and eventually to propose alternative explanations. Finally, although this study does not intend to provide a detailed description of fracture parameters like length distribution and density as a function of bed thickness, lithology and structural position, careful examination of cross-cutting/abutting relationships between fracture sets and relations to far-field (orogenic) stress fields will help to improve the fracture database, better understand the relationships between fracturing and regional tectonic evolution and possibly contribute to generating more realistic geological models of fractured reservoirs in the Zagros.
2. Geological setting
2.a. Structural setting
The Zagros belt results from the ongoing collision between Arabia and Central Iran that likely initiated in Late Eocene times (e.g. Allen & Armstrong, Reference Allen and Armstrong2008). About one third of the Arabia–Eurasia convergence (c. 7 mm yr−1) is taken up in the Zagros as suggested by GPS studies (Vernant et al. Reference Vernant, Nilforoushan, Hatzfeld, Abbassi, Vigny, Masson, Nankali, Martinod, Ashtiani, Bayer, Tavakoli and Chéry2004; Fig. 1a).
The Zagros belt results from folding (and thrusting) of the Palaeozoic–Mesozoic deposits of the Arabian margin and platform and of the overlying Cenozoic foreland sequence (Fig. 1b, c). The belt is segmented into several zones that differ according to their structural style and depositional history (Stocklin, Reference Stocklin1968; Falcon, Reference Falcon and Spencer1974; Berberian & King, Reference Berberian and King1981): the segments are, from west to east, the Lorestan salient, the Dezful recess and the Fars salient (Fig. 1a). The Fars arc extends from the Kazerun–Boradjan right-lateral strike-slip fault (Baker, Jackson & Priestly, Reference Baker, Jackson and Priestley1993; Sepehr & Cosgrove, Reference Sepehr and Cosgrove2005) to the west to the Minab–Zendan fault system that accommodates the transition from the Zagros collisional belt to the Makran subduction accretionary wedge (Regard et al. Reference Regard, Bellier, Thomas, Abbassi, Mercier, Shabanian, Feghhi and Soleymani2004) to the east. While in the Western-Central Zagros the Arabia–Eurasia convergence is partitioned into NE–SW shortening perpendicular to the belt and right-lateral strike-slip faulting along the Main Recent Fault, deformation in the Fars involves shortening nearly parallel to convergence, which is perpendicular to the nearly E–W trend of the belt (Talebian & Jackson, Reference Talebian and Jackson2004). The N–S to N150° right-lateral strike-slip fault system (Kazerun–Borazjan fault, Karebass fault, Sabz-Pushan fault and Sarvestan fault; Figs 2a, 3) in the western part of the Fars has been interpreted as an orogen-scale horse-tail strike-slip fault termination, which transfers and distributes orogen-parallel dextral slip achieved along the Main Recent Fault into the thrusts and folds of the Fars (Authemayou et al. Reference Authemayou, Chardon, Bellier, Malekzadeh, Shabanian and Abbassi2006).
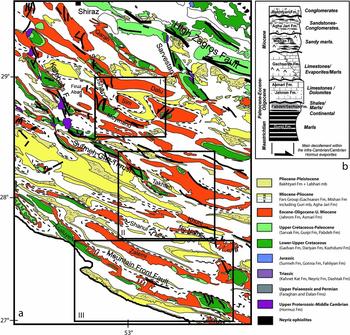
(Colour online) (a) Geological map of the Fars based on a compilation of geological 1:250000 and 1:100000 scale maps from the National Iranian Oil Company (modified after Mouthereau et al. Reference Mouthereau, Tensi, Bellahsen, Lacombe, De Boisgrollier and Kargar2007b). I, II and III are the structural domains investigated (see text and Figs 4, 7 and 9). (b) Main characteristics of the Upper Cretaceous–Cenozoic sedimentary units of the Fars.

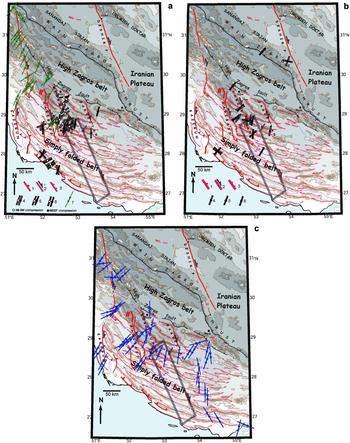
(Colour online) Schematic structural map of Fars. Topographic contours (GTOPO30) and shading every 500 m. Main anticline axes are reported. (a) 1 – thrust; 2 – strike-slip fault; 3 – normal fault; 4–6 – palaeostress axes deduced from fault-slip data after Lacombe et al. (Reference Lacombe, Mouthereau, Kargar and Meyer2006) (4 & 5 – main compressional trends for strike-slip and reverse stress regimes, respectively; 6 – main extensional belt-parallel trend); 7 – palaeostress axes deduced from fault-slip data after Authemayou et al. (Reference Authemayou, Chardon, Bellier, Malekzadeh, Shabanian and Abbassi2006): main compressional trends (stress regimes undifferentiated). (b) Palaeostress axes deduced from calcite twin data (Lacombe et al. Reference Lacombe, Amrouch, Mouthereau and Dissez2007); 4 & 5 – main compressional trends for strike-slip and reverse stress regimes, respectively; 6 – main extensional belt-parallel trend. (c) Orientations of layer-parallel shortening deduced from AMS data (Aubourg et al. Reference Aubourg, Smith, Eshrahi, Lacombe, Authemayou, Amrouch, Bellier, Mouthereau, Leturmy and Robin2010).

The Main Zagros Thrust (also referred to as the Main Zagros Reverse Fault) is the geological boundary between the Zagros belt to the south and Mesozoic metamorphic and magmatic belts exposed on the Iranian plateau to the north (Fig. 1c). It corresponds to the former suture between the colliding plates of Central Iran and Arabia. South of the Main Zagros Thrust, the High Zagros Belt consists of a NW–SE-trending thrust belt bounded to the SW by the High Zagros Fault and upthrusted onto the Simply Folded Belt. The Simply Folded Belt is characterized by regular, open anticlines with wavelengths typically of 15–20 km and lengths of 100 km and more (Figs 1b, 2). These folds probably mainly result from buckling and subsequent detachment folding of the 10–12 km thick sedimentary cover above a single master décollement lying within the Hormuz salt (Colman-Sadd, Reference Colman-Sadd1978; Mouthereau et al. Reference Mouthereau, Lacombe, Tensi, Bellahsen, Kargar, Amrouch, Lacombe, Lavé, Vergès and Roure2007a, Reference Mouthereau, Tensi, Bellahsen, Lacombe, De Boisgrollier and Kargarb). Second-order intermediate décollement levels are, however, required to account for shorter fold wavelengths (Sherkati, Letouzey & Frizon de Lamotte, Reference Sherkati, Letouzey and Frizon De Lamotte2006).
High-angle thrusts in the basement have been thought for a long time to be responsible for the major earthquakes along the Zagros belt (Jackson, Reference Jackson1980; Jackson & McKenzie, Reference Jackson and McKenzie1984; Berberian, Reference Berberian1995). These basement structures likely played a role in the deformation of the cover by localizing some topographic steps and major thrust faults (Berberian, Reference Berberian1995; Mouthereau et al. Reference Mouthereau, Tensi, Bellahsen, Lacombe, De Boisgrollier and Kargar2007b). Among the WNW–ESE-trending basement faults are the Surmeh–Ghir Thrust and the Mountain Front Fault (Figs 1c, 2a), two segmented blind thrusts with striking structural, topographic and seismotectonic characteristics (Berberian, Reference Berberian1995). Critical wedge modelling (Mouthereau, Lacombe & Meyer, Reference Mouthereau, Lacombe and Meyer2006) supports the theory that both the deformation and the topography in the Fars are mainly controlled by basement-involved shortening. Balanced cross-sections also clearly emphasize that the basement is involved in shortening (Molinaro et al. Reference Molinaro, Leturmy, Guezou, Frizon De Lamotte and Eshraghi2005; Sherkati, Letouzey & Frizon de Lamotte, Reference Sherkati, Letouzey and Frizon De Lamotte2006; Mouthereau et al. Reference Mouthereau, Tensi, Bellahsen, Lacombe, De Boisgrollier and Kargar2007b) through major thrusts rooting into a deep décollement level being localized somewhere within the lower crust, as already proposed in other recent mountain belts (e.g. Lacombe & Mouthereau, Reference Lacombe and Mouthereau2002).
As a result, the Fars shows evidence for coeval thin-skinned and thick-skinned tectonic styles of deformation: seismicity occurs both in the basement and the cover (Roustaei et al. Reference Roustaei, Nissen, Abbassi, Gholamzadeh, Ghorashi, Tatar, Yamini-Fard, Bergman, Jackson and Parsons2010), and the cover is deformed through a combination of large-scale detachment folds and forced folds (i.e. folds forced by slip along underlying basement faults) (Sattarzadeh, Cosgrove & Vita-Finzi, Reference Sattarzadeh, Cosgrove, Vita-Finzi, Cosgrove and Ameen2000; Mouthereau et al. Reference Mouthereau, Tensi, Bellahsen, Lacombe, De Boisgrollier and Kargar2007b; Oveisi et al. Reference Oveisi, Lave, Van Der Beek, Carcaillet, Benedetti and Aubourg2009).
In the westernmost Fars, Sherkati, Letouzey & Frizon de Lamotte (Reference Sherkati, Letouzey and Frizon De Lamotte2006) estimated a cover shortening of 34 km in the Simply Folded Belt and a total shortening of 50 km throughout the entire belt. In the southeastern Fars, Molinaro et al. (Reference Molinaro, Leturmy, Guezou, Frizon De Lamotte and Eshraghi2005) estimated a cover shortening of 15–20 km in the Simply Folded Belt and a total shortening of 45 km throughout the entire belt. In contrast with these estimates that consider basement-involved shortening, McQuarrie (Reference McQuarrie2004) proposed an amount of shortening of 67 km based on a pure thin-skinned tectonic style. Mouthereau et al. (Reference Mouthereau, Tensi, Bellahsen, Lacombe, De Boisgrollier and Kargar2007b) proposed an estimate of only 15 km of horizontal shortening in the Simply Folded Belt and suggested that about 50 km of shortening was taken up by the underplating of the Arabian crust beneath the Iranian plateau; the complete section (Fig. 1c) accounts for a total shortening of ~65 km to 78 km.
2.b. Sedimentary setting
After the Permo-Triassic rifting event of the Arabian Tethyan margin and the Zagros passive continental margin setting of Jurassic–Middle Cretaceous times, the tectonic evolution during Late Cretaceous time was governed by the obduction of the Tethyan ophiolites onto the Arabian margin. At that time, the basinal Gurpi Formation covered nearly the entire Zagros basin in response to the flexure of the Arabian plate. During Paleocene–Eocene times, the Main Front Fault isolated two sub-basins in the foreland basin, a shallow one to the NE in which clastic rocks and carbonates accumulated and a deeper basin to the SW where shales of the Pabdeh Formation were deposited (Sepehr & Cosgrove, Reference Sepehr and Cosgrove2005). In Oligocene time, the shallow marine platform limestones of the Asmari Fm deposited unconformably above the Pabdeh Fm in the SW Zagros basin and also covered the Jahrom Fm in the NE Fars region. Above, the Miocene Fars Group (Gachsaran, Mishan, Agha Jari formations; Fig. 2b) represents a first-order regressive sequence (up to 3000 m) that reflects the progressive infilling of the Zagros foreland basin. The initiation of foreland siliciclastic deposition is delayed toward the foreland: the onset of clastic deposition is Chattian (~ 28 Ma) in the northern Fars whereas it is Burdigalian (20–16 Ma) near the Persian Gulf (Mouthereau et al. Reference Mouthereau, Tensi, Bellahsen, Lacombe, De Boisgrollier and Kargar2007b).
2.c. Sequence of deformation in the Zagros Simply Folded Belt
While the precise age of the onset of the Arabia–Eurasia collision is still a matter of discussion (e.g. Allen, Jackson & Walker, Reference Allen, Jackson and Walker2004; Allen & Armstrong, Reference Allen and Armstrong2008), the initiation and the propagation of folding in the Zagros belt and the Cenozoic flexural subsidence of the Arabian margin may be constrained by the study of the synorogenic sedimentary deposits and local syn-folding unconformities. Hessami et al. (Reference Hessami, Koyi, Talbot, Tabasi and Shabanian2001) proposed that early fold development occurred on the margin as early as the Paleocene, probably in relation to ophiolitic nappe emplacement, marked by the unconformable attitude of the Jahrom Fm above the Pabdeh Fm. Sherkati, Letouzey & Frizon de Lamotte, (Reference Sherkati, Letouzey and Frizon De Lamotte2006) alternatively proposed that the onset of collision occurred during the Asmari period, in agreement with the age of inception of collision proposed by Agard et al. (Reference Agard, Omrani, Jolivet and Mouthereau2005), and that the onset of folding occurred rather in Early Miocene time. In the Zagros, this observation is consistent with the replacement of the Oligocene carbonates by siliciclastic sedimentation in Early Miocene time (Beydoun, Clarke & Stoneley, Reference Beydoun, Clarke, Stoneley, Macqueen and Leckie1992) and with the onset of deposition of synorogenic sandstones of the Razak Formation precisely dated at 19.7 Ma using magnetostratigraphy (Khadivi et al. Reference Khadivi, Mouthereau, Larasoana, Verges, Lacombe, Khademi, Beamud, Melinte-Dobrinescu and Suc2010).
The increasing flexural loading about 10 Ma ago recorded by the acceleration of subsidence and deposition of the Agha Jari deltaic Fm reveals the concomitant acceleration of contraction and hinterland denudation. Above, the lowest Bakhtyari 1 unit, made of marine conglomerates, is either pre-folding or syn-folding with growth strata (e.g. on the northern flank of the Chahar–Makan syncline and on the northern flank of the Qalat syncline, respectively; Khadivi et al. Reference Khadivi, Mouthereau, Larasoana, Verges, Lacombe, Khademi, Beamud, Melinte-Dobrinescu and Suc2010; Fig. 3). The transition to the growth strata of the Bakhtyari 1 conglomerates, and thus the beginning of the deformation in the northern Fars, is dated at approximately 14.8 Ma (Khadivi et al. Reference Khadivi, Mouthereau, Larasoana, Verges, Lacombe, Khademi, Beamud, Melinte-Dobrinescu and Suc2010; for a comparison with dating of synorogenic deposits from the Lorestan and Dezful, see also Homke et al. Reference Homke, Verges, Garces, Emami and Karpuz2004; Fakhari et al. Reference Fakhari, Axen, Horton, Hassanzadeh and Amini2008; H. Emami, unpub. Ph.D. thesis, Univ. de Barcelona, 2008).
One can therefore estimate an age of 14–15 Ma for the initiation of cover deformation in the northern part of the Simply Folded Belt. This phase followed (or was roughly coeval with) the initiation of basement tectonics: in the Fars, the first-order thickness distribution of synorogenic Gasharan, Mishan and Agha Jari formations reveals a wedge-shaped subsidence profile typical of foreland basins opened toward the tectonic load, but second-order depositional patterns and facies variations within the Lower and Middle Miocene strata in the vicinity of known basement faults (such as the Surmeh–Ghir Thrust) also support early basement-involved deformation (Mouthereau et al. Reference Mouthereau, Lacombe, Tensi, Bellahsen, Kargar, Amrouch, Lacombe, Lavé, Vergès and Roure2007a, Reference Mouthereau, Tensi, Bellahsen, Lacombe, De Boisgrollier and Kargarb).
During a second phase of folding, the uppermost Bakhtyari 1 conglomerates were tilted and sealed by the regional-scale unconformity outlined by the horizontal Bakhtyari 2 conglomerates, which are still not dated. By considering the total cropping-out thickness of Bakhtyari 1 conglomerates and extrapolating with accumulation rates derived from magnetostratigraphy, one obtains a maximum age of 12.4 Ma for the second stage of folding (Khadivi et al. Reference Khadivi, Mouthereau, Larasoana, Verges, Lacombe, Khademi, Beamud, Melinte-Dobrinescu and Suc2010). This major stage of folding fits with the last phase of deformation in which increasing contraction and erosion led to generalized deep-seated basement thrusting, regional uplift and cover folding.
2.d. Stress/strain patterns in the western Fars
Palaeostress/strain data from microfaults (Lacombe et al. Reference Lacombe, Mouthereau, Kargar and Meyer2006; Authemayou et al. Reference Authemayou, Chardon, Bellier, Malekzadeh, Shabanian and Abbassi2006), calcite twins (Lacombe et al. Reference Lacombe, Amrouch, Mouthereau and Dissez2007) and AMS data (Aubourg et al. Reference Aubourg, Smith, Eshrahi, Lacombe, Authemayou, Amrouch, Bellier, Mouthereau, Leturmy and Robin2010) (Fig. 3), collected within sedimentary formations covering the Paleocene to Pleistocene time interval, support an anticlockwise rotation of the stress field direction. AMS data from Paleocene carbonates in the Simply Folded Belt record a N47° (N047°E) layer-parallel shortening (LPS) during Early to Middle Miocene time, while the Miocene clastic deposits recorded a N38° LPS prior to and during folding within the Simply Folded Belt at the end of Miocene time (Aubourg et al. Reference Aubourg, Smith, Eshrahi, Lacombe, Authemayou, Amrouch, Bellier, Mouthereau, Leturmy and Robin2010). Similarly, fault-slip data also support an anticlockwise rotation of the compressional trend through time from NE to N020° during the Neogene (Lacombe et al. Reference Lacombe, Mouthereau, Kargar and Meyer2006). During the last stage of folding in the Simply Folded Belt, the Plio-Quaternary palaeostress trends are consistently parallel to the N020° present-day shortening direction (Lacombe et al. Reference Lacombe, Mouthereau, Kargar and Meyer2006, Reference Lacombe, Amrouch, Mouthereau and Dissez2007). The change from NE to N020° compression is either owing to a regional anticlockwise rotation of the regional stress field due to far-field geodynamic change (e.g. McQuarrie et al. Reference McQuarrie, Stock, Verdel and Wernicke2003), or alternatively to clockwise block rotations close to the set of right-lateral strike-slip faults bounding the Fars arc to the west (e.g. Bahktari et al. Reference Bakhtari, Frizon De Lamotte, Aubourg and Hassanzadeh1998; Lacombe et al. Reference Lacombe, Mouthereau, Kargar and Meyer2006).
3. Previous fracture studies in the Zagros
In the Zagros, fracture studies were mainly reported from the Dezful area. Some studies focused on the description of fracture sets within single anticlines, while others investigated fracture sets from a regional point of view. In the Khaviz anticline, Wennberg et al. (Reference Wennberg, Svånå, Azizzadeh, Aqrawi, Brockbank, Lyslo and Ogilvie2007) recognized two types of features: diffuse fracturing and fracture swarms. The diffuse fractures form networks and comprise structures grouped into four classical bed-perpendicular fold-related fractures sets: two orthogonal fracture sets oriented parallel and perpendicular to the fold axis, and two conjugate fracture sets oblique to the fold axis with their obtuse angle intersecting the trend of the fold axis. The density and height of these fractures in the Asmari Fm are controlled by the mechanical stratigraphy. The work by Stephenson et al. (Reference Stephenson, Koopman, Hillgartner, McQuillan, Bourne, Noad, Rawnsley, Lonergan, Jolly, Rawnsley and Sanderson2007) in the Kuh-e Pahn anticline focused mainly on fracture corridors. Some corridors striking parallel to the fold axis were recognized in the crest of the anticline and were interpreted as fold-related. The main control on the lateral variation of these crestal fractures is the interplay between the mechanisms of flexural slip that create mechanical barriers that prevent the vertical propagation of fractures, and outer arc extension. In contrast, other well-developed fracture corridors recognized from satellite imagery, clearly spatially unrelated to the detachment folding of the cover series, were interpreted as the distributed effect of deep-seated basement fault reactivation. Stephenson et al.'s (Reference Stephenson, Koopman, Hillgartner, McQuillan, Bourne, Noad, Rawnsley, Lonergan, Jolly, Rawnsley and Sanderson2007) main conclusion was that where a basement-rooted fault intersects a fold, it will strongly influence the orientation of fractures, owing to reactivation, irrespective of the structural domain of the fold in which they are developed.
On a more regional perspective, McQuillan (Reference McQuillan1973, Reference McQuillan1974) used aerial photos and outcrop observations to demonstrate that many (if not all) regional fracture sets bear no relation to the geometry of folds formed during the Mio-Pliocene Zagros orogeny. This was later challenged by Gholipour (Reference Gholipour1998) who claimed that fractures in the Asmari reservoirs are associated with vertical and axial growth of concentric folding and therefore that they are mostly fold-related. Ahmadhadi, Lacombe & Daniel (Reference Ahmadhadi, Lacombe, Daniel, Lacombe, Lavé, Vergès and Roure2007) and Ahmadhadi et al. (Reference Ahmadhadi, Daniel, Azzizadeh and Lacombe2008) combined field observations and aerial/satellite image interpretation on several anticlines to propose a tectonic model highlighting the widespread development of pre-folding veins and other extensional micro/mesostructures in the Central Zagros folded belt. Rather than focusing on a single fold, their data collection was organized to cover a large area and several folds in order to be able to differentiate regional trends from fold-related ones, i.e. to capture the fracture trends which may be significant at the regional scale. Most joints/veins affecting the Asmari Fm were found to pre-date the main folding episode. The earliest regional vein set associated with LPS stylolites was interpreted as marking the onset of collisional stress build-up in the cover, while the others, spatially and geometrically unrelated to cover folds, likely initiated in response to large-scale flexure/drape folds above N–S and N140° inherited basement faults reactivated under the regional NE compression. These early formed veins were reactivated (reopened and/or sheared) during Mio-Pliocene cover folding (Ahmadhadi et al. Reference Ahmadhadi, Daniel, Azzizadeh and Lacombe2008).
In contrast, only a few works have been devoted to collecting and interpreting microstructural data in the Fars Simply Folded belt. Among them, Authemayou et al. (Reference Authemayou, Chardon, Bellier, Malekzadeh, Shabanian and Abbassi2006) focused on the Kazerun–Boradjan strike-slip segments, while Lacombe et al. (Reference Lacombe, Mouthereau, Kargar and Meyer2006) reconstructed the stress field evolution from the Neogene to the present by means of inversion of fault-slip data and earthquake focal mechanisms. The only study concerned with pure fracture analysis was carried out by Mobasher & Babaie (Reference Mobasher and Babaie2008) who used remote sensing to analyse large-scale fracture systems and to relate them to either folding or strike-slip faulting along the Kazerun fault. The fold-related system includes classical axial and cross-axial sets that trend parallel and perpendicular to the fold axis, respectively, and two oblique sets that trend at moderate angles to the axial trace. The second system of fractures includes five sets which formed owing to displacement along the Kazerun fault. Right-lateral slip along the Kazerun fault caused the rotation of the axial plane of the folds and of the fold-related fracture system. Shortening directions, independently determined from the fold- and fault-related fracture systems, consistently trend ~N050°, perpendicular to the general NW–SE trend of the Zagros belt. However, no field observations were carried out in order to relate large-scale fracture trends recognized from remote sensing to outcrop-scale fracture data, so this study remains purely geometric, without any check of actual fracture attitude and kinematics of the inferred shear/extensional fracture sets.
There is therefore a lack of available fracture data in the Fars, especially away from the western bounding strike-slip fault zones (Fig. 3). Yet, the value of outcrop-scale observations is of primary interest for a hydrocarbon province in a mountainous area where acquiring good seismic data may be technically difficult and where resolution on the imaging of structural geometries at the reservoir scale may be poor. This paper will focus on new fracture observations in the central and coastal Fars that can be used to discuss the relationships between development of the fracture network and folding and to further constrain the tectonic evolution of the Zagros. Collection of fracture data was carried out along a ~ 200 km long transect running from east of Firuzabad to the Persian Gulf, across several folds (Figs 1, 3). The purpose of this work was to capture the fracture trends which may provide potential information on early tectonic movements and early stress patterns at the regional scale. The availability of fault-slip data, calcite twin data and AMS data in neighbouring areas (Fig. 3), together with new fault-slip data collected from the same places as the fractures, allows for an efficient discussion of the tectonic/kinematic significance of the fracture sets in the Zagros.
4. Methods
4.a. Principle of fracture analysis
In the field, the more numerous microstructures are rectilinear fractures, with a regular spacing and a significant length. These fractures generally show opening displacement with no observable shear movements and can be classified as joints or veins characterized by various thicknesses of cement. Hackle marks along fracture walls support a tensile mode of deformation. Joints and veins have been treated the same in the orientation analysis in accordance with their common opening mode (Engelder, Reference Engelder and Atkinson1987). They were taken as indicative of palaeostress orientations, the palaeo-σ3 axis being perpendicular to their trend. Complementary observations of stylolites or striated microfaults help to additionally constrain the attitude of the palaeo-σ1 axis. In a few outcrops, small shear displacements, splay veins, extensional jogs and striated calcite coatings were observed, supporting a shearing mode of deformation.
In the following, fracture sets will be defined based on a common range of strike and dip orientation and a common deformation mode. We present stereonets of the orientation data at each measurement site that are not weighted by abundance, as we believe that this can be biased by outcrop conditions. However, we carefully observed when a fracture set is less systematic (less planar, parallel, and horizontally and vertically through-going) and less abundant than others. The stereonets were generated with a computer code developed by the IFP (Institut Français du Pétrole) using an original method for the automatic definition of fracture clusters (M. Guiton, pers. comm.). Each fracture is represented as a plane with an orientation given by the unit normal vector as a point (pole) on the unit sphere. The density of fractures is estimated at each point on this sphere using an Epanechnikov kernel. Outliers (non-recurring fracture orientations) are removed by filtering, and the density distribution is smoothed by manually changing the variance of the kernel (Wollmer, Reference Wollmer1995). In a first step, cluster centres are identified by searching for local maxima of the density map using the method introduced by Kittler (Reference Kittler1976). This step results in the definition of a number of fracture sets and a guess for the mean pole of each set. This guess allows each fracture to be classified probabilistically using its distance from each cluster centre. Then the algorithm presented by Marcotte & Henry (Reference Marcotte and Henry2002) is used to finalize the fracture classification. This method is based on the assumption of a bivariate normal distribution of fractures within a set. The results of this analysis are presented in a polar stereonet using the Lambert projection on the lower hemisphere with great circles representing the mean plane of each fracture set.
In general, the large size of the investigated folds (height up to 2 km, wavelength of nearly 10–15 km, length up to 100 km) and their limited accessibility owing to the scarcity of road-cuts prevented systematic analysis of fractures in all the structural domains of the folds (e.g. limbs, hinge and termination), and access was granted only in some parts of the fold limbs. So, rather than focusing on a given fold, we investigated folded strata in three different structural domains defined by their location with respect to the regional morphostructural elements (Figs 2a, 3).
4.b. Principle of the analysis of striated microfaults in terms of palaeostress
In addition to fracture sets, striated faults have been observed in most surveyed sites. A quantitative inversion of distinct families of fault-slip data was carried out using the Angelier (Reference Angelier1990) method. The basic principle consists of finding the best fit between the observed directions and senses of slip on numerous faults and the theoretical shear stress induced on these planes by the tensor solution of the inverse problem. The results are the local orientation (trend and plunge) of the three principal stress axes σ1, σ2 and σ3 (with σ1 ≥ σ2 ≥ σ3, compression considered positive) and the Φ ratio between differential stress magnitudes (Φ = (σ2 − σ3)/(σ1− σ3), with 0 ≤ Φ ≤ 1). This ratio characterizes the shape of the stress ellipsoid, and therefore the actual nature of the stress regime (e.g. reverse/strike-slip if σ3 is vertical and Φ close to 0). The quality of the tensor calculated is given by numerical estimators such as the average angle between the computed shear stresses and the actual striations on fault surfaces. Uncertainties in the principal stress directions depend mainly on the geometric distribution of fault-slip data; under optimal conditions, the accuracy on the trend and plunge of stress axes is better than 10°.
4.c. Chronology of structures
4.c.1. Chronology of fractures
As mentioned earlier, members of a fracture set share both a common range of strike and dip orientation and a common deformation mode. Common orientation was generally identified only after removal of bedding dip by stereographic rotation. Commonality of fracture orientation after removal of bedding dip, where the fractures are sub-parallel and bed-perpendicular, is taken as supportive of a pre-tilting origin (Hancock, Reference Hancock1985), although it should be kept in mind that bed-perpendicular tensile fractures (or cleavages) can develop at the onset of folding (mimicking true pre-folding features) if flexural slip is very efficient and layer-parallel shear occurs at very low friction so that two principal stresses remain nearly parallel to bedding (e.g. Tavani et al. Reference Tavani, Storti, Fernandez, Munoz and Salvini2006). Fractures striking either perpendicular or parallel to bedding strike are not affected by rotation of bedding to remove the dip and may be interpreted as occurring during any stage of fold growth. To unfold the orientation data, we assumed that the sites did not suffer any rotation around a vertical axis and that the local fold axis is horizontal. Following these hypotheses, the fracture data were unfolded using the rotation necessary to bring the average bedding back to a horizontal attitude. Diagrams of ‘folded’ and ‘unfolded’ fracture sets will be presented in order to discuss their chronological relationship with folding (Figs 4, 7, 9). This chronology is of first importance to test various existing models of relationships between fracturing and folding and to establish a link between this chronology and the regional tectonic evolution. Chronology between pre-folding fracture sets was mainly established on the basis of consideration of the length and spacing of fractures in addition to careful examination of cross-cutting/abutting relationships.
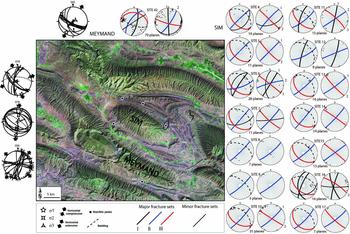
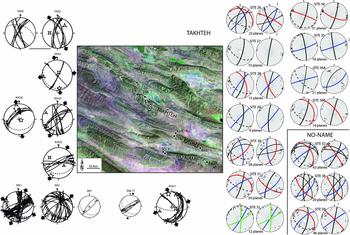
(Colour online) Results of fracture analysis in domain I (location on Fig. 2a); Landsat image of the domain with reported investigated sites. Fault-slip data – thin curves on stereodiagrams represent fault planes and dots with arrows indicate striations with related sense of slip. Fault-slip data from sites 59 and 79 are reported from Lacombe et al. (Reference Lacombe, Mouthereau, Kargar and Meyer2006). Fracture sets – poles of individual fracture planes are reported on stereodiagrams as dots. Major and minor sets of fractures are defined by the mean planes of each fracture set (best-fit planes, see text). Minor fracture sets are not considered in the paper. For each site of fracture measurements, the stereodiagram on the left shows raw fracture data, while the stereodiagram on the right shows unfolded fracture data. 1, 2, 3 denote relative chronology inferred from field observations.

4.c.2. Chronology of faults
The identification and separation of successive generations of faults and related stress regimes is based on both mechanical incompatibility between fault slips (individual misfits of fault slips with the computed stress tensors) and relative chronology observations (superimposed striations on fault surfaces, cross-cutting relationships between faults, etc.). Like for fractures, particular attention was paid to horizontal-axis rotations of rock masses due to folding. We assume that one of the three principal stress axes of a tensor is generally vertical. If a fault set formed before folding and was secondarily tilted with the bedding, the tensor calculated on this set does not display a vertical axis. Instead, one of the stress axes is generally found perpendicular to bedding, whereas the two others lie within the bedding plane. In such a case, the fault system is interpreted after unfolding. For our sites located in the regular large fold limbs (Fig. 2a), this criterion is of primary importance for establishing a chronology with respect to folding.
5. Results: main fracture patterns and local palaeostress reconstructions
Three structural domains defined by their location with respect to the regional morphostructural elements (Fig. 2a) were investigated. Domain I covers an area close to the N–S Sabz-Pushan fault zone, where some folds (e.g. Dalu–Sefidar, Meymand–Naura) are bent and the Sim anticline dies out. Domain II is located immediately south of the main Surmeh–Ghir Thrust, that corresponds to a 1500 m topographic step vanishing eastward and that connects to the Karebass Fault (Fig. 2a). Domain III is close to the Mountain Front Fault that also corresponds to a 500–1000 m high topographic step, which, like the Surmeh–Ghir–Karebass fault system, is outlined by the rise of Cretaceous rocks up to the surface within the cores of the anticlines (Fig. 2a). Both the Main Front Fault and the Surmeh–Ghir Thrust correspond to inherited Tethyan normal faults reactivated during the Zagros orogeny as high-angle basement thrusts, sometimes going through up to the surface.
5.a. Domain I: Sim and Meymand anticlines
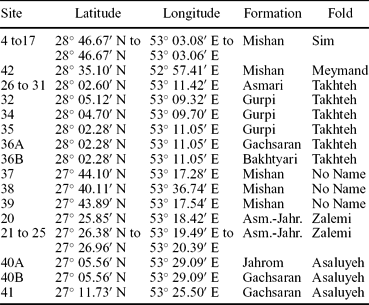
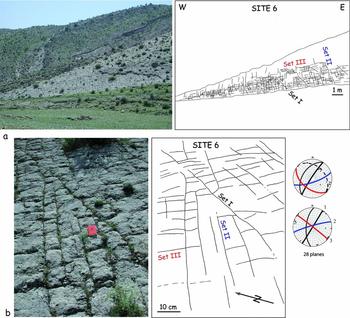
The Sim anticline is a roughly rounded anticline located east of Firuzabad. The morphology of the anticline is given by the Asmari–Jahrom limestones and dolostones (Fig. 2a). Numerous sites (4 to 17) have been investigated, especially within the Mishan carbonates (Fig. 4; Table 1). At each site, at least two sets of fractures were recognized and measured. Using site 6 as an example, located in the 30°NE-dipping northern limb of the fold, three sets of fractures could be distinguished (Fig. 5). The first one (set I) is a bed-perpendicular, regularly spaced joint set oriented N020–030° after unfolding (Fig. 4). A second bed-perpendicular joint set, oriented N060° after unfolding (set II), generally abuts against the previous set (Fig. 5), and therefore postdates it. The last set is made of bed-perpendicular joints parallel to the bedding strike (set III); most fractures of this set abut against fractures of the previous sets. Several other sites (see especially site 11) allow observation of the same sets with consistent relative chronology.
Characteristics of sites of fracture measurements

(Colour online) Fracture patterns observed at Sim anticline (site 6). (a) General view and line-drawing of the pavement. (b) Detail of the pavement showing the three main fracture sets. For stereodiagrams, same caption as in Figure 4.

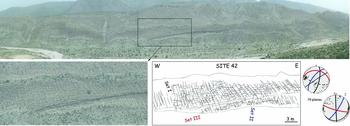
The Meymand (or Meymand–Naura) anticline is located south of Sim anticline (Fig. 4). Close to the Sabz-Pushan fault zone, the core of the anticline is deeply eroded and Cretaceous rocks crop out there. Most of the anticline is covered by the Asmari–Jahrom limestones. The great length of this anticline allows observations of its flank along several tens of kilometres. On the southern limb, spectacular pavements within the Mishan Formation can be observed. Like at Sim anticline, three main fracture sets can be easily identified on the steeply dipping (70°) southern limb (Figs 4, 6). In site 42, the first set (I) is bed-perpendicular and strikes nearly N–S after unfolding (Figs 4, 6). The second set abuts against set I; it strikes N035° after unfolding. The third set, trending N100°, is also bed-perpendicular and strikes parallel to the fold axis. Some of the fractures are clearly joints, but some are obviously cemented veins with opening reaching several millimetres to 1 cm. The fractures’ morphology and regular spacing, the occurrence of remnants of calcitic cements and the absence of positive evidence of a shearing mode of deformation are taken as indicative of an extensional opening mode for these sets.
(Colour online) Fracture patterns observed at Meymand anticline (site 42). General view of the pavement, with detail showing the three main fracture sets. For stereodiagrams, same caption as in Figure 4.

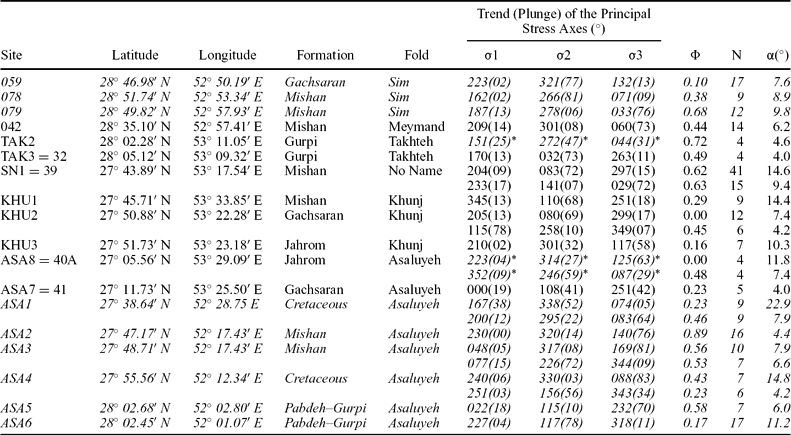
Fault-slip data are sparse for this fold. However, reverse faults observed in site 42 (Fig. 4; Table 2), which are either bedding-parallel or dip slightly steeper or less than the bedding, indicate a probably syn-folding N035° compression. Site 59 located between Sim and Meymand (Fig. 4) indicates a sub-horizontal σ1 axis oriented N043° and a sub-perpendicular horizontal σ3 axis; the σ1 axis is consistent with observed stylolitic peaks (Fig. 4). However, the very low bedding dip prevents any conclusion about the chronology of occurrence of the strike-slip faults with respect to folding. The orientation of the σ1 axes computed from these strike-slip faults is consistent with the orientation of set II, which may confirm the pure opening mode of this set. Site 78 illustrates a post-folding strike-slip stress regime with a σ1 axis oriented N170°.
Results of determination of palaeostress tensors from fault-slip data

Trend and plunge of each stress axis are given in degrees. * and italics indicate unfolded stress axes. φ = (σ2 − σ3)/(σ1− σ3), with 0 φ Φ ≤ 1; N – number of striated fault planes consistent with the tensor; α – average angle between actual slip and computed shear stress, in degrees; italics – palaeostress tensors from previous studies (Lacombe et al. Reference Lacombe, Mouthereau, Kargar and Meyer2006).
5.b. Domain II: Takhteh, Khunj and No-Name anticlines
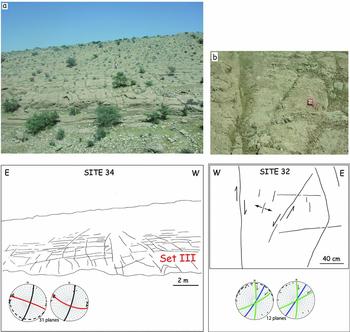
Several sites were investigated in the Takhteh anticline (Figs 7, 8) in Upper Cretaceous formations (Gurpi), Oligo-Miocene formations (Asmari) and even the Upper Miocene–Pliocene Bakhtyari conglomerates (Table 1). Sites within the Asmari limestones (26 to 31) reveal three main fracture sets. Set I is bed-perpendicular and oriented N160° (site 26) to N–S to N010° (sites 27, 28 and 29) after unfolding (Fig. 7); Set II is also perpendicular to bedding and strikes NE–SW. Set III is also bed-perpendicular and trends NW–SE to NNW–SSE after unfolding. In the Gurpi Fm (sites 34 and 35), a bed-perpendicular set oriented nearly N–S (N160° to N020°) after unfolding is recognized (set I); a set oriented ENE (set II) abuts against the previous one. Although striations could not be observed, some fractures were also determined as having had a shearing mode of deformation: in site 32 (Fig. 8), they appear as conjugate sets, the N–S-trending set being right-lateral and the N060° one being left-lateral, consistent with a σ1 axis oriented N030° in the acute angle between the two sets. In the Bakhtyari conglomerates (site 36B), N020° fractures (set I) are observed, together with set III fractures parallel to the fold axis. Site TAK2 reveals few left-lateral, N–S to N020°-trending small-scale strike-slip faults consistent with a pre-folding NNW σ1 axis parallel to the N160° fracture set observed in the nearby site 35. This nearly N–S compression is, rather, post-folding in site TAK3, although bedding dip is too low to ascertain this chronology.

(Colour online) Fracture patterns observed at Takhteh anticline (site 32). (a) General view and line-drawing of the pavement. (b) Detail of the pavement showing the relationships between joints and shear fracture sets. For stereodiagrams, same caption as in Figure 4.

In the No-Name anticline, three main bed-perpendicular fracture sets were observed in the Mishan limestones. Observations in the southern limb of the fold (site 39) indicate N040°- and N010°-trending joint sets sub-perpendicular to bedding (sets II and I). A third bed-perpendicular fracture set strikes parallel to the fold axis (set III). In site 38, in the northern limb, these sets trend N045° (set II) and N–S to N020° (set I), oblique at a high angle to the fold axis; the last one is trending N120° to N140°, i.e. parallel to the fold axis (set III). Geometrical characteristics of these fracture sets indicates that they are mainly joints and veins. The N040° joints show additional evidence of late left-lateral shear reactivation under a later N020° compression as indicated by striated vein calcite coating (site 37, Fig. 7). Fault-slip data collected in nearby sites indicate a likely early- to syn-folding N045° compression marked by reverse and strike-slip faults, and a post-folding N020° compression marked by nearly conjugate strike-slip fault systems (site SN1).
In the Khunj anticline, the absence of suitable pavements precludes any statistically representative fracture measurements, and only striated microfaults could be measured (Table 2). In the Mishan Fm (site KHU1), a post-folding N160° compression marked by strike-slip faults has been reconstructed (Fig. 7). In the Champeh Member of the Gachsaran Fm (site KHU2), a post-folding N020° compression is marked also by strike-slip fault systems (Fig. 7); a nearly fold-perpendicular N160° extension is marked by normal faults. In the Jahrom Fm (site KHU3), some N045° to E–W-trending subvertical left-lateral strike-slip faults also support a post-folding N020° to N040° compressional trend, but this trend is poorly constrained in the absence of measured conjugate right-lateral strike-slip faults.
5.c. Domain III: Zalemi and Asaluyeh anticlines
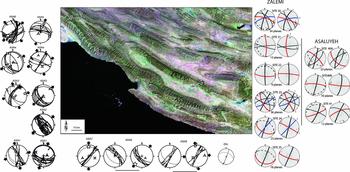
The Asaluyeh anticline is one of the longest folds in the Zagros; it runs nearly parallel to the Persian Gulf coast and reveals outcrops of Upper Cretaceous (Gurpi) to Oligocene and Miocene (Jahrom and Gachsaran fms) sediments (Fig. 2a). The investigated sites are located in the eastern part of the fold, and therefore complement a previous study carried out by Lacombe et al. (Reference Lacombe, Mouthereau, Kargar and Meyer2006) in its western part (Fig. 9). On the southern limb, very few joints were measured within the Jahrom Fm (site 40A) and Gachsaran Fm (40B); one set is clearly bed-perpendicular and strikes parallel to the fold axis. Minor other sets trend N010° and N040°, but they are not numerous enough to allow a statistical treatment. The chronology between these sets remains unconstrained. Fault-slip data measured in the same sites and also on the northern limb reveal a nearly N–S post-folding compression mainly marked by left-lateral strike-slip faults trending N045° in site ASA7, but this compression seems pre-folding in site ASA8. A N045° compression marked by small-scale reverse faults pre-dates folding (site ASA8).
(Colour online) Results of fracture analysis in domain III (location on Fig. 2a); Landsat image of the domain with reported investigated sites. For stereodiagrams, same caption as in Figure 4. Fault-slip data from sites ASA1 to ASA6 in the western part of the Asaluyeh anticline are reported from Lacombe et al. (Reference Lacombe, Mouthereau, Kargar and Meyer2006).

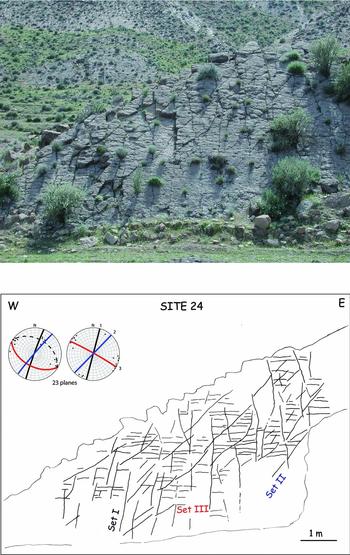
The Zalemi anticline is located north of the Asaluyeh anticline (Fig. 9). Most fracture measurements were made in the Asmari and Jahrom fms. Again, three main fracture sets were identified. One set (set I) is trending N–S to N030° with a subvertical attitude. A set (II) trending N045° to N060° abuts against the previous set (site 24, Fig. 10). Both joint systems are oblique at a high angle to the fold axis. A third set, bed-perpendicular and trending N110° (site 22) to N140° (site 23), i.e. nearly parallel to the fold axis, abut on fractures from sets I and II. Some fractures of set II were reactivated as left-lateral strike-slip faults (e.g. site ZAL).
(Colour online) Fracture patterns observed at Zalemi anticline (site 24). General view of the pavement showing the three main fracture sets. For stereodiagrams, same caption as in Figure 4.

6. Discussion
6.a. Significance of fracture sets: pre-folding v. fold-related fracture patterns
In all the domains considered, we identified three major joint/vein sets. Set I is generally bed-perpendicular, and trends N–S to N020–030° in its unfolded attitude, depending on the place where it was measured. Set II is also bed-perpendicular, and strikes NE to ENE (N040° to N070°) after unfolding. Set III is bed-perpendicular and trends almost always parallel to the local fold axis (E–W to NNW–SSE, mainly WNW–ESE). Minor sets are also found in places, but they are not systematically observed from one site to another and since they are statistically less abundant than the three major sets, they will be considered as having only local significance and thus will not be considered hereinafter.
Set III fractures trending parallel to the fold axis and observed in most (if not all) sites, including in the most recent Bakhtyari Formation, are interpreted as extensional axial fractures generated in response to the fold outer arc extension, hence typically fold-related. Taking this assumption into account, fracture sets, either bed-perpendicular (in most cases) or not strictly perpendicular, against which fractures of set III abut, were considered pre-tilting (or possibly syn-tilting if perpendicular to the fold axis, i.e. cross-axial). Note that among pre-tilting fractures, the distinction between pre-folding and early-folding fractures is based on the kinematic consistency with folding. While an early-folding set formed during LPS in a consistent stress field (i.e. a fold-related extensional cross-axial set or oblique shear fracture set), a pre-folding set also pre-dates bed tilting but may have originated in a different stress field (unrelated to folding).
The classical schema of fold-related fractures (Price, Reference Price1966; Stearns & Friedman, Reference Stearns and Friedman1972) is unclear in most of our sites. Because of the irregular local orientation of fold axes, and their overall progressive rotation from NW–SE to WNW–ESE to even E–W eastward (Figs 1b, 2), and sometimes the small angle between set I and set II orientations, it is sometimes difficult to unambiguously identify which of these sets is the true fold-related cross-axial set perpendicular to the fold axis. According to the definition above, set II should be considered as early-folding since it is kinematically consistent with folding (fold-related, cross-axial set), and since fault-slip data support that the NE compression is likely syn-folding, at least in domains I and III; set I, at least in these domains, is instead, rather, pre-folding. However, the formation of sets I and II in most sites supports that during LPS, the local compressional trend slightly changed in space and time within a stable regional (collisional) stress field, so the distinction is somewhat academic.
Post-folding fractures are theoretically observed in a sub-vertical attitude and they cut across the tilted strata irrespective of the geometry of the fold if they originated from a later, different stress field. In our study, post-folding fracture sets have in their present attitude a trend similar to that of the early-folding fractures of set I after unfolding. This means that, in a certain manner, these late fractures are also somewhat fold-related; they possibly reflect a late (post-tilting) stage of fracture development during late fold tightening.
6.b. Interpretation of fractures in terms of stress regimes
Initial mode I opening of sets I and II, whatever the relative chronology between them, allows us to define the orientation of the palaeo-σ3 axes associated with formation of these sets, which are horizontal after the fracture sets have been unfolded. The actual attitude of the palaeo-σ1 axes is not constrained by the study of the fractures only, which means that these sets could have formed either in an extensional stress regime (vertical palaeo-σ1 axes) or in a strike-slip stress regime (horizontal palaeo-σ1 axes). However, the close association of these fracture sets with sub-horizontal stylolitic peaks (in unfolded attitude) indicates that these sets developed rather in a strike-slip stress regime. In addition, independent stress tensor calculations from striated microfaults also indicate that compression was mainly horizontal in the whole region investigated, and the computed σ1 orientations correspond to the mean orientation of set I and II fractures when unfolded. As a result, it is likely that these fracture sets formed in strike-slip stress regimes, which justifies their use as indicators of palaeo-compressional trends (i.e. palaeo-σ1 axes).
One of the compressional trends is oriented NE–SW on average and is marked by reverse and strike-slip faults in addition to set II fractures. The other compressional trend is oriented N–S to N020° and can be unambiguously distinguished from the previous NE–SW compression (Figs 4, 7, 9) in many sites. It is, however, sometimes difficult to clearly attribute a local compressional trend to either the NE–SW or the N020° compression on the basis of the directional consistency only. This criterion of directional consistency is in most cases reliable, but may fail when a single compressional trend is recognized and when this trend is intermediate between NE–SW (even ENE–WSW) and N020°. In addition, as mentioned previously, fold trends evolve progressively from NW–SE to E–W from the western to the eastern part of the area investigated. Consequently, attributing a local compressional trend to the NE–SW or the N020° regime may be in some cases ambiguous.
In domain I, set I pre-dates sets II and III, and set II pre-dates set III. From interpreting these sets in terms of sub-horizontal palaeo-σ1 trends, it is seen that the N020° compression pre-dated the NE compression, both prevailing before the onset of folding. Previous palaeostress analyses in the same area allow refinement of this succession. In the northern limb of Sim anticline, carbonate matrix from the Mishan limestones was sampled to carry out calcite twin analysis (Lacombe et al. Reference Lacombe, Amrouch, Mouthereau and Dissez2007). One sample reveals a post-folding strike-slip stress regime with σ1 axis oriented N–S compression and a post-folding N–S extension. A second sample yields a N010° post-folding compression and an enigmatic E–W compression; the third one reveals a post-folding strike-slip stress regime with σ1 axis oriented N170° and a nearly WNW–ESE sub-perpendicular extension. Sites located north of the Sim anticline in the Mishan Fm reveal a post-folding N–S compression and a post-folding strike-slip stress regime related to a N160° compressional trend (Lacombe et al. Reference Lacombe, Amrouch, Mouthereau and Dissez2007) (Fig. 4). In Meymand, one vein likely belonging to set III is abutting against a smaller set I vein. Stress tensor calculations from its calcite filling reveal superimposed stress regimes. One corresponds to a reverse stress regime with a sub-horizontal σ1 axis oriented N–S (parallel to the set I vein) and a highly plunging σ3 axis. The second stress tensor displays a σ1 axis tilted consistently but less than the bedding dip, suggesting a syn-folding stress regime with σ1 oriented parallel to set II fractures. The compressional tensor reflects a late stage fold tightening without any detectable reopening of the set I vein. These results suggest that the N–S to N020° compressional trend prevailed first, followed by NE compression that prevailed during folding. The late to post-folding compressional trend indicated by fault-slip and calcite twin data is roughly parallel to the present-day stress field, N–S to N020°.
In domain II, the chronology between successive compressional trends is different since set II pre-dates sets I and III; set I pre-dates set III. From interpreting these sets in terms of sub-horizontal palaeo-σ1 trends, it is seen that the NE compression pre-dated the N020° compression, both prevailing before the onset of folding. As in domain I, previous palaeostress analyses in the same area allow refinement of this succession. In Takhteh, a vein oriented N030–85°E from the southern limb of the fold (Gurpi Fm) was measured for calcite twin analysis (Lacombe et al. Reference Lacombe, Amrouch, Mouthereau and Dissez2007). The computed σ1 axis is sub-horizontal and oriented N024°, the σ3 axis is highly plunging and the Φ ratio is low, indicating a reverse/strike-slip stress regime (Lacombe et al. Reference Lacombe, Amrouch, Mouthereau and Dissez2007). This tensor has been interpreted as post-folding by these authors, but uncertainties remain on the actual chronology with respect to folding owing to the low bedding dip (10°). As in domain I, fault-slip analysis reveals that the late to post-folding regime also corresponds to a N–S to N020° compression. These results suggest that the NE compressional trend prevailed first, followed by the N–S to N020° compression. A late to post-folding compressional trend revealed by striated microfaults and twinned calcite is roughly parallel to the present-day stress field, N–S to N020° compression.
In domain III, set I pre-dates sets II and III, and set II pre-dates set III. In Zalemi, the bedding dip is not steep enough to prevent uncertainties on the pre-tilting initial attitude of set I and set II fractures. However, they can be unambiguously identified as having prevailed mainly before folding since against them abuts a third set trending N110° (site 22) to N140° (site 23) which is also bed-perpendicular and strikes parallel to the fold axis, and which is therefore likely syn-folding. From interpreting these sets in terms of sub-horizontal palaeo-σ1 trends, it is seen that N020° compression pre-dated NE compression, both prevailing before the onset of folding. The N–S to N020° compression is either pre-folding (consistent with formation of set I fractures) or post-folding (reactivation of some fractures of set II as left-lateral strike-slip faults after folding).
Additional fault-slip data previously collected in the western part of the Asaluyeh anticline by Lacombe et al. (Reference Lacombe, Mouthereau, Kargar and Meyer2006) have been reported in order to give a general overview of the fold (Fig. 9). They consist of reverse and strike-slip fault systems associated with NE–SW (even ENE–WSW) and/or N–S to N020° compressional trends. The chronology relative to folding is, however, unclear: a NE to ENE compressional trend sometimes pre-dates folding (site ASA8) and sometimes is syn- to post-folding (sites ASA2, ASA3 and ASA 5). The N–S to N020° compression is mainly post-folding (sites ASA1, ASA5, ASA7), but early folding in site ASA8 (Fig. 9). These results suggest that the N–S to N020° compressional trend prevailed first, followed by NE compression that prevailed before and during folding. The late to post-folding compressional trend is roughly parallel to the present-day stress field, N–S to N020°. Fault and fracture populations formed under the NE–SW and the N020° compressions have been recognized in the different formations (Gurpi, Jahrom, Asmari, Mishan) analysed regardless of their age, suggesting that they are younger than the youngest faulted/fractured rocks (i.e. Middle Miocene Mishan Fm), except the Bakhtyari Fm where only the N020° compressional trend was identified.
Interestingly, most information about the pre-tilting stress regimes comes from fracture analysis. In that sense, they are comparable to AMS data (Aubourg et al. Reference Aubourg, Smith, Eshrahi, Lacombe, Authemayou, Amrouch, Bellier, Mouthereau, Leturmy and Robin2010). Although they have a well-known potential to also reliably record LPS (e.g. Lacombe et al. Reference Lacombe, Angelier, Rocher, Bergues, Chu, Deffontaines and Hu1996; Lacombe, Reference Lacombe2001; Amrouch et al. Reference Amrouch, Lacombe, Bellahsen, Daniel and Callot2010a), striated microfaults and calcite twins here preferentially recorded post-tilting stress regimes. This conclusion has already been drawn by Lacombe et al. (Reference Lacombe, Mouthereau, Kargar and Meyer2006, Reference Lacombe, Amrouch, Mouthereau and Dissez2007) who identified mainly post-folding stress regimes from fault-slip and calcite twin data in the Zagros cover.
Our results therefore show that NE–SW and N020° compressions succeeded or alternated during the Neogene in a different way depending on the structural domain considered, but remained generally pre-/early folding. Only the N–S to N020° compression was identified in the most recent formations, the Bakhtyari conglomerates, supporting that it corresponds to the most recent compressional trend. This trend additionally prevailed as a post-tilting regime and still prevails at the present day (Lacombe et al. Reference Lacombe, Mouthereau, Kargar and Meyer2006); it is consistent with dextral motions along Quaternary N–S-trending faults in the Zagros (e.g. Bachmanov et al. Reference Bachmanov, Trifonov, Hessami, Kozhurin, Ivanova, Rogozhin, Hademi and Jamali2004) and with the N020–030° present-day compressional trend deduced from seismicity (Lacombe et al. Reference Lacombe, Mouthereau, Kargar and Meyer2006).
Over the studied area, compressional trends were derived from mixed sets of reverse and strike-slip faults, without clear regionalization of the two. The close association of both faulting regimes in the cover during late Cenozoic times is similar to the association of mixed reverse and strike-slip type focal mechanisms of microearthquakes (Tatar, Hatzfeld & Ghafori-Ashtiany, Reference Tatar, Hatzfeld and Ghafori-Ashtiany2004). Inversion of fault-slip data and focal mechanisms of small to moderate earthquakes reveals low Φ ratios (sometimes close to 0), allowing both regimes to exist coevally (Lacombe et al. Reference Lacombe, Mouthereau, Kargar and Meyer2006). In addition, normal faults are found in some sites associated with the reverse or the strike-slip faults; except for those reflecting outer rim extension at the fold hinge, these normal faults indicate a component of coeval perpendicular extension, for both the NE–SW and the N020° compression (Lacombe et al. Reference Lacombe, Mouthereau, Kargar and Meyer2006). This suggests that one principal stress remained always horizontal and oriented NE–SW or N020°, but that σ2/σ3 permutations allow for the coexistence of compressional and strike-slip regimes and that σ1/σ2 permutations allow for the development of (a few) normal faults accommodating belt-parallel extension. This explains why for a given compressional trend (NE–SW or N020°), reverse, strike-slip and normal faults, as well as subvertical joint/vein sets are observed in the field.
6.c. Interpretation of the different compressional trends in the light of basement faulting
In terms of orientations, the NE and N020° compressional trends identified in this work are consistent with palaeostress/strain trends previously reconstructed in the Fars using AMS data (Bakhtari et al. Reference Bakhtari, Frizon De Lamotte, Aubourg and Hassanzadeh1998; Aubourg et al. Reference Aubourg, Smith, Eshrahi, Lacombe, Authemayou, Amrouch, Bellier, Mouthereau, Leturmy and Robin2010), fault-slip data (Authemayou et al. Reference Authemayou, Chardon, Bellier, Malekzadeh, Shabanian and Abbassi2006; Lacombe et al. Reference Lacombe, Mouthereau, Kargar and Meyer2006) and calcite twin data (Lacombe et al. Reference Lacombe, Amrouch, Mouthereau and Dissez2007) (Fig. 3). However, our results show that the chronology of these two compressional trends may vary according to the structural domain considered (Fig. 2a). In addition, because the NE and N020° trends were identified in nearly all formations depending on the domain considered (except in the Bakhtyari Fm), and because of new dating of synorogenic deposits (Khadivi et al. Reference Khadivi, Mouthereau, Larasoana, Verges, Lacombe, Khademi, Beamud, Melinte-Dobrinescu and Suc2010), the scenario and the timing proposed by Aubourg et al. (Reference Aubourg, Smith, Eshrahi, Lacombe, Authemayou, Amrouch, Bellier, Mouthereau, Leturmy and Robin2010) require refinement.
The successive compressional trends during the Neogene in the western Fars have been tentatively interpreted through different competing models. In the model invoking block rotations (Bakhtari et al. Reference Bakhtari, Frizon De Lamotte, Aubourg and Hassanzadeh1998; Lacombe et al. Reference Lacombe, Mouthereau, Kargar and Meyer2006), the apparent change of the compressional trend from NE–SW to N020° through time is related to progressive vertical-axis clockwise rotations of cover blocks in relation to right-lateral wrench deformation accommodated by the Kazerun–Karebass–Sabz-Pushan fault system. These rotations are consistent with the clockwise rotations suggested by AMS studies to explain the systematic anticlockwise obliquity between the pre-folding magnetic lineation and the fold axes (e.g. Bakhtari et al. Reference Bakhtari, Frizon De Lamotte, Aubourg and Hassanzadeh1998). Unfortunately, available palaeomagnetic data show local inconsistent clockwise and anticlockwise rotations and are therefore currently unable to unambiguously support this model (Aubourg et al. Reference Aubourg, Smith, Bakhtari, Guya and Eshraghi2008). In this scenario, the compression/shortening direction remained more or less N020° from Middle–Late Miocene time to the present day in this part of the Zagros.
Alternatively, a regional anticlockwise rotation of the regional stress field during the Neogene has also been invoked (Aubourg et al. Reference Aubourg, Smith, Eshrahi, Lacombe, Authemayou, Amrouch, Bellier, Mouthereau, Leturmy and Robin2010). AMS data from Paleocene carbonates in the Simply Folded Belt record a N047° LPS during Early to Middle Miocene time, while Middle to Upper Miocene clastic deposits recorded a N038° LPS prior to and during folding within the Simply Folded Belt at the end of Miocene time. The Plio-Quaternary palaeostress trends are, however, consistently parallel to the present-day N020° shortening direction.
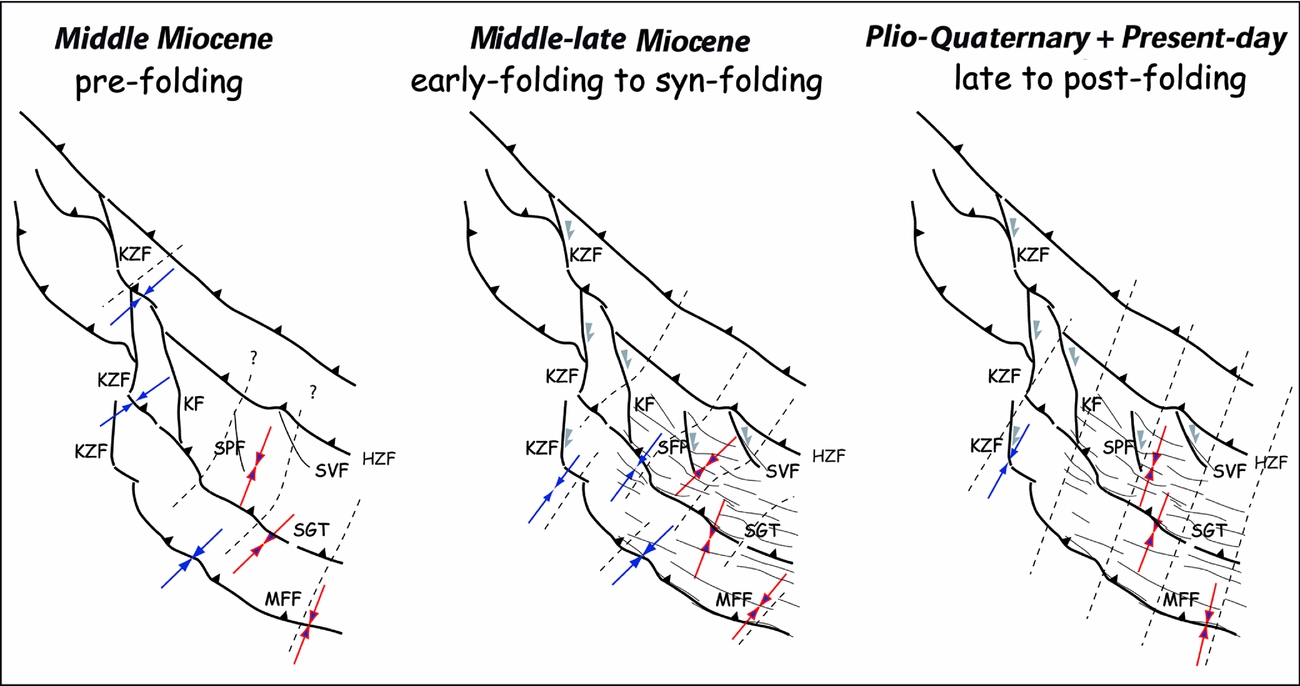
In the absence of any block rotation or regional stress rotation, the early (pre-folding) local palaeostress trends which deviate from the N020° trend can be tentatively related to perturbations induced by underlying basement faults. We propose a three-step scenario (Fig. 11), in which the N020° compression corresponds to the regional compression that likely prevailed throughout the whole Neogene tectonic history of the Fars. The NE compression is due to a perturbation of the N020° regional compression due to the inherited basement fault network, i.e. the pattern of N–S transcurrent faults of the western Fars (Karebass, Sarvestan, Sabz-Pushan faults) and the NW–SE basement faults (Surmeh–Ghir Thrust, Main Frontal Fault), depending on the domain considered and the degree of coupling between cover and basement above basement faults through the Hormuz salt layer.
(Colour online) Palaeostress trends related to the main steps of tectonic evolution in the Zagros Simply Folded Belt during the Neogene. KZF – Kazerun Fault; KF – Karebass Fault; HZF – High Zagros Fault; MFF – Mountain Front Fault; SGT – Surmeh–Ghir Thrust; SPF – Sabz-Pushan Fault; SVF – Sarvestan Fault. Solid blue arrows – previous works (Authemayou et al. Reference Authemayou, Chardon, Bellier, Malekzadeh, Shabanian and Abbassi2006; Lacombe et al. Reference Lacombe, Mouthereau, Kargar and Meyer2006, Reference Lacombe, Amrouch, Mouthereau and Dissez2007; Aubourg et al. Reference Aubourg, Smith, Eshrahi, Lacombe, Authemayou, Amrouch, Bellier, Mouthereau, Leturmy and Robin2010); outlined red arrows – this work. Modified after Aubourg et al. (Reference Aubourg, Smith, Eshrahi, Lacombe, Authemayou, Amrouch, Bellier, Mouthereau, Leturmy and Robin2010).

In step A, basement and cover are coupled above NW–SE basement thrusts, and stresses in the cover are reoriented from the N020° regional trend to a NE direction nearly perpendicular to the NW–SE basement fault trend in domain II and the western end of domain III (Fig. 11). In contrast to the Kazerun fault zone, second-order faults like the Sabz-Pushan and Sarvestan faults have yet no structural expression, so local compressional trends are not perturbed and remain oriented N020° in domain I.
At the onset of, and during, folding (step B), the Sabz-Pushan and Sarvestan transfer faults superimposed onto long-lived (basement) N–S features and started to develop in the cover, causing local reorientation of the regional stress field into a local NE trend in domain I. This NE compressional trend, oblique at a high angle to the transfer faults, is in good agreement with the development of nearby N150°-trending folds parallel to these fault zones (e.g. the Qazi anticline parallel to the Sarvestan fault, Fig. 2a), suggesting a noticeable amount of fault-perpendicular shortening. The degree of coupling between cover and basement likely decreased during the main stage of folding above NW–SE basement faults, so in the cover of domain II the local shortening trends consistently with the regional N020° trend.
In step C, while the main stage of folding has ceased, the N–S to N020° compressional trend prevails. This post-folding trend is consistent with right-lateral wrench movements along Kazerun–Karebass–Sarvestan strike-slip faults cutting, dragging and offsetting previously formed folds. This especially means that the Sabz-Pushan fault zone did not behave as a simple strike-slip fault cutting through and offsetting previously formed folds (Berberian, Reference Berberian1995), but acted first (step B) as a primary tear fault accommodating local kinematic incompatibilities in the cover, as emphasized by Lacombe et al. (Reference Lacombe, Mouthereau, Kargar and Meyer2006). The change from tear faulting to strike-slip faulting may have been coeval with the change in the compressional trend from NE–SW to post-folding N–S to N020° that prevailed during the Plio-Quaternary until the present (step C). Like for NW–SE basement faults, coupling across this N–S fault zone (and neighbouring ones), marked by the amount of fault-perpendicular shortening, has evolved and decreased with time when this fault evolved to a true strike-slip fault. Note, however, that cover–basement coupling may remain efficient during major earthquakes despite the Hormuz salt layer, with major faults cutting through the whole sedimentary cover up to the surface (e.g. Oveisi et al. Reference Oveisi, Lave, Van Der Beek, Carcaillet, Benedetti and Aubourg2009). This study thus argues in favour of coeval thin- and thick-skinned deformation styles of the Fars during the Neogene as proposed by Mouthereau, Lacombe & Meyer (Reference Mouthereau, Lacombe and Meyer2006) and Mouthereau et al. (Reference Mouthereau, Tensi, Bellahsen, Lacombe, De Boisgrollier and Kargar2007b), with a variable degree of coupling of basement and sedimentary cover through time above the basement faults.
7. Conclusions
Fracture analyses in folded strata within the Zagros Simply Folded Belt in the Fars provide information on the stress orientations associated with stress build-up in the sedimentary cover before the onset of folding. We distinguished mainly different sets of pre-/early folding fractures and some syn-folding fractures. Pre-/early folding joints can be studied regionally and indicate the strike of early compression consistent with fault-slip analysis (although most striated microfaults and calcite twins rather constrain post-folding stress regimes), thus allowing us to refine the succession of the Neogene stress fields.
In many places (Sim and Meymand especially, close to N–S strike-slip faults), a N–S to N020° compression pre-dates the NE compression previously recognized as the first one by Lacombe et al. (Reference Lacombe, Mouthereau, Kargar and Meyer2006). However, near the NW–SE basement thrust faults (e.g. Surmeh–Ghir Thrust), the NE compression pre-dates the N020° one. Rather than invoking an anticlockwise rotation of the regional stress field or local clockwise block rotations close to right-lateral strike-slip faults, we propose that the N020° trend reflects the regional far-field collisional stress (that remained likely unchanged throughout the whole Neogene tectonic history of the Fars folded belt), and that the NE compression is likely due to stress perturbations of the N020° trend by N–S and/or NW–SE basement faults; these stress perturbations reflect the evolving degree of coupling between the basement and the cover.
Basement structures and early basement block movements may therefore have an impact on fracture development in the overlying cover rocks. Apparently, the occurrence of some local compressional trends and related fracture sets was partly controlled by underlying deep-seated basement faults in the Zagros region. The transmission of orogenic stress through the faulted crystalline basement of the Zagros was probably heterogeneous and complex; deformation propagated in an irregular fashion through the basement and the cover leading to local stress perturbations, hence to a complex directional distribution and chronology of fractures in the cover. Such a complexity should be taken into account in further studies of folded and fractured reservoirs.
Acknowledgements
The authors would like to thank S. Tavani and R. Hinsch for their valuable comments that allowed improvements of the earlier version of the manuscript.