


In modern democracies, new policies are frequently introduced, but not all are significant in social and economic terms. Identifying and classifying important policy outputs has long been of major interest to political science. Much research relies on measures of policy significance. Evaluations of policy outputs are, in particular, crucial for empirical investigations into how “reform productivity” is shaped by divided government (Mayhew Reference Mayhew1991), veto players (Angelova et al. Reference Angelova, Hanna, Wolfgang C. and Daniel2018; Conley and Bekafigo Reference Conley and Bekafigo2010; Tsebelis Reference Tsebelis1999) and agenda control (Becher Reference Becher2010; Döring Reference Döring2001). Various ratings of policy outputs have also underpinned research examining how political conflict and uncertainty shape the autonomy and discretion of bureaucratic actors (Huber and Shipan Reference Huber and Shipan2002; Junge, Koenig, and Luig Reference Junge, Koenig and Luig2015).
The conventional approach to measuring policy significance relies on evaluations by media reporters and policy scholars. Experts observe the policy environment and classify new outputs into those that are sufficiently notable and those that fall below some threshold of significance (Angelova et al. Reference Angelova, Hanna, Wolfgang C. and Daniel2018; Conley and Bekafigo Reference Conley and Bekafigo2010; Mayhew Reference Mayhew1991; Tsebelis Reference Tsebelis1999). Once obtained, individual expert rankings are combined into binary, categorical, or continuous scores using some aggregation method (Howell et al. Reference Howell, Scott, Charles and Charles2000). Clinton and Lapinski (Reference Clinton and Lapinski2006) provide the most rigorous such aggregation method, using item-response theory to extract latent policy significance from expert scores.
In this work, we offer a proof of concept for a novel measurement approach. Instead of collecting and aggregating expert evaluations for a finite set of policy outputs, we propose to (i) use experts to identify a (relatively) small set of significant outputs and then to (ii) search for sufficiently similar examples in a large unlabeled set. We further propose to automate the first step by harvesting “seed” sets of significant outputs from web data and to implement the second step by applying advances in computational semisupervised learning. We offer an application of the new approach by classifying a specific type of policy output—over 9,000 government regulations in the United Kingdom. We evaluate our classification by examining correspondence with human expert ratings, forecasting web citations of significant regulations, and testing the general construct validity of our significance estimates.
Our approach has important advantages. It is less time consuming and labor intensive than conventional methods. By harvesting seed sets from the web, we are able to choose experts who evaluate outputs from a distinct perspective and to control the temporal dimension of such evaluations through date-restricted searches. In our application, we search for contemporaneous citations by leading law firms, a rater group that gives particular emphasis to policies that change the status quo by a large margin. Using positive unlabeled (PU) learning, we train a computational model that achieves a true positive rate of 85% when predicting future web content, correctly classifies 70% of hand-coded expert ratings, and produces estimates with high construct validity. Our method is not without its limitations. As with any automated method, a trade-off exists between labeling expense and prediction accuracy, and our approach achieves moderate success in classifying more nuanced cases.
A New Approach
Modeling Positive Examples
The approach we propose starts from a set of examples of significant policy outputs identified by a group of domain experts. We assume that the probability of a domain expert (rater)
 $ j $
identifying some output
 $ i $
as significant (
 $ {y}_{ij}=1 $
) is a sigmoid function of
 $ {a}_j\left({\theta}_i-{b}_j\right) $
, where
 $ {\theta}_i $
is the latent significance of output
 $ i $
,
 $ {a}_j $
is the discrimination of rater
 $ j $
, and
 $ {b}_j $
is the threshold of rater
 $ j $
beyond which she rates a policy output as significant (equation 1). We assume that
 $ \theta $
denotes the true significance of a policy output, and if it were observable, all raters would agree on the ranking of outputs, even though they apply different thresholds and discrimination rates. Raters are also assumed to share a common understanding of what determines significance (cf. Clinton and Lapinski Reference Clinton and Lapinski2006, 238; Howell et al. Reference Howell, Scott, Charles and Charles2000, 303–304).Footnote
1
 $$ \Pr \left({y}_{ij}=1|{\theta}_i,{a}_j,{b}_j\right)=\frac{e^{a_j\left({\theta}_i-{b}_j\right)}}{e^{a_j\left({\theta}_i-{b}_j\right)}+1} $$
Suppose now that we obtain a set of outputs that we know rater
 $ j $
considers significant. Suppose further that we obtain
 $ k $
such sets from different experts in a given domain. Taking the probability of 0.5 as a decision boundary for inclusion in individual raters’ sets of significant examples, the resulting set
 $ P $
of such outputs can be viewed as containing significant policy outputs in two respects. First, because
 $ {a}_j $
, the rater discrimination can be assumed to be always positive, we know that
 $ {\theta}_i>{b}_j $
must be true for at least one rater
 $ j $
. In simple terms, the obtained set
 $ P $
is a set of significant outputs in the sense that the latent significance of each output in
 $ P $
is higher than the threshold of at least one rater.
Second, if at least some outputs in the set
 $ P $
are considered significant by two or more raters, we can make further inferences about
 $ \theta $
for subsets of
 $ P $
based on parameter
 $ n $
, where
 $ n\in \Big\{1,\dots, k $
} is the minimum number of raters who have rated a given output
 $ i $
as significant. More specifically, by selecting different values of
 $ n $
, we can vary the lower bound on the significance of outputs in terms of rater thresholds. Assuming rater thresholds such that
 $ B=\left\{{b}_1,{b}_2,\dots, {b}_k\right\} $
for
 $ k $
raters and assuming that
 $ {b}_1\le {b}_2\le \cdots \le {b}_k $
, we know that
 $ {\theta}_i>{b}_1,\dots, {b}_n $
for every output
 $ i $
in the subset
 $ {P}_n\subset P $
. In conclusion, as one increases
 $ n $
and takes corresponding subsets
 $ {P}_n $
, one obtains sets of policy outputs that can be considered to be of higher significance in terms of relative rater thresholds.Footnote
2
Harvesting Positives from Web Data
Examples of significant policy outputs can be obtained by directly surveying a group of domain experts (Warber, Ouyang, and Waterman Reference Warber, Ouyang and Waterman2018). In our work, we propose to obtain such examples using web citations. This approach has important advantages. First, a few billion internet users worldwide upload millions of posts every day on a myriad of issues including public policies. By posting content online, users convey an evaluation of what policy outputs they consider significant. These assessments are readily available and require little cost to obtain. Importantly, many web content contributors (e.g., banks, market analysts, law firms, business associations) can be regarded as specialized domain experts, and research can take advantage of their propensity to freely share professional opinions.
Second, by harvesting citations of policy outputs from the web, we can formulate more specific assumptions about the primary concept of significance used by our domain experts. Previous work tends to define significance of policy outputs in terms of general “notability” in the eyes of elite evaluators (Clinton and Lapinski Reference Clinton and Lapinski2006). With our approach, we can draw on the copious research on online journalism and web content marketing (see e.g., Schultz, Doerr, and Frederiksen Reference Schultz, Doerr and Frederiksen2013) to make better informed assumptions about why a specific category of experts may judge some policy outputs significant enough to cite them online.Footnote 3 Our approach thus allows us to choose expert raters who can be assumed to use a distinct concept of significance.Footnote 4
Last but not least, by searching for citations made on the web, we are able to control the temporal dimension of significance. When asked to recall significant examples, human experts are often found to apply unequal weighting across time (Epstein and Segal Reference Epstein and Segal2000). Some experts prioritize the more recent over more distant past. Others recall policy outputs that are significant from a longer-term perspective. With our web-based approach, we are able to minimize such recall bias by performing date-restricted searches and querying only the content posted within a specific time window. This allows us to focus on contemporaneous evaluations that assess significance of a policy output around the time of its enactment.
Learning from Positive and Unlabeled Examples
Our starting point is thus a set
 $ P $
of policy outputs that have been mentioned in the web content posted by online expert raters and that we consider to be significant in the sense discussed above. The second step in our approach is to find other policy outputs that are sufficiently similar to our significant examples, starting from the seed set of positives,
 $ P $
.
Multiple classification methods exist for learning from positive and unlabeled data including two-step methods, biased two-class classifiers, statistical queries, and one-class classifiers (Zhang and Zuo Reference Zhang and Zuo2008). In this work, we introduce an established two-step Rocchio-SVM method proposed by Li and Liu (Reference Li and Liu2003) and Liu (Reference Liu2011), which is widely used in web data mining.Footnote 5 We extend and adjust this method for our purposes by (i) incorporating both categorical and textual features, (ii) running multiple models with varying train-validation splits, and (iii) constructing bootstrap confidence intervals for model predictions (see Appendix A).
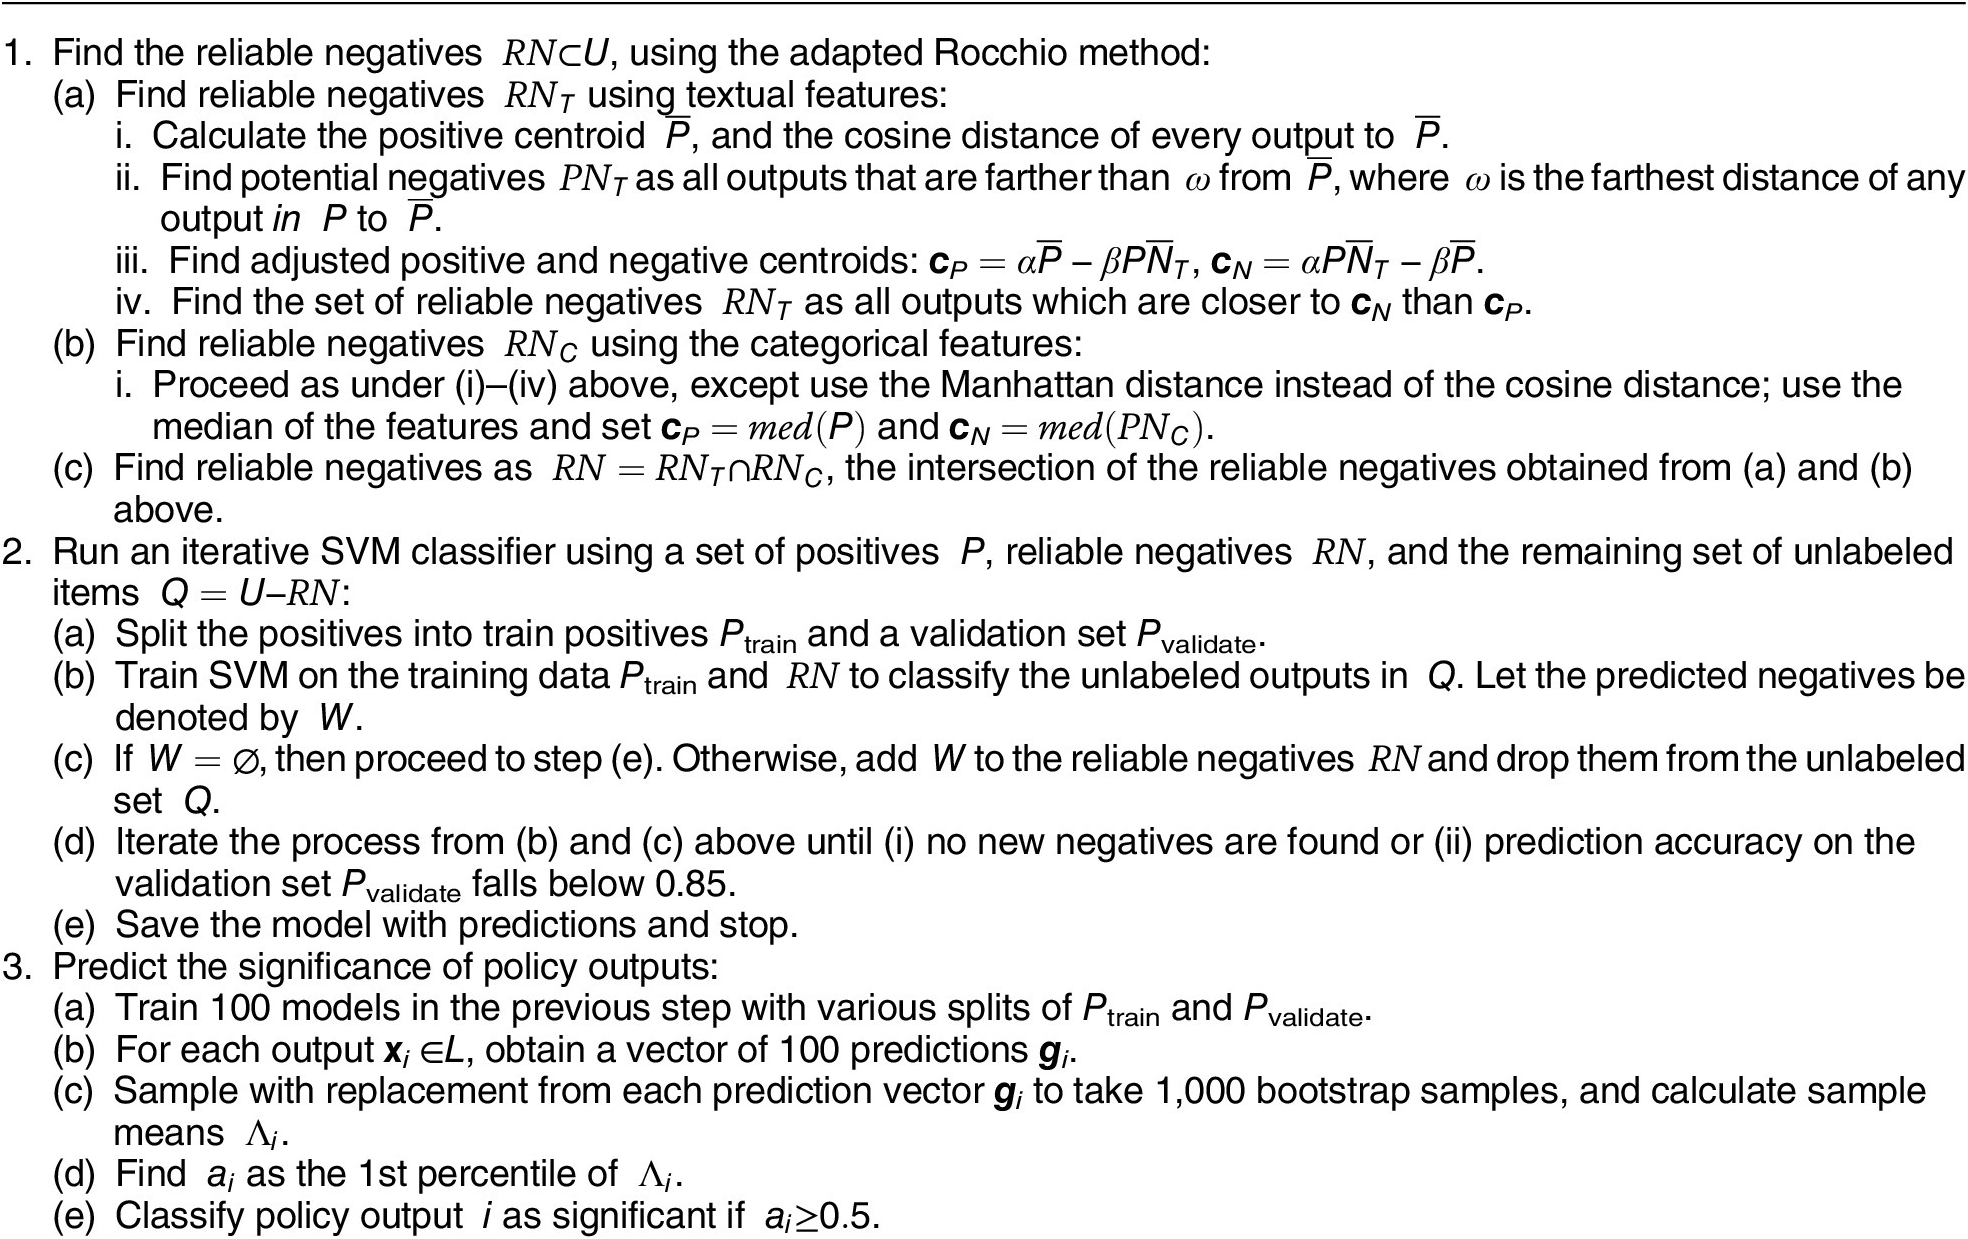
Our algorithm has three overall steps (see Table 1). We start with a set of policy outputs
 $ L=P\cup U $
, where
 $ P $
is the set of positives and
 $ U $
is the unlabeled set. The first step is the detection of reliable negatives
 $ RN\subset U $
—that is, policy outputs that can reliably be classified as not significant. Two sets of reliable negatives
 $ {RN}_T $
and
 $ {RN}_C $
are found using textual and categorical features, respectively. Having found
 $ {RN}_T $
and
 $ {RN}_C $
, we propose to obtain the final set of reliable negatives as
 $ RN={RN}_T\cap {RN}_C $
—that is, the intersection of the reliable negatives obtained from using the Rocchio method on the textual and categorical features.
The PU Learning and Prediction Algorithm

In the second step, the algorithm runs a support vector machine (SVM) classifier iteratively using positives
 $ P $
, reliable negatives
 $ RN $
and the remaining set of unlabeled items,
 $ Q=U- RN $
(Liu Reference Liu2011, 195-7).Footnote
6 In each iteration, a new classifier is trained using
 $ P $
and
 $ RN $
, which is then used to predict labels for all outputs in
 $ Q $
. The outputs that are classified as negative,
 $ W $
, are dropped from
 $ Q $
and are added to
 $ RN $
. The iterated SVM method proceeds by augmenting the
 $ RN $
at each iteration until no items in
 $ Q $
are classified as negative or the prediction accuracy on a validation set drops below 85% (Liu Reference Liu2011).
The final step is prediction. To ensure that a particular choice of train-validation split for positives does not bias prediction, we extend the Rocchio-SVM method and run 100 models with different train-validation splits and obtain the mean prediction as a proportion of the 100 models that predicted a policy output as significant. We estimate the uncertainty of this mean using the bootstrap method. We consider output
 $ i $
as significant if the lower-bound of a one-sided 99% percentile bootstrap confidence interval is greater or equal to 0.5.
Application
UK Secondary Laws
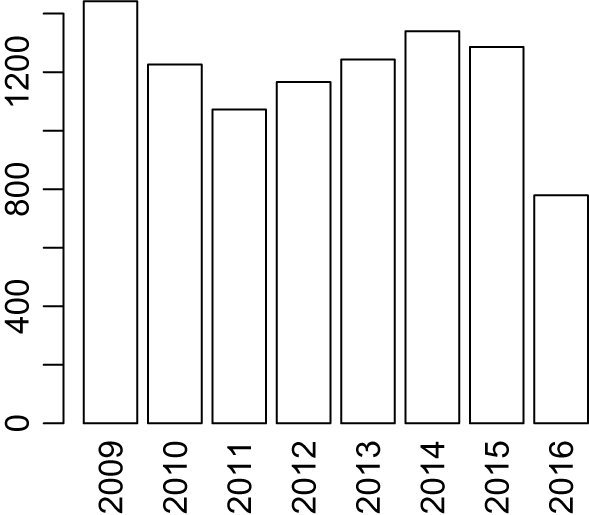
We offer an application of our proposed approach by measuring the significance of secondary legislation in the United Kingdom (UK). Most legislative action in the UK occurs through secondary, rather than primary, legislation (Page Reference Page2001). Primary laws contain only a broad regulatory framework, while secondary laws provide details that are too complex to include in primary legislation. The principal form of UK secondary law—and the one that we study in this work—is known as the statutory instrument (SI). Figure 1 shows the distribution of SIs by year between 2009 and 2016. A large number of SIs regulate matters in the fields of education, social security, health, income tax, and pensions.Footnote 7 The question we address in this application is simple: which SIs are significant?
Number of SIs by Year

Law Firms as Raters
In this application, we source examples of significant laws from the web pages of law firms. Besides providing a means to introduce attorneys and services, websites offer an attractive platform for law firms to demonstrate expertise within their practice areas. Such “content marketing” takes the form of client alerts, practice-group newsletters, and industry-specific blogs, targeted at current and prospective clients. Regulatory updates drawing attention to major changes in legislation are a key part of these marketing activities (Greentarget 2017).
To understand why law firms may determine some laws significant, we review the literature on web content marketing for the legal profession. While it is not possible to identify why law firms write about legislation in all cases, we find a consensus that spans general observations on the current state of the art in legal content marketing, recommendations from professional legal bodies, and observations from those working in law firms. Our review indicates that lawyers post content online mainly about laws that change the regulatory status quo by a large margin (see Appendix C). Our set
 $ P $
can thus be expected to contain UK statutory instruments that are significant in this sense.Footnote
8
To ensure that we select law firms that have the resources and expertise to engage in professional content marketing, we focus on the web pages of top-ranked, leading UK law firms only. By focusing on leading law firms, we also have the benefit of choosing well-informed, highly specialist experts, as top firms retain the best legal professionals with a broad and deep understanding of the regulatory environment. In this study, we select 288 top-ranked, leading UK-based law firms drawing on two of the largest reputable rankings of the legal profession: Chambers & Partners and The Legal 500 (Appendix D).
Web Search
The 288 firms in our selection are associated with 317 websites. Each law firm is associated with at least one website. Based on this set of websites, we construct a custom search engine using the Google Custom Search facility.Footnote 9 As our goal is to retrieve content that is relevant to a specific law, we place a larger penalty on retrieving false positives than false negatives. Consequently, we use the full quoted title of a law as our query. We control the temporal dimension of law significance by performing date-restricted searches with the date on which a web page was created as an anchor. Our search queries the web content that law firms posted in the 6-month period preceding the law’s publication and in the 6-month period following its publication.
In August 2017, we searched for the quoted title of each of 9,838 SIs adopted between January 1, 2009 and December 31, 2016. Our search results are an SI-firm matrix, containing hit counts for each SI in each firm’s website. As we are not interested in the exact hit counts within each firm’s website, we binarize this matrix. To construct output set
 $ P $
, one must determine a threshold of web citations across firms above which one will consider a law significant (i.e., choose
 $ {P}_n $
—see previous section). In this application, we set
 $ n=2 $
, thus choosing all SIs for which we find relevant content on at least two firms’ websites.Footnote
10
Our output set
 $ {P}_2 $
has 271 laws. The set has high face validity as a sample of laws that can be considered significant in the eyes of law firms—that is, laws that change the regulatory status quo by a large margin. An inspection of the set
 $ {P}_2 $
reveals that, compared with the set
 $ U $
, the laws in
 $ {P}_2 $
, on average, contain longer texts, more often introduce new provisions, and have wider regional application. This pattern holds regardless of whether the set
 $ {P}_2 $
is obtained from the pages of firms that are small or large, regional or London-based, specialized or full-service (see Appendix E).
Model Training
To train the PU learning model, we first select features focusing on information that can be plausibly related to output significance. We use both real-valued textual and categorical features.Footnote 11 The former are obtained from the text of Explanatory Notes that are attached to each UK statutory instrument. We use bigrams as tokens, as they are more informative than unigrams.Footnote 12 Our categorical features include the major topic, denoting the subject matter into which an SI falls; the department (ministry) responsible for adopting it; a battery of features that capture the different categories of SIs; the location capturing an SI’s geographical coverage; the SI length; the feature laid-before-parliament, which denotes whether an SI was submitted for legislative scrutiny; and finally two features—memorandum and impact assessment—capturing documents that can accompany a statutory instrument.Footnote 13
We train our model using the PU learning algorithm from Table 1 using the positive set
 $ {P}_2 $
, which has 271 laws, and the set of all unlabeled laws adopted between 2009 and 2016.Footnote
14 In the first step, our algorithm finds reliable negatives. Our
 $ {RN}_T $
contains
 $ \mathrm{5,830} $
laws,
 $ {RN}_C $
contains
 $ \mathrm{2,272} $
laws, and the intersection RN has
 $ \mathrm{2,089} $
laws. The unlabeled set
 $ Q $
contains
 $ \mathrm{7,194} $
laws. In the second and third step, we train 100 iterated SVM models and for each law we obtain 100 predictions of the label. We then take 1,000 bootstrap samples of the set of predictions and find the 1st percentile of the distribution of the bootstrap means to determine significance. We consider any law for which this lower bound exceeds or is equal to 0.5 as significant.
In supervised learning with labeled positives and negatives, we can use standard methods of determining model fit such as accuracy or AUC. As we only have true positives in PU learning, we estimate model fit by the proportion of positives correctly predicted. We correctly predict 251 out of 271 positives, or with 92.6% accuracy, which shows our model does not underfit.Footnote
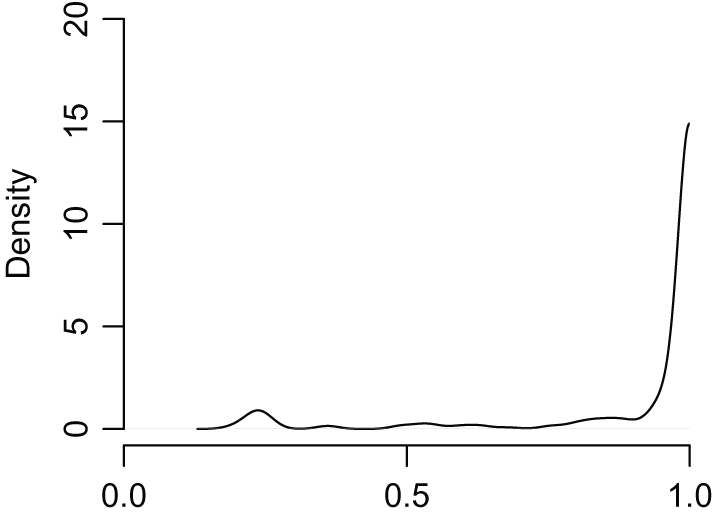
15 To understand how true positives are distributed according to confidence of prediction, we examine the density of the lower bound of the 99% confidence interval (
 $ {a}_i $
) that we use to determine significance. Figure 2 shows the density of the lower bounds
 $ a $
, demonstrating that our model is confident to a high degree for the large majority of positives.
Density of the Lower Bounds
 $ a $
.

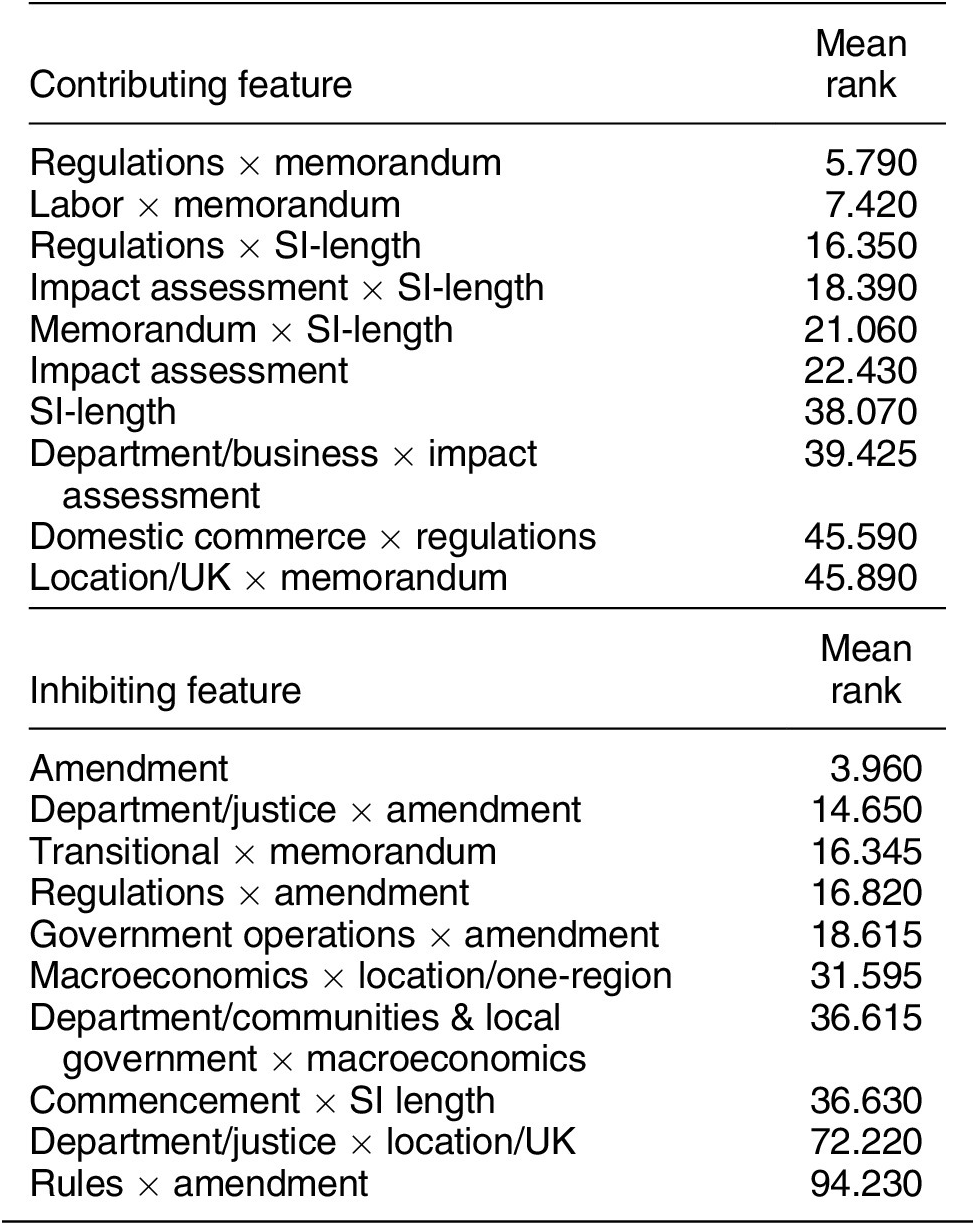
We can consider feature importances to understand the key predictors of significance.Footnote 16 The top predictive features, both contributory and inhibiting, are shown in Table 2, with × denoting an interaction. The list is dominated by nontextual features (see Appendix H for a discussion of text feature importances). The length of the SI is a major predictor, appearing in four out of the 10 top contributing features, as itself and in interaction with other features. Whether an SI is a regulation, has an impact assessment, or has a memorandum are also good predictors of significance. Major topics such as labor and domestic commerce are good predictors. The SIs with one or more of the above contributing factors present are thus more likely to be classified as significant.
Feature Importances

Evaluation
We evaluate our method in three ways, starting with two tests on unseen data of all UK statutory instruments adopted between January 1 and July 31, 2017, beyond the 2009–2016 period from which we obtained our training data. The third test probes the construct validity of our significance estimates through an analysis of the UK legislative cycle during 2005–2015.
Forecasting Citations
Our first evaluation offers a simple test. Is our PU learning model able to predict which SIs law firms will consider sufficiently important to mention on their websites? An answer in the positive would indicate that our model performs well in its domain and effectively forecasts citations of laws within web page content. More specifically, it would show that our model has good recall—that is, it correctly retrieves a high fraction of true positives.
To check this, we performed a new Google search in February 2018 to obtain web citations of SIs published in the first half of 2017. We found that out of the total of 409 SIs made in that period, 26 are cited on the websites of at least two law firms. Out of the 26, our model correctly predicts 22 positives (84.6%), misclassifying four SIs (Appendix J). While we obtain a high true positive rate, we do predict more positives than the actual number of positives, as our model classifies 155 (37.9%) of the 409 SIs as significant.Footnote
17 This is not necessarily a problem, as the new set
 $ {P}_2 $
obtained for 2017 is an incomplete set of significant outputs. To check whether we achieved a high recall just by chance, we calculate the probability of this happening and obtain a very low probability value (see Appendix K).
Comparison to Human Experts
For our second evaluation, we compare our classification results for 2017 with estimates derived from human experts. We obtain expert ratings for a sample of 217 of the 409 SIs from three legal professionals (Appendix I). Using the Qualtrics survey platform, we requested that each expert reads the full text of each law, before prompting them as follows: “Imagine that you are a lawyer working for a major UK law firm and you are tasked with selecting important pieces of legislation (Statutory Instruments) to write about for the firm’s clients. On a scale from 1 to 6, how important do you think this SI is to write about?”
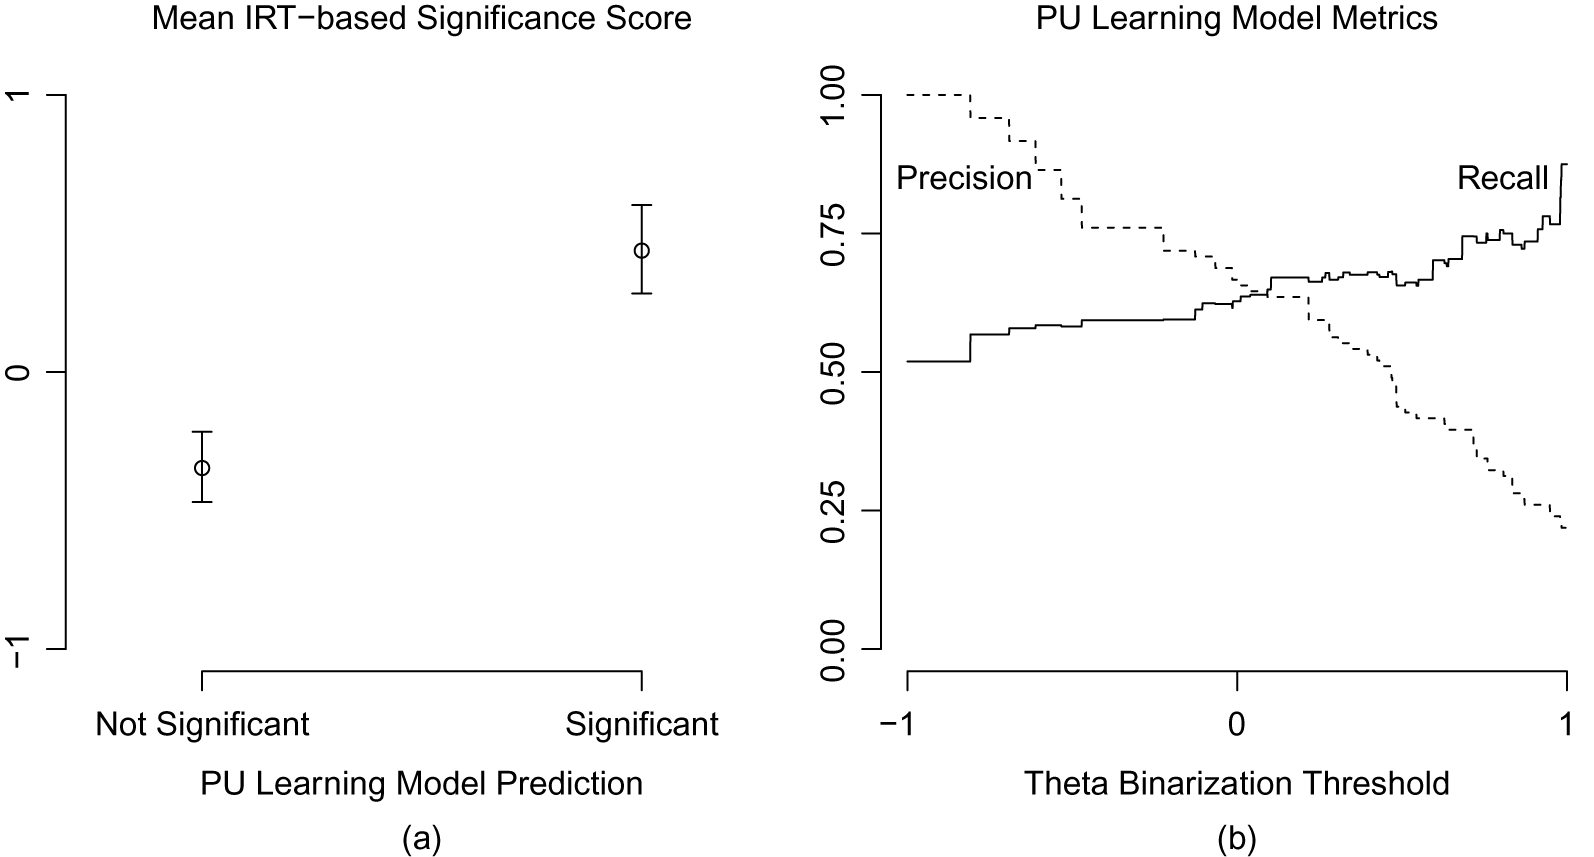
Based on our expert rankings, we estimated a graded-response IRT model to derive the theta values of latent significance (Clinton and Lipinski Reference Clinton and Lapinski2006).Footnote 18 For validation purposes, we consider these theta values as the true (continuous) estimates of SI significance. We first compare the mean theta values (with 95% bootstrap CIs) for SIs that our model predicts as not significant and significant. Figure 3(a) reports the results. As this figure shows, there is a strong correspondence between human experts and our classification. The mean theta-based significance score for the SIs predicted as not significant is -0.35, and that for the SIs predicted as significant stands at 0.44 (where the overall mean theta is 0.00).
Comparison with Human Experts

In the second step, we can consider the precision and recall of our PU learning model. To do so, we must binarize theta values, as IRT-based significance is measured on a continuous scale. Rather than choosing an arbitrary binarization threshold, we examine how precision and recall change as one varies the threshold from -1 to 1 on the theta scale. Figure 3(b) presents the results. This analysis reveals that our model has best accuracy when one binarizes on theta-based significance values between 0.103 and 0.216 (accuracy 0.70, recall 0.67, precision 0.64). In an error analysis we find that our model tends to misclassify more nuanced SIs, an issue it shares with other automated classification methods (see Appendix I for a discussion of the types of errors that our model makes compared with human experts).
Significant SIs and UK Legislative Cycle
The previous two evaluations show that our model fairly effectively replicates citations of legislation by leading UK law firms, both when tested with web data and with human expert ratings. For our final evaluation, we investigate whether our predicted labels accord with the general notion of significance as a major departure from the regulatory status quo. To probe this construct validity of our significance estimates, we examine how the share of the SIs we classify as significant varies over the annual legislative cycle.
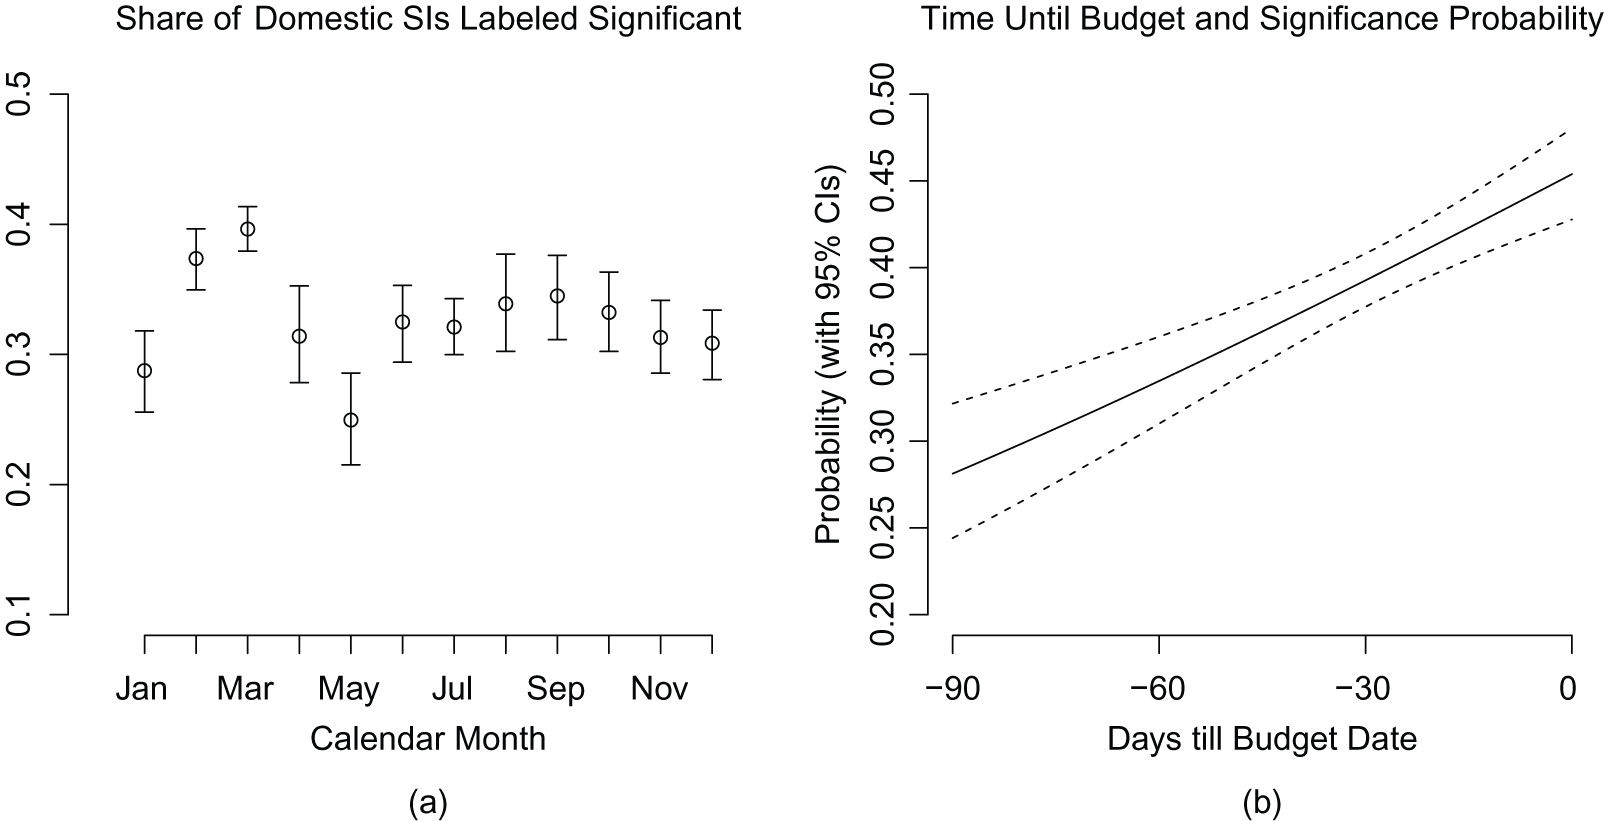
In the UK, a high number of statutory instruments are adopted over a few weeks before the budget is announced in late March of each year.Footnote 19 The constitution permits large parts of the budget to come into force almost immediately once announced, and hence secondary legislation must be ready to give substantive effect to many finance bill clauses (Seely Reference Seely2020). The budget is a major policy event and, if our classification has good construct validity, we expect that a relatively high share of statutory instruments passed in the weeks prior to the budget will be classified as significant. In fact, given the focal role that the budget plays in a domestic policy cycle, we would expect to find few other periods in any given year when the proportion of significant SIs matches that during the weeks leading to the budget.
This is exactly what we find. We classify all statutory instruments adopted under the Blair/Brown government (2005–2010) and the Cameron-Clegg coalition (2010–2015), limiting our analysis to domestic SIs that are influenced by the UK budgetary cycle.Footnote 20 Figure 4(a) shows how the monthly share of domestic SIs that our model predicts as significant varies over the calendar year. This analysis reveals a marked surge in the production of significant SIs in February and March, the 2 months before the budget. In a separate analysis, we use the number of days until the budget date (in the 0–90 range) as a predictor in a generalized linear model with a binomial distribution and a logit link, in which the dependent variable is the significance label obtained from our model. Figure 4(b) reports the results. As this figure demonstrates, the significance of SIs, as captured by our classification, increases strongly as one moves closer to the budget date. We believe this shows that our estimates have good construct validity.
Statutory Instruments and UK Budget Cycle

Conclusion
In this paper, we proposed a new method for measuring the significance of policy outputs, based on a semisupervised machine learning approach. We show that with this approach we can obtain estimates that fairly accurately accord with future web content and hand-coded expert ratings and also have more general construct validity. There is a trade-off to our method. Our web-based technique is efficient and automated, but it may struggle with some of the more nuanced cases, thereby lowering prediction accuracy. As ours is a proof-of-concept work, we leave the task of further improving model performance for future work. Our approach allows for interesting extensions. By performing searches on various subsets of web resources, researchers can train models using examples of significant outputs from expert raters who use distinct concepts of significance. We showcased the method using seed sets from professional services firms that focus chiefly on outputs shifting the status quo by a large margin. Future research may train models on examples obtained from raters who use other concepts of significance. Outputs that are consistently classified as significant across such models may be assumed to have general significance.
Supplementary Materials
To view supplementary material for this article, please visit http://dx.doi.org/10.1017/S000305542000091X.
Replication materials can be found on Dataverse at: https://doi.org/10.7910/DVN/1XXDMW.










Comments
No Comments have been published for this article.