Introduction
Wheat (Triticum aestivum L.) is one of the most widely cultivated cereal crops worldwide and plays a strategic role in human nutrition, food security, and economic stability (FAO, 2024). As a crop of critical agronomic importance, wheat is intensively produced in major agricultural regions such as Central Anatolia and Çukurova. However, its productivity is increasingly threatened by climate change, water scarcity, soil degradation, and biotic stress factors, particularly insect pests (He et al., Reference He, Zhao, Zheng, Desneux and Wu2012).
Among these, aphids – particularly the bird cherry-oat aphid, Rhopalosiphum padi (L.) pose a major risk due to their piercing–sucking feeding behaviour, which leads to substantial yield and quality losses (Peng et al., Reference Peng, Liu, Guo, Wang, Song, Su, Fang and Chen2020). The severity of damage varies with the crop growth stage, feeding site, and prevailing ecological conditions (Aqueel and Leather, Reference Aqueel and Leather2011). R. padi can damage wheat from seedling establishment through to grain maturation by feeding on the awns, culm, and upper leaves, ultimately reducing photosynthetic capacity, impairing spike development, and lowering grain quality (Macaulay et al., Reference Macaulay, Ramsay and Åhman2020).
Chemical control remains the predominant management strategy for aphids, with pyrethroids, neonicotinoids, carbamates, and organophosphates widely used in conventional programmes. In recent years, some insecticides with low toxicity have gained increasing attention due to their strong efficacy against piercing–sucking pests (Morita et al., Reference Morita, Yoneda and Akiyoshi2014). They cause rapid feeding cessation and neurophysiological disruption without targeting acetylcholinesterase or nicotinic acetylcholine receptors. They exhibit no cross-resistance with commonly used insecticides and are considered safer for pollinators such as honeybees (Roditakis et al., Reference Roditakis, Fytrou, Staurakaki, Vontas and Tsagkarakou2014). As a result, they have been approved in many countries as a selective and environmentally compatible control option (Zhang et al., Reference Zhang, Yang, Liu, Chen, Hu and Lu2019). Nevertheless, resistance has emerged in some aphid populations due to intensive insecticide dependence and limited mode-of-action diversity (Bass et al., Reference Bass, Denholm, Williamson and Nauen2015). Long-term, repetitive use of a single compound drives resistance by favouring the survival and inheritance of resistant genotypes. Additionally, environmental variation and improper field applications can expose populations to sublethal concentrations, which – unlike lethal doses – do not eliminate individuals but instead induce physiological stress, potentially accelerating resistance development and causing recurrent infestations (He et al., Reference He, Zhao, Zheng, Desneux and Wu2012; Kheradmand et al., Reference Kheradmand, Heidari, Sedaratian-Jahromi, Talaei-Hassanloui and Havasi2022; Ma et al., Reference Ma, Tang, Liang, Li and Gao2022).
Sublethal effects refer to physiological and behavioural impairments in survivors exposed to insecticides and are essential for assessing the ecological implications of chemical control (Desneux et al., Reference Desneux, Decourtye and Delpuech2007; Gul et al., Reference Gul, Ul Haq, Ullah, Khan, Yaseen, Shah, Tariq, Güncan, Desneux and Liu2023). These effects can alter key biological traits, including survival (Santos et al., Reference Santos, Santos, Tomé, Barbosa, Martins, Guedes and Oliveira2016), developmental rate (Xu et al., Reference Xu, Zhao, Zhang, Liu and Gu2016; Passos et al., Reference Passos, Soares, Collares, Malagoli, Desneux and Carvalho2018), and fecundity (Zhang et al., Reference Zhang, Yuan, Liu, Chen and Zhang2010; Yuan et al., Reference Yuan, Li, Liu, Cui, Lu, Xu, Li, Wu and Desneux2017). For example, Yuan et al. (Reference Yuan, Li, Liu, Cui, Lu, Xu, Li, Wu and Desneux2017) showed that LC10 and LC40 doses of cycloxaprid significantly reduced oviposition and net reproduction in Aphis gossypii. In field conditions, insecticide degradation often leads to sublethal exposure (Desneux et al., Reference Desneux, Fauvergue, Dechaume-Moncharmont, Kerhoas, Ballanger and Kaiser2005; Lu et al., Reference Lu, Zheng and Gao2016), which can modify pest behaviour and physiology, allowing survivors to pass adaptive traits to subsequent generations (Desneux et al., Reference Desneux, Decourtye and Delpuech2007; Liu et al., Reference Liu, Lu, Wu, Wyckhuys and Xue2008). Sublethal responses are species- and compound-specific: for instance, Sitobion avenae and R. padi respond differently to pirimicarb (Xiao et al., Reference Xiao, Yang, Desneux, Han and Gao2015), and sublethal bifenthrin or imidacloprid can reduce honeydew excretion and feeding in Bemisia tabaci (He et al., Reference He, Zhao, Zheng, Weng, Biondi, Desneux and Wu2013), while soil-applied cycloxaprid inhibits feeding in S. avenae (Cui et al., Reference Cui, Sun, Yang, Yan and Yuan2012). Recent studies have also shown that flonicamid suppresses population growth in A. gossypii (Shi et al., 2022) and Schizaphis graminum (Gul et al., Reference Gul, Ul Haq, Ullah, Khan, Yaseen, Shah, Tariq, Güncan, Desneux and Liu2023), and can alter phloem ingestion behaviour (Cho et al., Reference Cho, Koo, Yoon and Kim2011; Koo et al., Reference Koo, Lee, Yun, Kim and Kim2015).
Life tables are essential tools for quantifying key demographic traits such as survival, fecundity, longevity, and population growth (Chi, Reference Chi1990). They have long served as a foundation in ecology, entomology, and population biology by revealing temporal changes in population structure and enabling reliable predictions of population trends. The early development of life table methodology (Deevey Jr., Reference Deevey1947; Birch, Reference Birch1948; Southwood, Reference Southwood1978; Carey, Reference Carey1993) was pivotal in advancing insect mass-rearing, improving pest control strategies, and assessing the influence of environmental factors on population performance (Chen et al., Reference Chen, Li, Wang, Ma, Huang and Huang2017). However, classical age-specific life tables (Leslie, Reference Leslie1945; Birch, Reference Birch1948; Lewis, Reference Lewis1977) focus exclusively on females and assume identical development rates among individuals. This narrow scope can mask biological variation and limit the accuracy of population projections (Huang and Chi, Reference Huang and Chi2011). To address these limitations, the age–stage, two-sex life table approach was introduced, providing a framework that incorporates both sexes and stage differentiation. First proposed by Chi (Reference Chi1988) and later refined (Chi, Reference Chi2014), this method has since been widely adopted and expanded with modern analytical tools (Chi et al., Reference Chi, You, Atlıhan, Smith, Kavousi, Ozgökçe, Güncan, Tuan, Fu, Xu, Zheng, Ye, Chu, Yu, Gharekhanı, Saska, Gotoh, Schneider, Bussaman, Gökçe and Liu2020). By accounting for sex-specific contributions and developmental variability, the age–stage, two-sex life table enables meaningful comparisons under different environmental conditions and provides a robust basis for forecasting pest outbreaks and evaluating population growth potential (Yang and Chi, Reference Yang and Chi2006; Atlihan et al., Reference Atlıhan, Kasap, Özgökçe, Polat-Akköprü and Chi2017; Qin et al., Reference Qin, Liu, Zhang, Cheng, Luo and Jiang2018; Özgökçe et al., Reference Özgökçe, Chi, Atlıhan and Kara2018b; Govindan and Hutchison, Reference Govindan and Hutchison2020). Consequently, it has become an indispensable component of ecological research and integrated pest management (IPM) programmes.
Insecticides remain a central tool in modern pest control, not only because of their lethality but also due to a wide range of sublethal effects that can suppress pest populations. These sublethal impacts – such as reduced fecundity, delayed development, altered sex ratios, behavioural disruptions, and decreased feeding or oviposition – can substantially diminish population growth by lowering individual fitness (Galvan et al., Reference Galvan, Koch and Hutchison2005; Desneux et al., Reference Desneux, Decourtye and Delpuech2007). Among chemical groups, pyrethroids are particularly notable for their rapid knockdown effect, broad spectrum of activity, and low cost, which have made them widely used in agricultural systems. However, extensive and repeated pyrethroid use has led to resistance in many pest species, while their persistence in the environment and negative effects on natural enemies raise serious concerns for long-term sustainability (Liu et al., Reference Liu, Li, Huang, Kang, Yang and Wu2015a). These issues highlight the need to integrate pyrethroids with alternative control tactics within IPM frameworks to delay resistance and reduce ecological risks.
The overuse or misuse of insecticides threatens environmental health, disrupts ecological balance, and poses risks to humans. Therefore, applying the lowest effective concentration is a fundamental principle of sustainable pest management. Sublethal doses – those that do not cause immediate mortality – can still impose significant physiological and behavioural stress (Desneux et al., Reference Desneux, Decourtye and Delpuech2007; Liu et al., Reference Liu, Lu, Wu, Wyckhuys and Xue2008). Such stress may prolong development, reduce reproductive output, alter feeding behaviour, or disrupt mating activity (Ghalambor et al., Reference Ghalambor, McKay, Carroll and Reznick2007; Arno et al., Reference Arnó and Gabarra2011; Quan et al., Reference Quan, Qiu, Zhang, Sun, Li and Yan2016), ultimately affecting long-term population trajectories. Moreover, some sublethal effects may persist into subsequent generations (Stark and Banks, Reference Stark and Banks2003; Guo et al., Reference Guo, Desneux, Sonoda, Liang, Han and Gao2013), making their study even more relevant for pest management.
As sublethal insecticide exposure can produce diverse biological responses depending on the compound and concentration, life table analysis is widely recommended for accurately quantifying these effects (Stark and Banks, Reference Stark and Banks2003). Numerous studies have shown that sublethal pyrethroid exposure can profoundly alter development, reproduction, behaviour, and feeding in pest species (Kidd et al., Reference Kidd, Rummel and Thorvilson1996; Desneux et al., Reference Desneux, Pham-Delègue and Kaiser2004, Reference Desneux, Fauvergue, Dechaume-Moncharmont, Kerhoas, Ballanger and Kaiser2005; Quan et al., Reference Quan, Qiu, Zhang, Sun, Li and Yan2016; Xiao et al., Reference Xiao, Yang and Zhang2016a, Reference Xiao, Zhao, Guo, Li, Zhang and Wang2016b; Qu et al., Reference Qu, Ullah, Luo, Monticelli, Lavoir, Gao, Song and Desneux2020a; Graily-Moradi et al., Reference Graily-Moradi, Hejazi, Enayati and Hamishehkar2021; Afza et al., Reference Afza, Riaz, Afzal and Majeed2021a; Alfaro-Tapia et al., Reference Alfaro-Tapia, Alvarez-Baca, Fuentes-Contreras and Figueroa2021a, Reference Alfaro-Tapia, García and Pineda2021b; Tan et al., Reference Tan, Jia, Foster, Homem, Williamson, Han and Shan2021a; Shi et al., Reference Shi, Luo, Lv, Zhang, Desneux, You, Li, Ullah and Ma2022a). These findings show that sublethal effects influence both individual biology and population structure, as well as ecological interactions, providing an additional pathway for long-term pest suppression.
In this study, we examined the sublethal effects of deltamethrin, cypermethrin, and chlorantraniliprole on Rhopalosiphum padi using the age–stage, two-sex life table method. Although sublethal responses to insecticides have been reported in aphids, comprehensive demographic data for R. padi remain limited. By showing how low-dose exposure alters developmental schedules, reduces reproductive potential, and affects long-term population dynamics, our findings clarify the hidden demographic costs imposed by these compounds. This work provides species-specific insights that strengthen the scientific basis for sustainable, ecologically based pest management strategies.
Material and methods
In this study, insecticides containing the active ingredients Chlorantraniliprole (200 g/L, Umtas®/DOĞAL_AGROTEZ), Cypermethrin (250 g/L, Arrivo®/HEKTAŞ), and Deltamethrin (25 g/L, Deltharin®/HEKTAŞ) were applied to assess their effects on Rhopalosiphum padi.
Preparation of host plants
To rear Rhopalosiphum padi, wheat plants (Triticum aestivum L.) were grown in 200 mL plastic pots containing an equal mixture of soil and peat. Cultivation took place in a controlled-environment chamber set to 25 ± 1 °C, with relative humidity maintained at 60 ± 5% and a photoperiod of 16 hours light and 8 hours darkness.
Aphid colony maintenance
For the experimental procedures, wheat plants were selected once they reached an average height of 15 cm and had developed six fully expanded leaves. Late-instar nymphs of R. padi were then carefully transferred onto these plants. To promote aphid population growth, each infested plant was individually enclosed in a mesh cage measuring 50 × 50 × 50 cm. The aphids used in the trials were obtained from a continuously maintained laboratory colony. To ensure the health and vigour of the colony, older or physiologically compromised plants were replaced weekly with fresh, healthy specimens.
Bioassay of insecticide toxicity on Rhopalosiphum padi
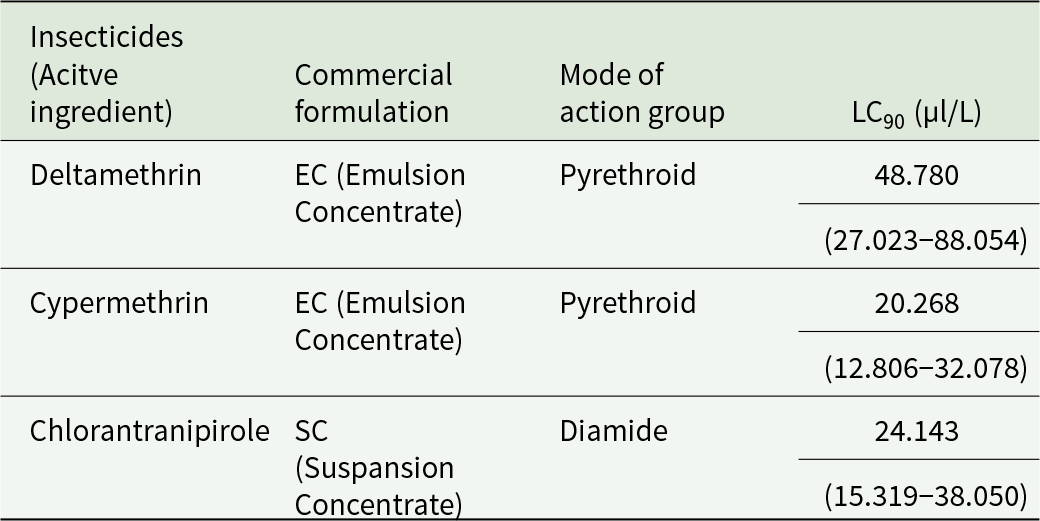
At this stage of the study, the most effective concentrations (LC₉₀) of the insecticides tested against R. padi were determined through preliminary bioassays. The obtained LC₉₀ values were then serially diluted to generate seven different treatment concentrations, excluding the untreated control. Information on the tested insecticides, including their active ingredients, commercial formulations, and dilution ranges, is summarised in Table 1. All bioassays were conducted in 9 cm diameter Petri dishes lined with filter paper. A volume of 1 mL of each prepared insecticide solution was evenly distributed over the entire surface of the filter paper in the corresponding Petri dish, and the solution was allowed to be completely absorbed and the surface to dry. The experiments were carried out using 24-hour-old (one-day-old) nymphs of R. padi, which were obtained from synchronised laboratory cultures.
Insecticides tested against Rhopalosiphum padi, their formulations, and concentration ranges

Table 1 Long description
The table reports LC90 values for three insecticides tested against Rhopalosiphum padi, along with each product’s commercial formulation and mode of action group. Cypermethrin, an emulsion concentrate pyrethroid, shows the lowest LC90 at 20.268 microliters per liter, with a range from 12.806 to 32.078. Chlorantraniprole, a suspension concentrate diamide, has an LC90 of 24.143 microliters per liter, ranging from 15.319 to 38.050. Deltamethrin, also an emulsion concentrate pyrethroid, has the highest LC90 at 48.780 microliters per liter, with a range from 27.023 to 88.054. Overall, cypermethrin appears most potent and deltamethrin least potent based on LC90, but the ranges overlap, so differences should be interpreted cautiously.
The nymphs were carefully transferred onto the treated filter paper using a fine sable brush. During transfer, particular care was taken to ensure direct contact of the aphids’ tarsi, ventral surface, and labium with the insecticide-treated surface. This contact was achieved by placing the nymphs directly onto the treated substrate in a manner that allowed them to assume natural walking and feeding postures, thereby standardising both contact and behavioural exposure conditions. To maintain feeding activity, a freshly cut wheat leaf was placed in each Petri dish. After 24 hours of exposure, the numbers of live and dead individuals in each Petri dish were recorded to assess the toxic effects of the insecticides. Each concentration was tested using 10 Petri dishes, each containing 10 nymphs. The control group followed the same procedure, except that the filter paper was treated with distilled water only.
Each insecticide experiment was independently replicated. Mortality data were corrected using Abbott’s formula (Abbott, Reference Abbott1925) to account for natural mortality. The resulting mortality percentages were analysed by analysis of variance (ANOVA), and where significant differences were found, Tukey’s multiple comparison test was used to determine pairwise differences. Pooled mortality data were then subjected to probit analysis to estimate the lethal concentrations (LC₃₀, LC₄₀, LC₅₀ μL active ingredient per L of distilled water) of the insecticides against R. padi within a 95% confidence interval. All statistical analyses were performed using the POLO-PC software package (LeOra Software, 1994).
 $Percentage{\text{ }}Effect = \left( {\frac{{{N_c} - {N_t}}}{{{N_c}}}} \right)x100$ (Abbott, Reference Abbott1925).
Nc: Number of live individuals in the control group
Nt: Number of live individuals in the treatment group
Demographic assessment of Rhopalosiphum padi
In this phase of the study, the effects of insecticides at their LC₃₀, LC₄₀, and LC₅₀ concentrations on R. padi were assessed. The specified doses were applied by impregnating filter papers placed in Petri dishes, following the methodology described in the previous bioassay. One-day-old aphids were carefully transferred onto the treated surfaces using a fine sable brush to ensure full contact with the insecticide. To prevent leaf desiccation, a thin layer of moist cotton was placed at the base of each dish. The development of each individual was monitored daily, and newly emerged nymphs were recorded and removed to avoid overlapping generations. Each insecticide concentration was tested with 50 replicates, while the control group included 60 replicates. To ensure adequate ventilation, the Petri dish lids were modified with standardised openings covered with fine mesh to prevent aphid escape. All treatments were conducted independently for each insecticide. The experiments were carried out in a controlled climate chamber maintained at 25 ± 1 °C, 60 ± 5% relative humidity, and a 16:8 (light: dark) photoperiod.
Demographic performance analysis
Raw datasets were used to examine the developmental duration, survival, and reproductive parameters of R. padi. Analyses were conducted using the TWOSEX-MSChart software (Chi, Reference Chi2022a), which applies the age–stage, two-sex life table methodology (Chi and Liu, Reference Chi and Liu1985; Chi, Reference Chi1988). Key demographic indices, including the intrinsic rate of increase (r), finite rate of increase (λ), net reproductive rate (R₀), and mean generation time (T), were calculated, along with supplementary population parameters such as age-specific survival (lx), fecundity (mx), age- and stage-specific survival (sxj x = age, j = stage), life expectancy (exj), and reproductive value (vxj) (Goodman, Reference Goodman1982; Chi and Su, Reference Chi and Su2006; Huang and Chi, Reference Huang and Chi2011; Tuan et al., Reference Tuan, Lee and Chi2014). To enable robust comparisons of life table and population metrics among aphids reared on different host plants, a paired bootstrap procedure with 100000 resampling iterations was applied (Efron and Tibshirani, Reference Efron and Tibshirani1994; Özgökçe et al., Reference Özgökçe, Chi, Atlıhan and Kara2018a; Wei et al., Reference Wei, Chi, Guo, Li, Zhao and Ma2020).
The age–stage–specific survival rate (sxj) is calculated as follows;
 \begin{equation*}{S_{xj}} = \frac{{{n_{xj}}}}{{{n_{01}}}}\end{equation*}
sxj = survival probability of individuals at age x and stage j,
nxj = number of individuals surviving to age x and stage j,
n01 = initial number of newly born individuals.
This parameter represents the probability that a newly hatched individual will survive to a specific age and developmental stage, capturing the joint variability of age and stage within the population (Chi and Liu, Reference Chi and Liu1985).
The age-specific survival rate (lx) and age-specific fecundity (mx) are calculated as follows:
 \begin{equation*}{l_x} = {\text{ }}\mathop \sum \limits_{j = 1}^\beta {s_{xj}}\end{equation*}
 \begin{equation*}m_x = \frac{\sum_{j=1}^{\beta} s_{xj} f_{xj}}{\sum_{j=1}^{\beta} s_{xj}}\end{equation*}
In this framework, β denotes the total number of developmental stages, whereas sxj represents the survival probability associated with a specific age and stage – that is, the chance that an individual, beginning from hatching, will survive to attain age x and developmental stage j.
The net reproductive rate (R₀) quantifies the total number of offspring an individual is expected to produce over its lifespan and is determined using the following formula:
 \begin{equation*}R_0 = \sum_{x=0}^{\infty} l_x m_x \end{equation*}
The intrinsic rate of increase (r) is iteratively estimated by applying the Euler–Lotka equation, starting from age zero as the initial index (Goodman, Reference Goodman1982):
 \begin{equation*}\mathop \sum \limits_{x = 0}^\infty {e^{ - r\left( {x + 1} \right)}}{l_x}{m_x}\end{equation*}
The finite rate of increase (λ) is determined using the following equation:
 \begin{equation*}\lambda = {e^r}\end{equation*}
The mean generation time (T) represents the period required for a population, under a stable age-stage distribution, to increase in size by a factor of R₀ and is calculated as follows:
 \begin{equation*}T = \frac{{\ln {R_0}}}{r}\end{equation*}
The age-specific life expectancy (exj) refers to the estimated duration that an individual or insect at age x and stage j is expected to live (Chi and Su, Reference Chi and Su2006):
 \begin{equation*}e_{xj} = \sum_{i=x}^{\infty} \sum_{y=j}^{\beta} s_{iy}'\end{equation*}
Here, s′ᵢY; represents the probability that an individual at age x and stage j will survive to age i and stage y, assuming that sxj = 1 at the starting point.
The age- and stage-specific reproductive value (vxj) represents the anticipated contribution of individuals at a given age x and developmental stage j to the future growth of the population, and it is computed following the procedure outlined by Tuan et al. (Reference Tuan, Lee and Chi2014):
 \begin{equation*}v_{xj} = \frac{e^{r(x+1)}}{s_{xj}} \sum_{i=x}^{\infty} e^{-r(i+1)} \sum_{y=j}^{\beta} s_{iy}' f_{iy}\end{equation*}
Variances and standard errors (SE) for all measured parameters were calculated using 100000 bootstrap iterations (Huang and Chi, Reference Huang and Chi2012; Akca et al., Reference Akca, Ayvaz, Yazici, Smith and Chi2015; Polat Akköprü et al., Reference Polat Akköprü, Atlıhan, Okut and Chi2015; Wei et al., Reference Wei, Chi, Guo, Li, Zhao and Ma2020; Chi, Reference Chi2022b; Chen et al., Reference Chen, Bian, Chi and Xu2024). Differences among insecticide treatments were evaluated using paired bootstrap tests at a 5% significance level based on the confidence intervals (Wei et al., Reference Wei, Chi, Guo, Li, Zhao and Ma2020). All analyses were conducted using the TWOSEX-MSChart software.
Population simulation under insecticide treatments
The future demographic responses of R. padi to various insecticide treatments were projected using an age-stage, two-sex life table simulation. This modelling approach integrates stage differentiation, survival schedules, and fecundity rates to reproduce temporal fluctuations in population abundance and structure. The simulation aimed to quantify potential differences in growth potential and demographic composition across treatments (Chi, Reference Chi1988; Chi and Su, Reference Chi and Su2006; Huang and Chi, Reference Huang and Chi2011; Yu et al., Reference Yu, Chen, Zheng, Shi, Guo, Yeh, Chi and Xu2013). All computations were performed using TIMING-MSChart (Chi, Reference Chi2022b).
Results
Susceptibility of Rhopalosiphum padi to selected insecticides
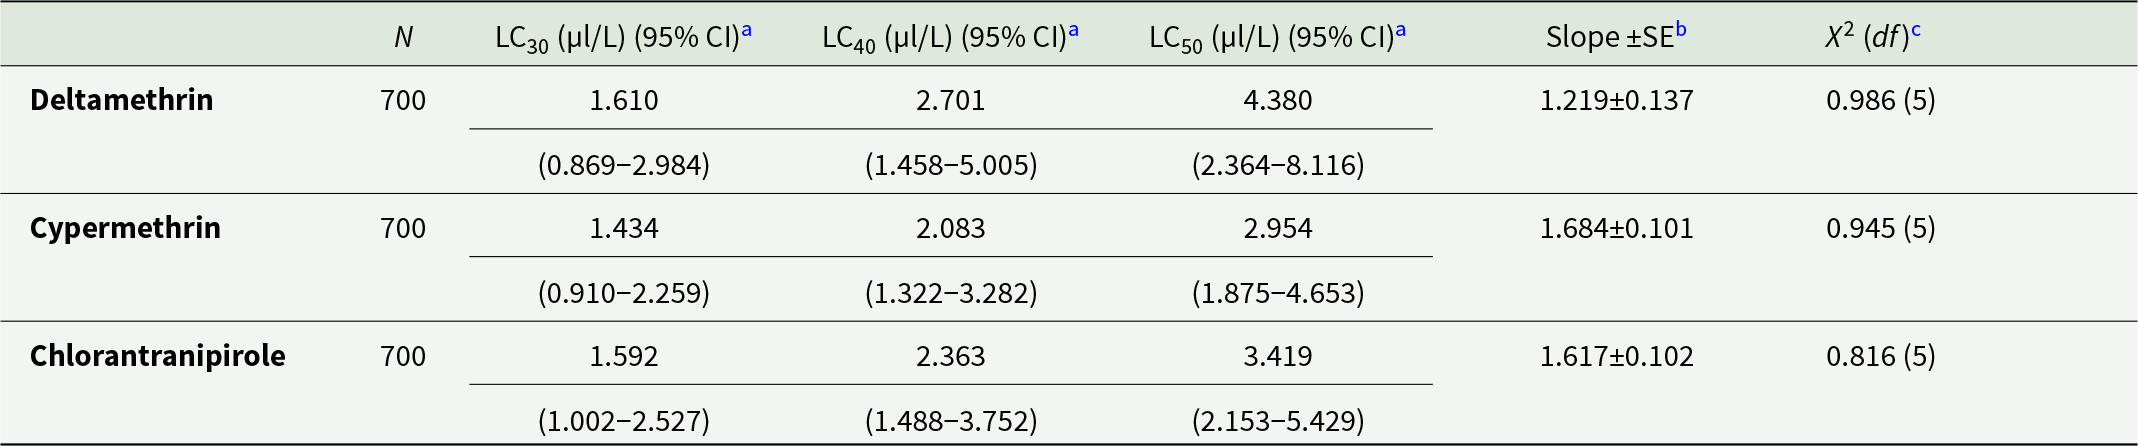
After 24 hours of exposure, R. padi showed varying susceptibility to the tested insecticides. Cypermethrin exhibited the highest toxicity, with the lowest LC₅₀ value (2.954 µl/L) and a steep dose-response slope, indicating strong effectiveness even at low concentrations. Deltamethrin had lower toxicity, as indicated by a higher LC₅₀ (4.380 µl/L) and a gentler slope, while Chlorantraniliprole showed intermediate toxicity (LC₅₀ = 3.419 µl/L) and a relatively steep slope. Chi-square tests confirmed that the probit models fitted the mortality data well for all insecticides. These results indicate that Cypermethrin is the most potent of the three tested insecticides for controlling R. padi under short-term exposure conditions (Table 2).
Toxicity of Deltamethrin, Cypermethrin and Chlorantraniliprole on Rhopalosiphum padi after 24 h

Table 2 Long description
The table reports 24-hour lethal concentration estimates for three insecticides tested on Rhopalosiphum padi, with 700 individuals per insecticide. Cypermethrin shows the greatest toxicity, with a median lethal concentration of 2.954 microliters per liter and a 95 percent confidence interval from 1.875 to 4.653. Chlorantraniliprole is intermediate, with a median lethal concentration of 3.419 microliters per liter and a 95 percent confidence interval from 2.153 to 5.429. Deltamethrin is least toxic, with a median lethal concentration of 4.380 microliters per liter and a 95 percent confidence interval from 2.364 to 8.116. The same ranking appears at lower effect levels: at 30 percent mortality, cypermethrin is 1.434, chlorantraniliprole 1.592, and deltamethrin 1.610 microliters per liter; at 40 percent mortality, cypermethrin is 2.083, chlorantraniliprole 2.363, and deltamethrin 2.701 microliters per liter. Dose response slopes are 1.219 for deltamethrin, 1.684 for cypermethrin, and 1.617 for chlorantraniliprole, each with small standard errors. Model fit indicators are close to 1 with 5 degrees of freedom for all three, and confidence intervals overlap, so differences should be interpreted with that uncertainty in mind.
a 95% confidence intervals.
b Standard error.
c Chi-square value (x2) and degrees of freedom (df).
The development times, longevity, fecundity, and oviposition of Rhopalosiphum padi
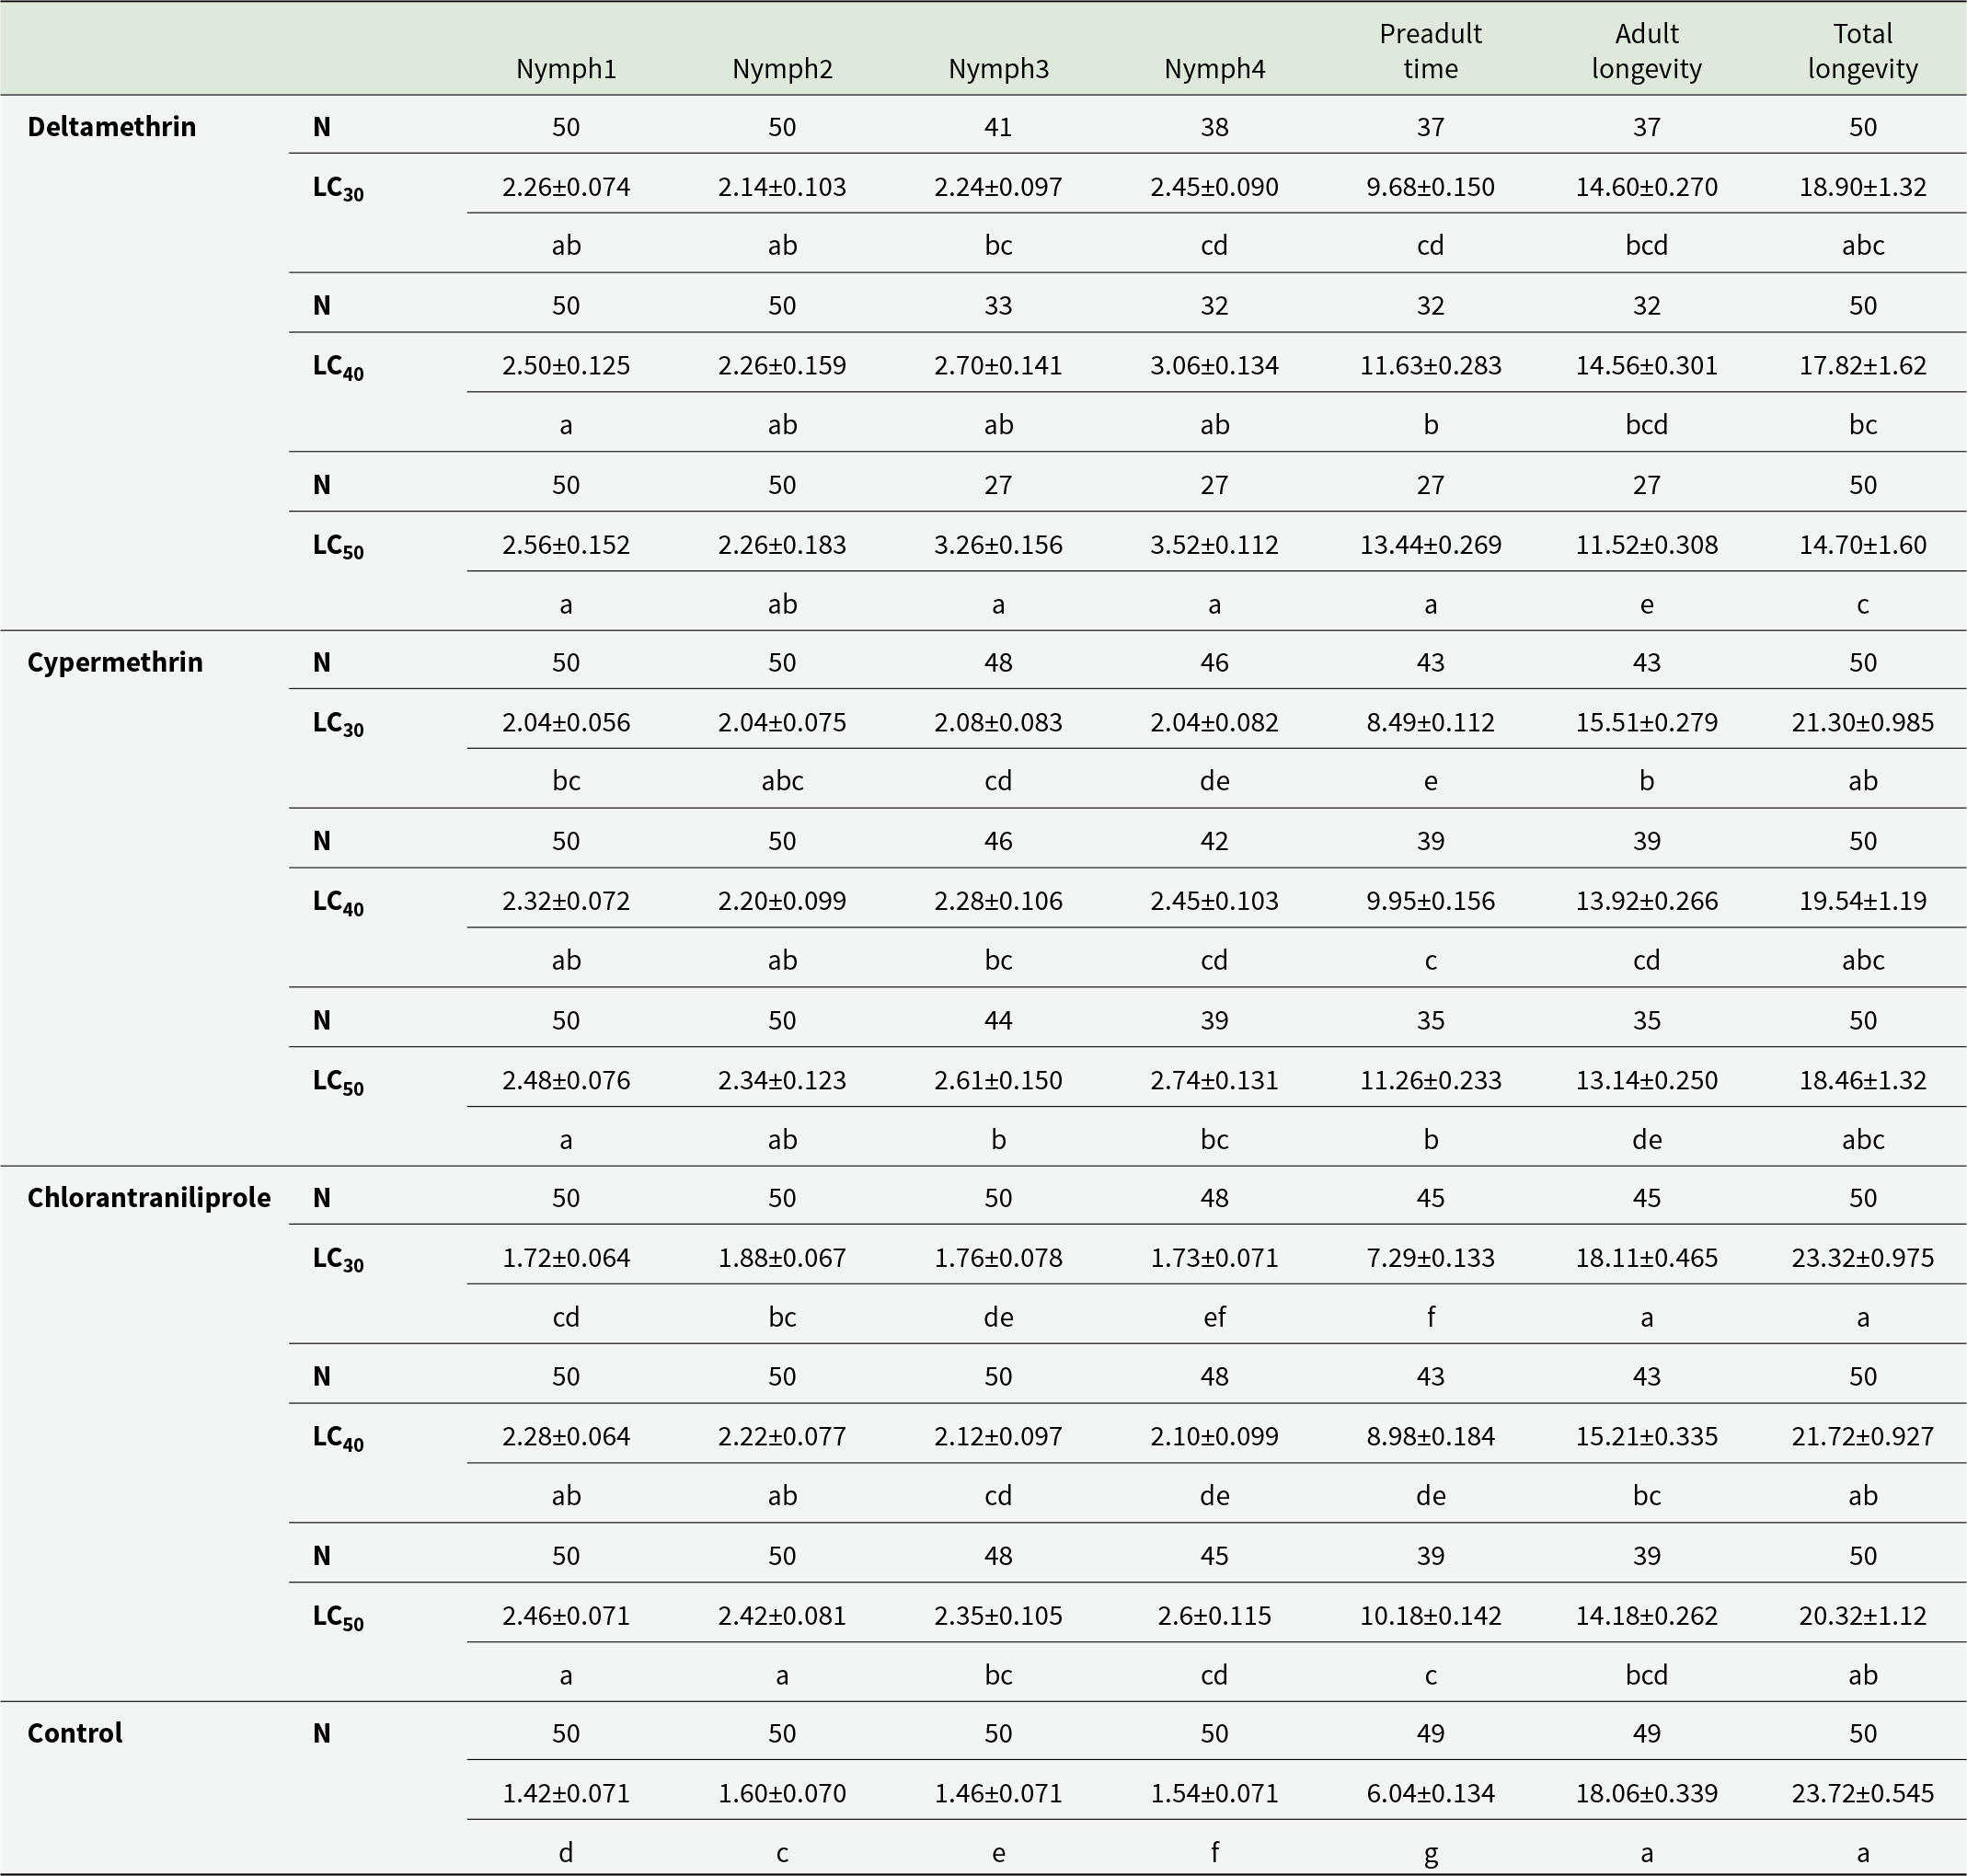
The developmental results clearly showed that all three insecticides significantly prolonged the immature stages of R. padi (p < 0.05). In the control group, the total nymphal duration was 6.04 days and total longevity reached 23.72 days, reflecting the natural developmental rhythm of the species. In contrast, deltamethrin caused a marked dose-dependent delay, extending the pre-adult period to 9.68, 11.63, and 13.44 days at LC30, LC40, and LC50, respectively. Cypermethrin produced a similar but slightly milder effect (8.49–11.26 days), while chlorantraniliprole caused comparatively shorter delays (7.29–10.18 days). The highest sublethal doses also led to substantial prolongation of the fourth nymphal instar, particularly with deltamethrin (3.52 days) and cypermethrin (2.74 days), indicating increased physiological stress at later developmental stages. Conversely, total longevity declined across all treatments; deltamethrin LC50 reduced lifespan to 14.70 days, while cypermethrin and chlorantraniliprole LC50 resulted in longevities of 18.46 and 20.32 days, respectively (Table 3).
The development times, longevity of Rhopalosiphum padi on different insecticides (Deltamethrin, Cypermethrin and Chrolarantraniliprole) and their different doses (LC30, LC40, LC50) (mean±SE)

Table 3 Long description
The table reports mean development time (with standard error) for four nymph stages, preadult time, adult longevity, and total longevity of Rhopalosiphum padi under three insecticides at LC30, LC40, and LC50, plus an untreated control; sample sizes are listed for each stage and outcome. Control values were 6.04 days preadult time, 18.06 days adult longevity, and 23.72 days total longevity. Chlorantraniliprole at LC30 had the shortest preadult time (7.29 days) and a high total longevity (23.32 days), very similar to the control, while its LC40 and LC50 increased preadult time to 8.98 and 10.18 days and reduced total longevity to 21.72 and 20.32 days. Cypermethrin showed increasing preadult time with dose (8.49 to 9.95 to 11.26 days) and decreasing total longevity (21.30 to 19.54 to 18.46 days). Deltamethrin produced the strongest dose-related shift: preadult time rose from 9.68 to 11.63 to 13.44 days, while adult longevity dropped from 14.60 to 14.56 to 11.52 days and total longevity fell from 18.90 to 17.82 to 14.70 days. Across treatments, higher doses generally lengthened nymph and preadult development and shortened adult and total longevity, with chlorantraniliprole at LC30 being the closest to control for overall longevity. Letter groupings indicate which means differ statistically within each column, so comparisons should rely on those groupings as well as the numeric differences.
* Differences between means signed in the same column with the same letters are significantly important (p < 0.05). (PNymph1:0.001, FNymph1:18.12, DFNymph1:9) (PNymph2:0.001, FNymph2:4.80, DFNymph2:9) (PNymph3:0.001, FNymph3:19.21, DFNymph3:9) (PNymph4:0.001, FNymph4:31.44, DFNymph4:9) (PPreadult:0.001, FPreadult:145.11, DFPreadult:9) (PAdultlongevity:0.001, FAdultlongevity:38.19, DFAdultlongevity:9) (PTotallongevity:0.001, FTotallongevity:5.11, DFTotallongevity:9). N: Number of individuals.
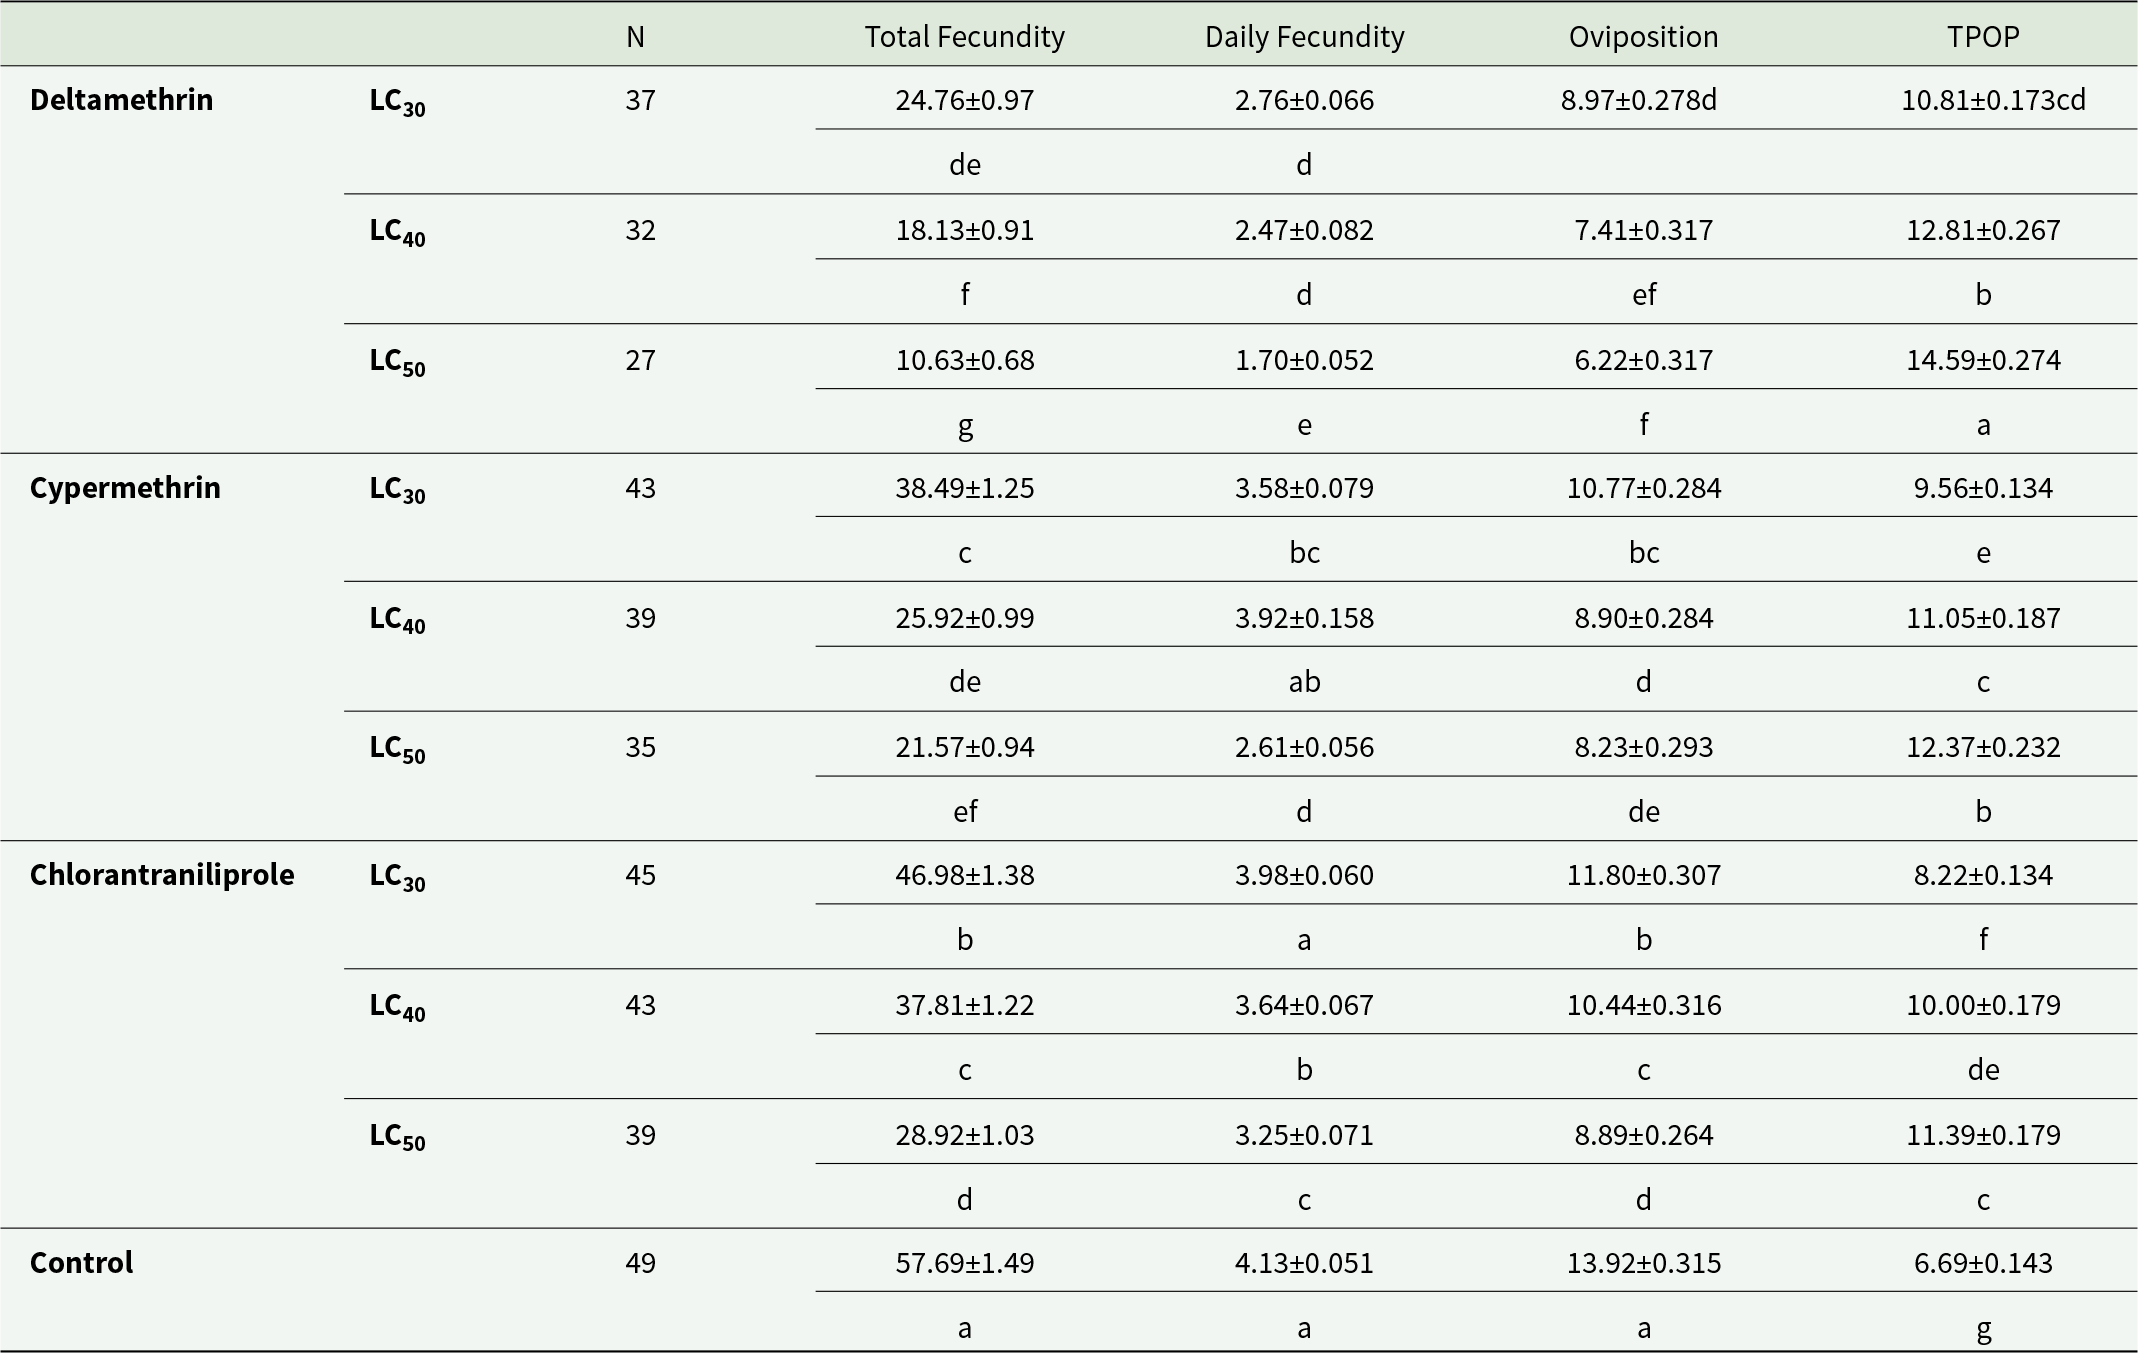
The reproductive data showed that sublethal insecticide exposure imposed the strongest biological constraint on R. padi by substantially reducing fecundity and altering reproductive timing. In the control group, total fecundity averaged 57.69 offspring, daily fecundity 4.13 offspring per day, the oviposition period 13.92 days, and TPOP 6.69 days. At LC50, deltamethrin caused a dramatic decline in reproductive output, reducing total fecundity to 10.63, daily fecundity to 1.70, shortening the oviposition period to 6.22 days, and extending TPOP to 14.59 days, indicating a marked delay in the onset of reproduction. Cypermethrin had a moderate suppressive effect, resulting in 38.49, 25.92, and 21.57 offspring at LC30, LC40, and LC50, respectively. Chlorantraniliprole had the mildest reproductive impact, with comparatively higher fecundity at LC30 (46.98) and LC40 (37.81) (Table 4).
Total and Daily Fecundity, oviposition and TPOP of Rhopalosiphum padi on different insecticides (Deltamethrin, Cypermethrin and Chrolarantraniliprole) and their different doses (LC30, LC40, LC50) (mean±SE)

Table 4 Long description
The table reports sample size and mean values with standard errors for total fecundity, daily fecundity, oviposition period, and total pre-oviposition period (TPOP) for Rhopalosiphum padi under three insecticides at LC30, LC40, and LC50, plus an untreated control. The control group shows the highest reproduction and fastest onset of reproduction: total fecundity 57.69, daily fecundity 4.13, oviposition 13.92, and TPOP 6.69 (N 49). Across all insecticides, increasing dose generally lowers total and daily fecundity and shortens oviposition, while TPOP tends to lengthen. Deltamethrin shows the strongest suppression at LC50, with total fecundity 10.63 and daily fecundity 1.70, and the longest TPOP observed at 14.59 (N 27). Cypermethrin is intermediate, ranging from total fecundity 38.49 at LC30 to 21.57 at LC50, with TPOP increasing from 9.56 to 12.37 (N 43 to 35). Chlorantraniliprole maintains higher fecundity than the other insecticides at comparable doses, from 46.98 at LC30 to 28.92 at LC50, and has the shortest TPOP among treated groups at LC30 (8.22) (N 45 to 39). Letter groupings indicate which means differ statistically within each column, so comparisons should follow those group labels rather than small numeric differences alone.
* Differences between means signed in the same column with the same letters are significantly important (p < 0.05) (PTotalfecundity:0.001, FTotalfecundity:143.12, DFTotalfecundity:9) (PDailyfecundity:0.001, FDailyfecundity:86.95, DFDailyfecundity:9) (POviposition:0.001, FOviposition:55.44, DFOviposition:9) (PTPOP:0.001, FTPOP:149.67, DFTPOP:9). TPOP: Total pre-oviposition period of female counted from birth. N: Number of individuals.
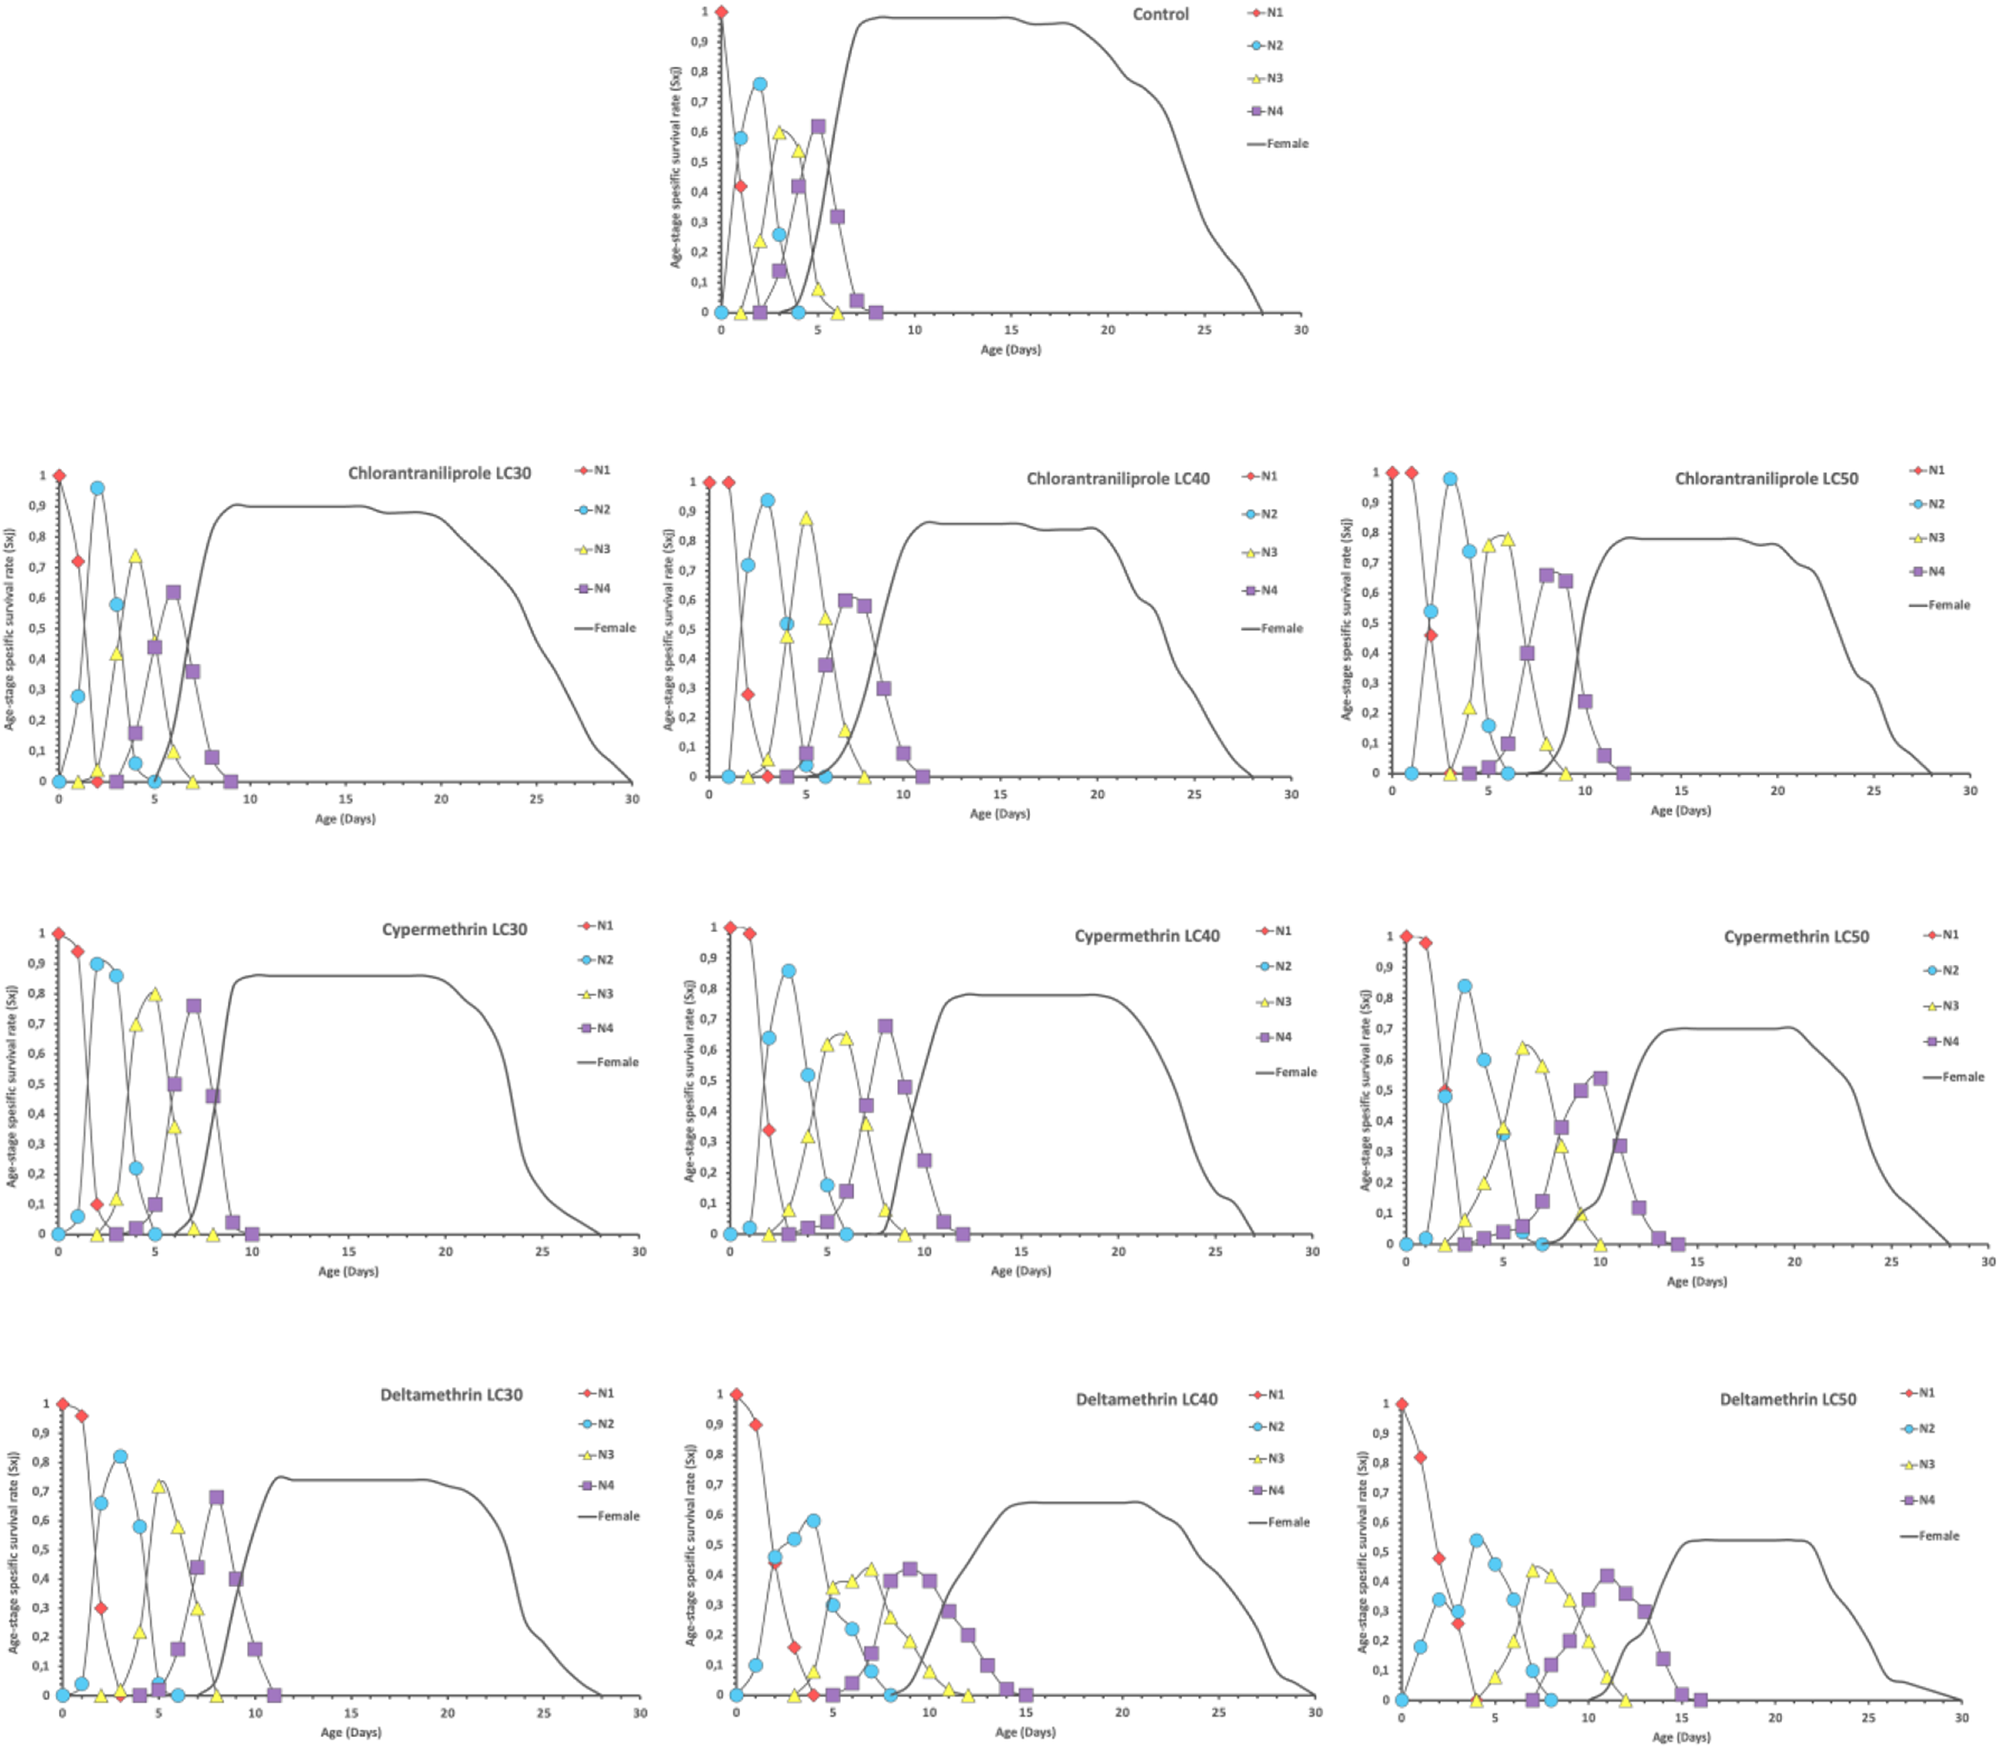
The age–stage–specific survival probabilities (sxj) of R. padi exposed to different insecticides and concentrations are shown in Fig. 1. The results demonstrate that sublethal doses of the tested compounds markedly reduced survival trajectories throughout development. Compared with the control cohort, survival probabilities declined progressively as insecticide concentration increased, with the most pronounced reductions at higher sublethal doses. Although these concentrations did not directly cause immediate mortality, they evidently compromised physiological resilience, diminishing the likelihood of individuals successfully advancing through subsequent developmental stages. Overall, increasing insecticide dose produced measurable and statistically significant reductions in sxj values. This pattern indicates that elevated exposure levels impose not only delayed or hidden toxic effects but also impair the developmental performance of surviving individuals. (Fig. 1).
Age-stage survival rates of Rhopalosiphum padi exposed to different insecticides and their different doses.

Figure 1 Long description
The image contains ten line graphs arranged in rows. Each graph shares the same axis structure. The x-axis is labeled Age (days) and the y-axis is labeled Survival probability (sxj), ranging from 0 to 1. Each graph contains multiple plotted lines with markers representing individual developmental stages, plus one line representing Females. A legend visible in each graph lists the following entries: R1, R2, R3, R4, N1, N2, N3, N4 and Females. The first graph is titled Control. The survival probability line for Females begins near 1 at age 0, remains at or near 1 through approximately age 20, then declines steeply and reaches near 0 by approximately age 40. The stage-specific lines show peaks at early ages, each declining toward 0 at different points before age 20. The second graph is titled Chlorantraniliprole LC20. The Females line begins near 1 and starts declining earlier than the Control, reaching near 0 by approximately age 35. Stage-specific peaks appear narrower and shifted slightly earlier compared to Control. The third graph is titled Chlorantraniliprole LC40. The Females line declines more steeply than LC20, reaching near 0 by approximately age 30. Stage-specific lines show reduced peak heights. The fourth graph is titled Chlorantraniliprole LC50. The Females line begins near 1 but declines sharply, reaching near 0 by approximately age 25. Stage-specific lines are compressed further toward early ages. The fifth graph is titled Cypermethrin LC20. The Females line remains near 1 until approximately age 15, then declines to near 0 by approximately age 35. The sixth graph is titled Cypermethrin LC40. The Females line declines earlier, reaching near 0 by approximately age 28. Stage-specific peaks are lower and narrower than in the LC20 panel. The seventh graph is titled Cypermethrin LC50. The Females line shows the steepest decline among Cypermethrin panels, reaching near 0 by approximately age 22. Stage-specific peaks are visibly reduced. The eighth graph is titled Deltamethrin LC20. The Females line begins near 1, remains elevated until approximately age 18, then declines to near 0 by approximately age 35. The ninth graph is titled Deltamethrin LC40. The Females line declines more steeply, reaching near 0 by approximately age 28. The tenth graph is titled Deltamethrin LC50. The Females line shows the earliest and steepest decline among Deltamethrin panels, reaching near 0 by approximately age 20. Stage-specific lines across all panels are compressed to earlier ages as dose increases from LC20 to LC50. Across all insecticide panels, the Control graph shows the latest decline in the Females survival line and the widest spread of stage-specific peaks compared to all treated panels.
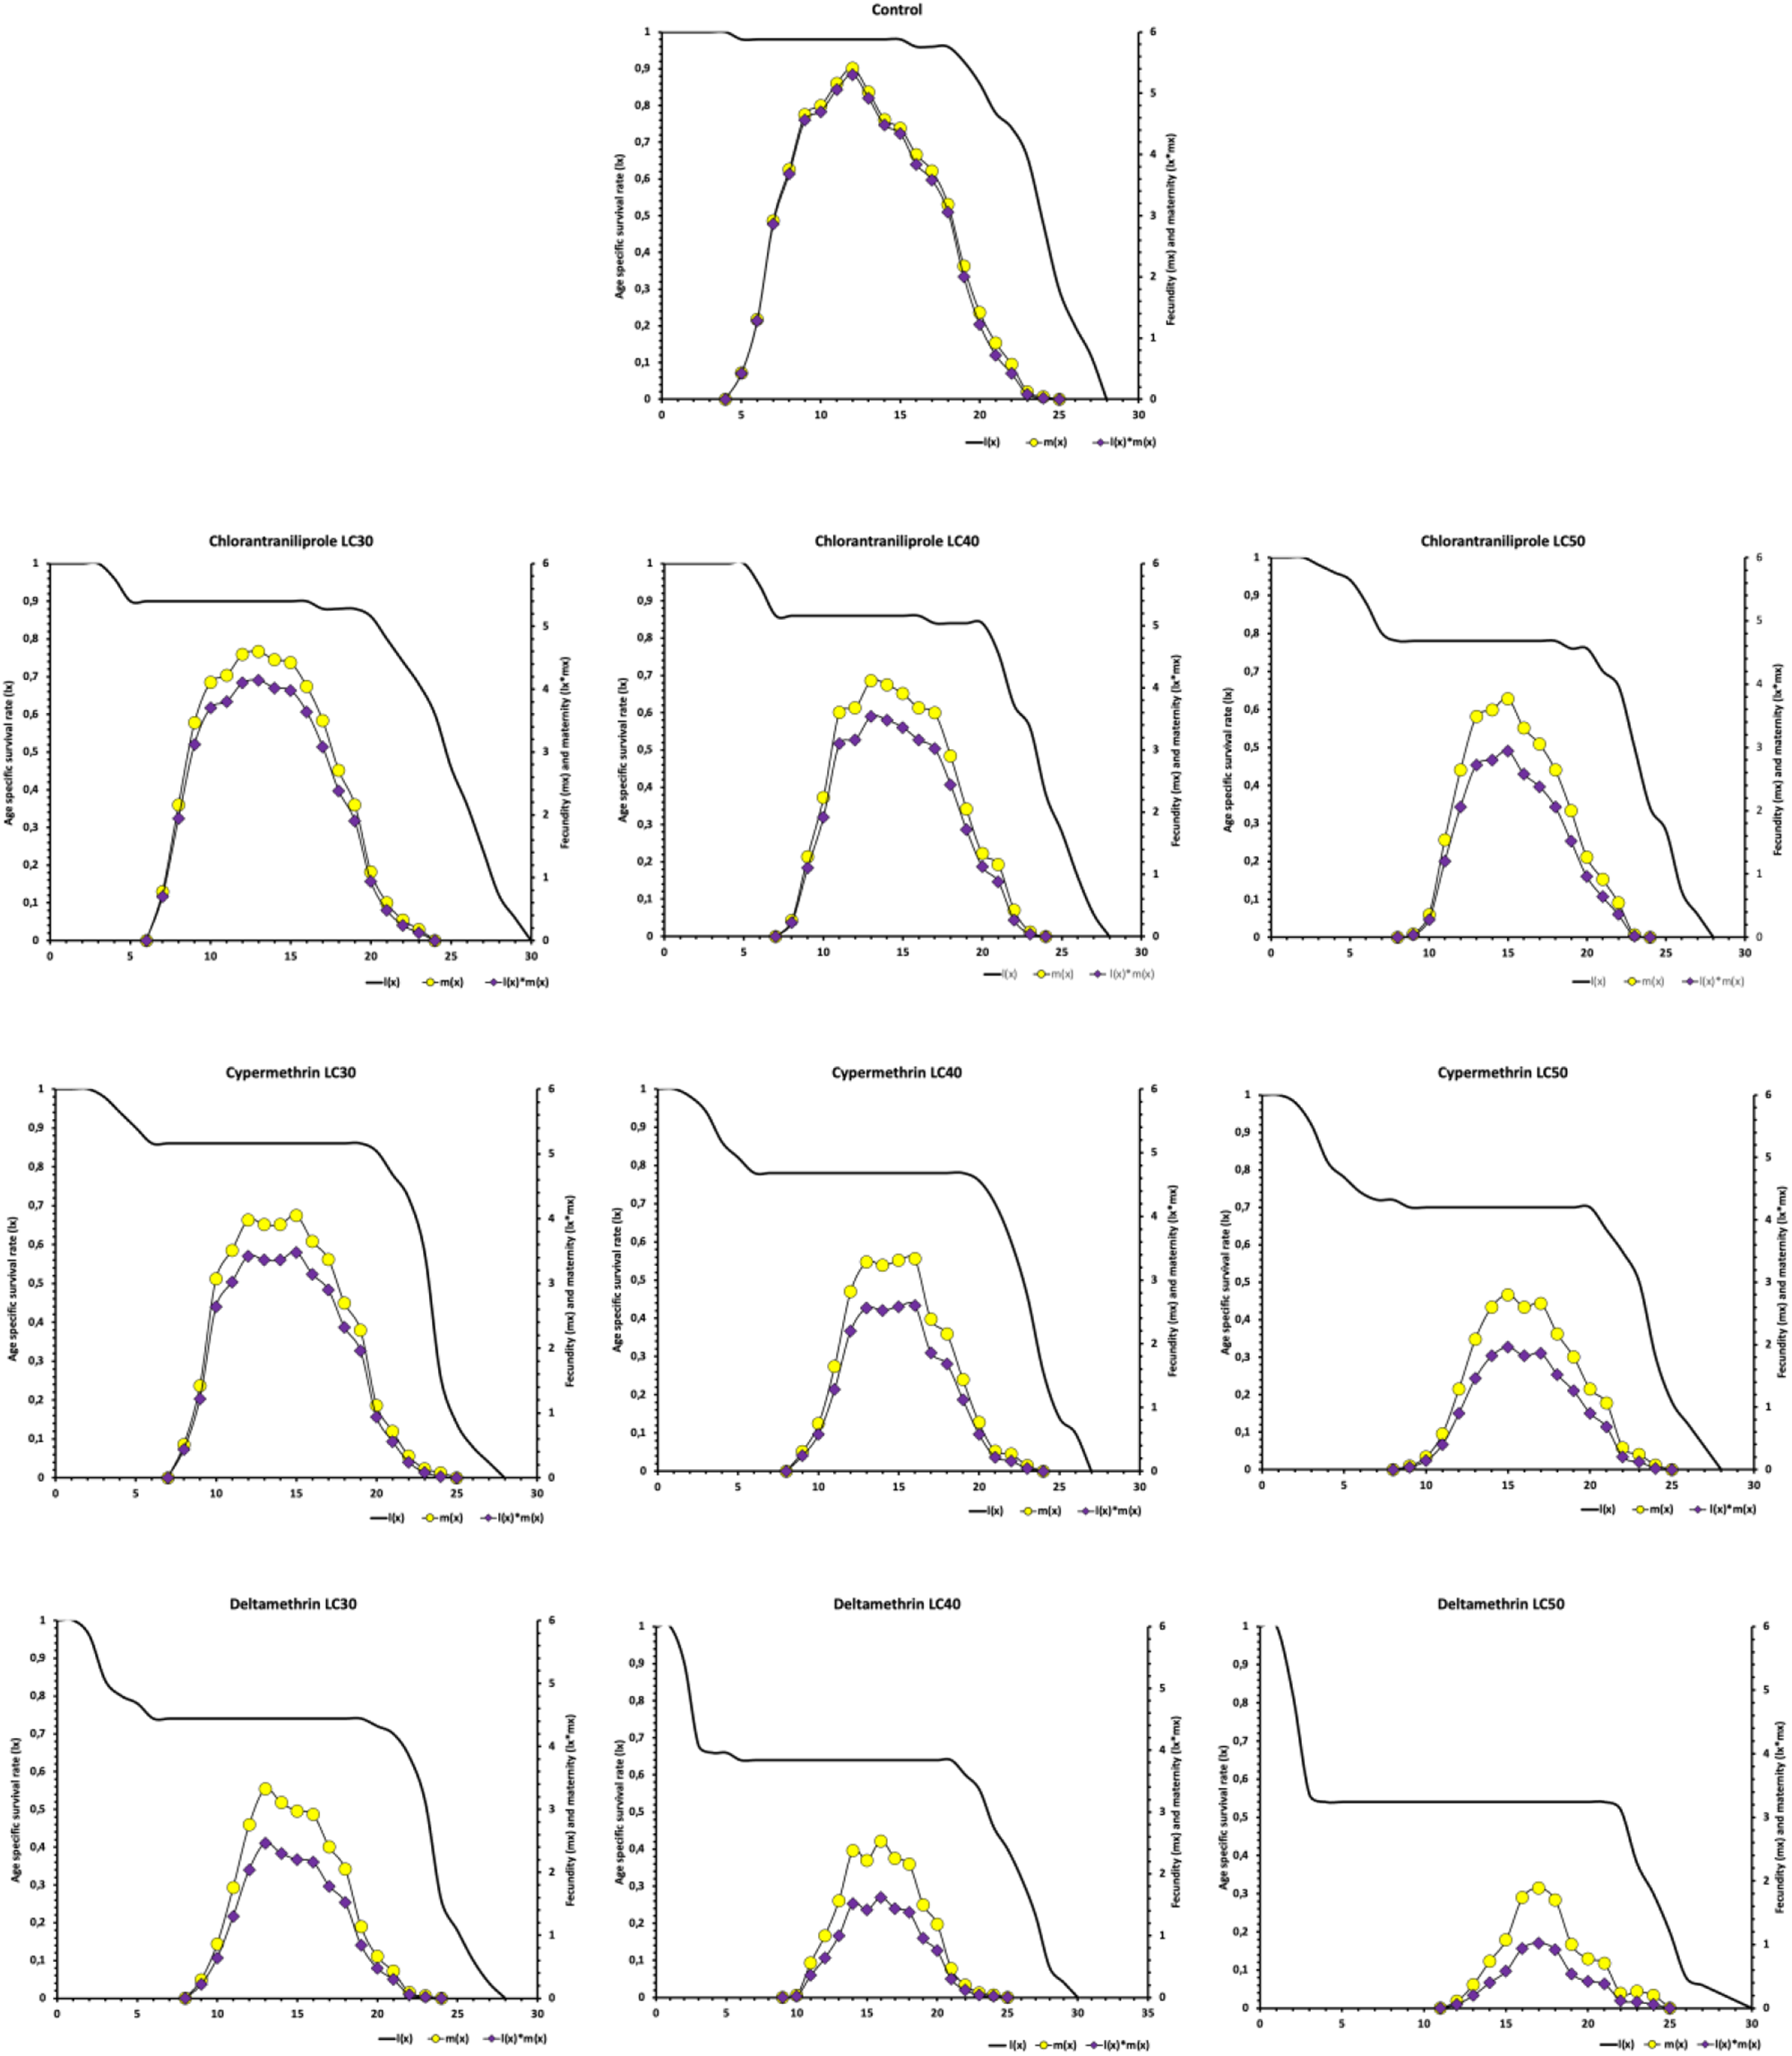
The effects of the tested insecticides on the age-specific survival rate (lx), age-specific fecundity (mx), and reproductive contribution (lx*mx) of R. padi are shown in Fig. 2. The results show that lx values were highest in the control group and declined progressively with increasing insecticide concentrations, with the most pronounced reductions observed at the LC₅₀ doses of all three compounds. A similar pattern was observed for mx and lx*mx, both of which reached their maximum levels in the control cohort and decreased gradually and consistently in response to higher insecticide exposure. While control individuals began reproducing on day four, insecticide-treated aphids showed a clear delay in the onset of reproduction, which shifted to between days 6 and 11 depending on the dose (Fig. 2).
Age-specific survival rate (lx), fecundity (mx), and maternity (lx*mx) of Rhopalosiphum padi exposed to different insecticides and their different doses.

Figure 2 Long description
The image A showing a line graph titled Control. The horizontal axis label is Age stage. The vertical axis label is Age stage survival rate. The horizontal axis range is 0 to 40. The vertical axis range is 0.0 to 1.0. A black line starts near 1.0 and stays near 1.0 until about age stage 30, then drops to near 0 by about age stage 40. Two point series form a hump-shaped curve: points rise from near 0 at about age stage 0 to a peak near 0.9 around age stage 15, then fall back toward 0 by about age stage 30. The image B showing a line graph titled Chlorantraniliprole LC10. The horizontal axis label is Age stage. The vertical axis label is Age stage survival rate. The horizontal axis range is 0 to 40. The vertical axis range is 0.0 to 1.0. A black line starts near 1.0, stays near 1.0 until about age stage 30, then drops to near 0 by about age stage 40. Two point series form a hump-shaped curve peaking around age stage 15 at about 0.8 to 0.9, then declining toward 0 by about age stage 30. The image C showing a line graph titled Chlorantraniliprole LC30. The horizontal axis label is Age stage. The vertical axis label is Age stage survival rate. The horizontal axis range is 0 to 40. The vertical axis range is 0.0 to 1.0. A black line starts near 1.0, stays near 1.0 until about age stage 30, then drops to near 0 by about age stage 40. Two point series form a hump-shaped curve peaking around age stage 15 at about 0.7 to 0.8, then declining toward 0 by about age stage 30. The image D showing a line graph titled Chlorantraniliprole LC50. The horizontal axis label is Age stage. The vertical axis label is Age stage survival rate. The horizontal axis range is 0 to 40. The vertical axis range is 0.0 to 1.0. A black line starts near 1.0, stays near 1.0 until about age stage 30, then drops to near 0 by about age stage 40. Two point series form a hump-shaped curve peaking around age stage 15 at about 0.6 to 0.7, then declining toward 0 by about age stage 30. The image E showing a line graph titled Cyantraniliprole LC10. The horizontal axis label is Age stage. The vertical axis label is Age stage survival rate. The horizontal axis range is 0 to 40. The vertical axis range is 0.0 to 1.0. A black line starts near 1.0, stays near 1.0 until about age stage 30, then drops to near 0 by about age stage 40. Two point series form a hump-shaped curve peaking around age stage 15 at about 0.7 to 0.8, then declining toward 0 by about age stage 30. The image F showing a line graph titled Cyantraniliprole LC30. The horizontal axis label is Age stage. The vertical axis label is Age stage survival rate. The horizontal axis range is 0 to 40. The vertical axis range is 0.0 to 1.0. A black line starts near 1.0, stays near 1.0 until about age stage 30, then drops to near 0 by about age stage 40. Two point series form a hump-shaped curve peaking around age stage 15 at about 0.6 to 0.7, then declining toward 0 by about age stage 30. The image G showing a line graph titled Cyantraniliprole LC50. The horizontal axis label is Age stage. The vertical axis label is Age stage survival rate. The horizontal axis range is 0 to 40. The vertical axis range is 0.0 to 1.0. A black line starts near 1.0, stays near 1.0 until about age stage 30, then drops to near 0 by about age stage 40. Two point series form a hump-shaped curve peaking around age stage 15 at about 0.5 to 0.6, then declining toward 0 by about age stage 30. The image H showing a line graph titled Deltamethrin LC10. The horizontal axis label is Age stage. The vertical axis label is Age stage survival rate. The horizontal axis range is 0 to 40. The vertical axis range is 0.0 to 1.0. A black line starts near 1.0, drops to a lower level near 0.8 early, stays near that level until about age stage 30, then drops to near 0 by about age stage 40. Two point series form a hump-shaped curve peaking around age stage 15 at about 0.5 to 0.6, then declining toward 0 by about age stage 30. The image I showing a line graph titled Deltamethrin LC30. The horizontal axis label is Age stage. The vertical axis label is Age stage survival rate. The horizontal axis range is 0 to 40. The vertical axis range is 0.0 to 1.0. A black line starts near 1.0, drops to a lower level near 0.8 early, stays near that level until about age stage 30, then drops to near 0 by about age stage 40. Two point series form a hump-shaped curve peaking around age stage 15 at about 0.4 to 0.5, then declining toward 0 by about age stage 30. The image J showing a line graph titled Deltamethrin LC50. The horizontal axis label is Age stage. The vertical axis label is Age stage survival rate. The horizontal axis range is 0 to 40. The vertical axis range is 0.0 to 1.0. A black line starts near 1.0, drops steeply early to a lower level near 0.6, stays near that level until about age stage 30, then drops to near 0 by about age stage 40. Two point series form a smaller hump-shaped curve peaking around age stage 15 at about 0.2 to 0.3, then declining toward 0 by about age stage 30.
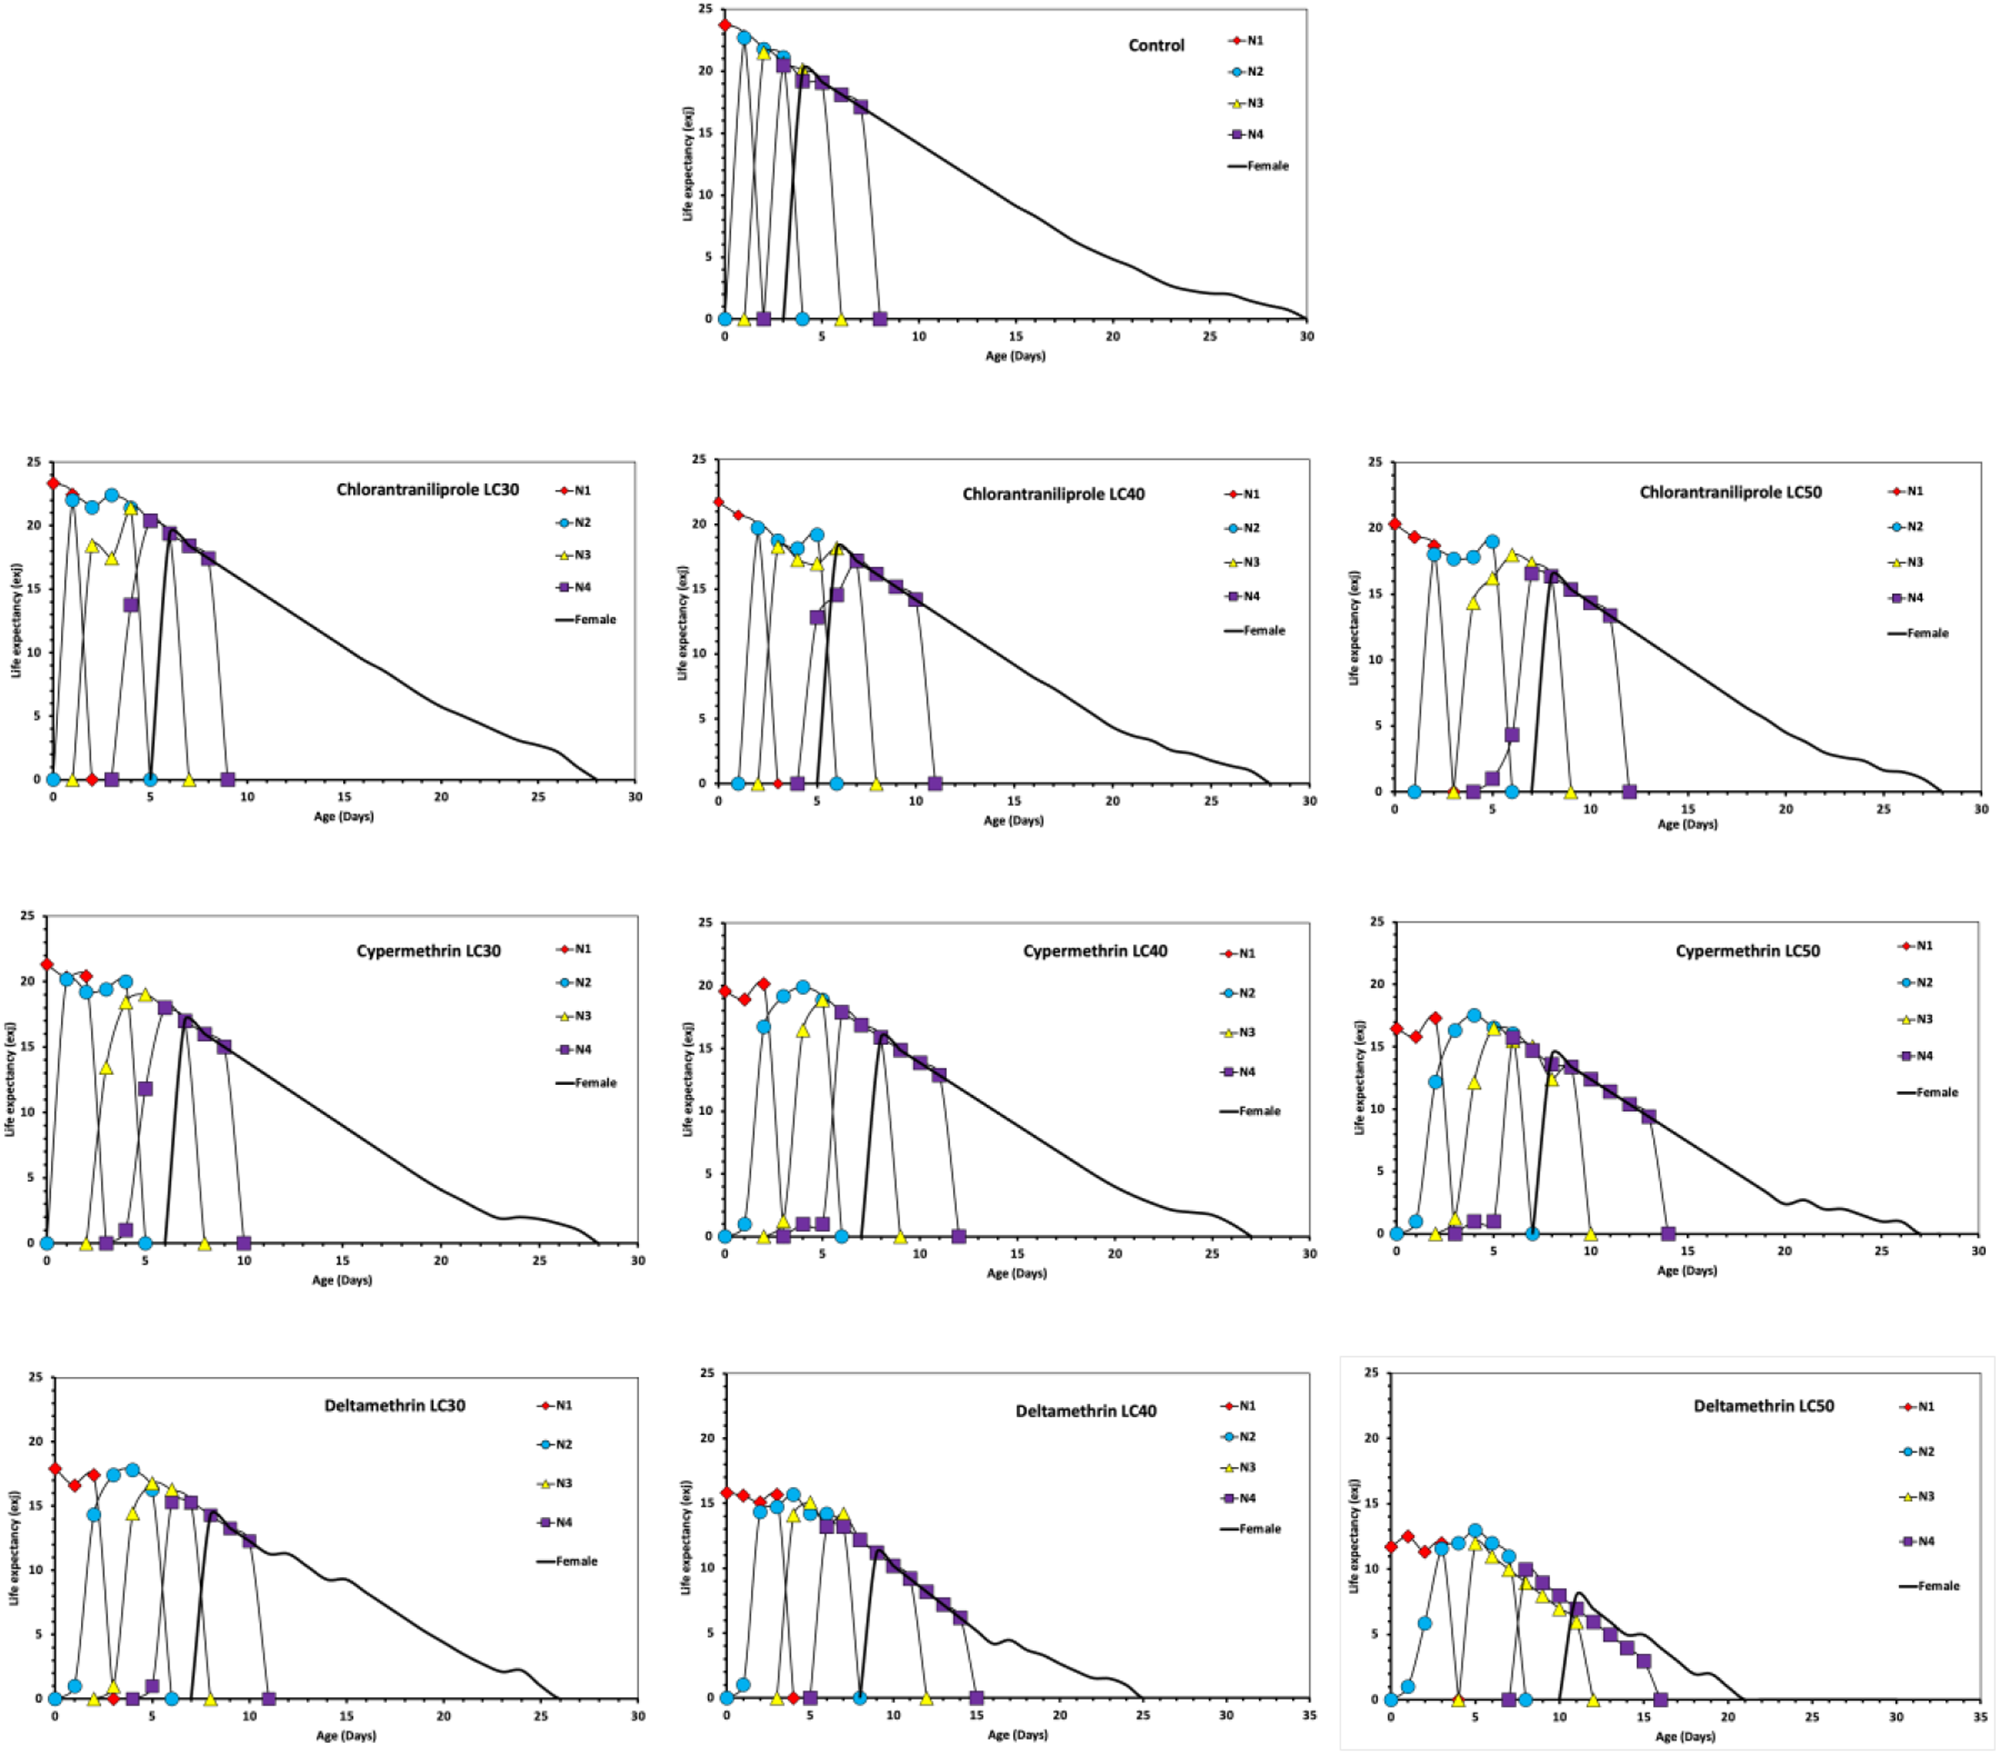
The influence of insecticidal treatments on the age-stage life expectancy (exj) of R. padi is shown in Fig. 3. According to Yang and Chi (Reference Yang and Chi2006), life expectancy is the mean duration an individual is predicted to survive under specific environmental conditions. In this study, the highest exj values were consistently observed for newly emerged individuals in the control group, while all insecticidal exposures resulted in a marked decline in expected lifespan. The data indicate that increasing concentrations generally accelerated the reduction in life expectancy, with the most pronounced decreases occurring at high-dose applications. Furthermore, the extent of this reduction varied among insecticides, indicating compound-specific effects on longevity (Fig. 3).
The age-stage life expectancy (exj) of Rhopalosiphum padi exposed to different insecticides and their different doses.

Figure 3 Long description
The composite image contains ten line graphs arranged in rows. Each graph plots age in days on the x-axis and life expectancy in days on the y-axis. Multiple series appear in each graph, each represented by a distinct marker shape, corresponding to different life stages as listed in the legend. The legend entries visible across panels are labeled N1, N2, N3, N4 and Female. The ten graphs are described individually below. Graph 1 is titled Control. The x-axis runs from 0 to approximately 30 days. The y-axis runs from 0 to approximately 30 days. The curve for newly emerged individuals starts at the highest life expectancy value near 30 days and declines gradually as age increases, approaching zero near age 30. Other stage-specific curves peak at lower values and decline more steeply. Graph 2 is titled Chlorantraniliprole LC10. Life expectancy values at age zero are visibly lower than in the control. Stage-specific curves peak earlier and decline more sharply, approaching zero before age 25. Graph 3 is titled Chlorantraniliprole LC30. The starting life expectancy is further reduced compared to LC10. Curves for all stages decline steeply, with most approaching zero before age 20. Graph 4 is titled Chlorantraniliprole LC50. The steepest decline among the three Chlorantraniliprole doses is visible. Stage curves approach zero earliest, near age 15 to 18. Graph 5 is titled Cypermethrin LC10. Life expectancy at age zero is reduced compared to the control. Stage curves show a marked decline, approaching zero near age 20 to 22. Graph 6 is titled Cypermethrin LC30. A more pronounced decline is visible compared to LC10. Most stage curves approach zero before age 18. Graph 7 is titled Cypermethrin LC50. The sharpest decline among Cypermethrin doses. Stage curves approach zero near age 12 to 15. Graph 8 is titled Deltamethrin LC10. Life expectancy values at age zero are reduced relative to control. Stage curves decline and approach zero near age 20 to 22. Graph 9 is titled Deltamethrin LC30. A steeper decline compared to LC10. Stage curves approach zero before age 18. Graph 10 is titled Deltamethrin LC50. The steepest decline among Deltamethrin doses. Stage curves approach zero near age 12 to 15. Across all ten graphs, the control group consistently shows the highest starting life expectancy and the most gradual decline. Each insecticide dose series shows progressively lower starting values and earlier approach to zero as dose increases from LC10 to LC50.
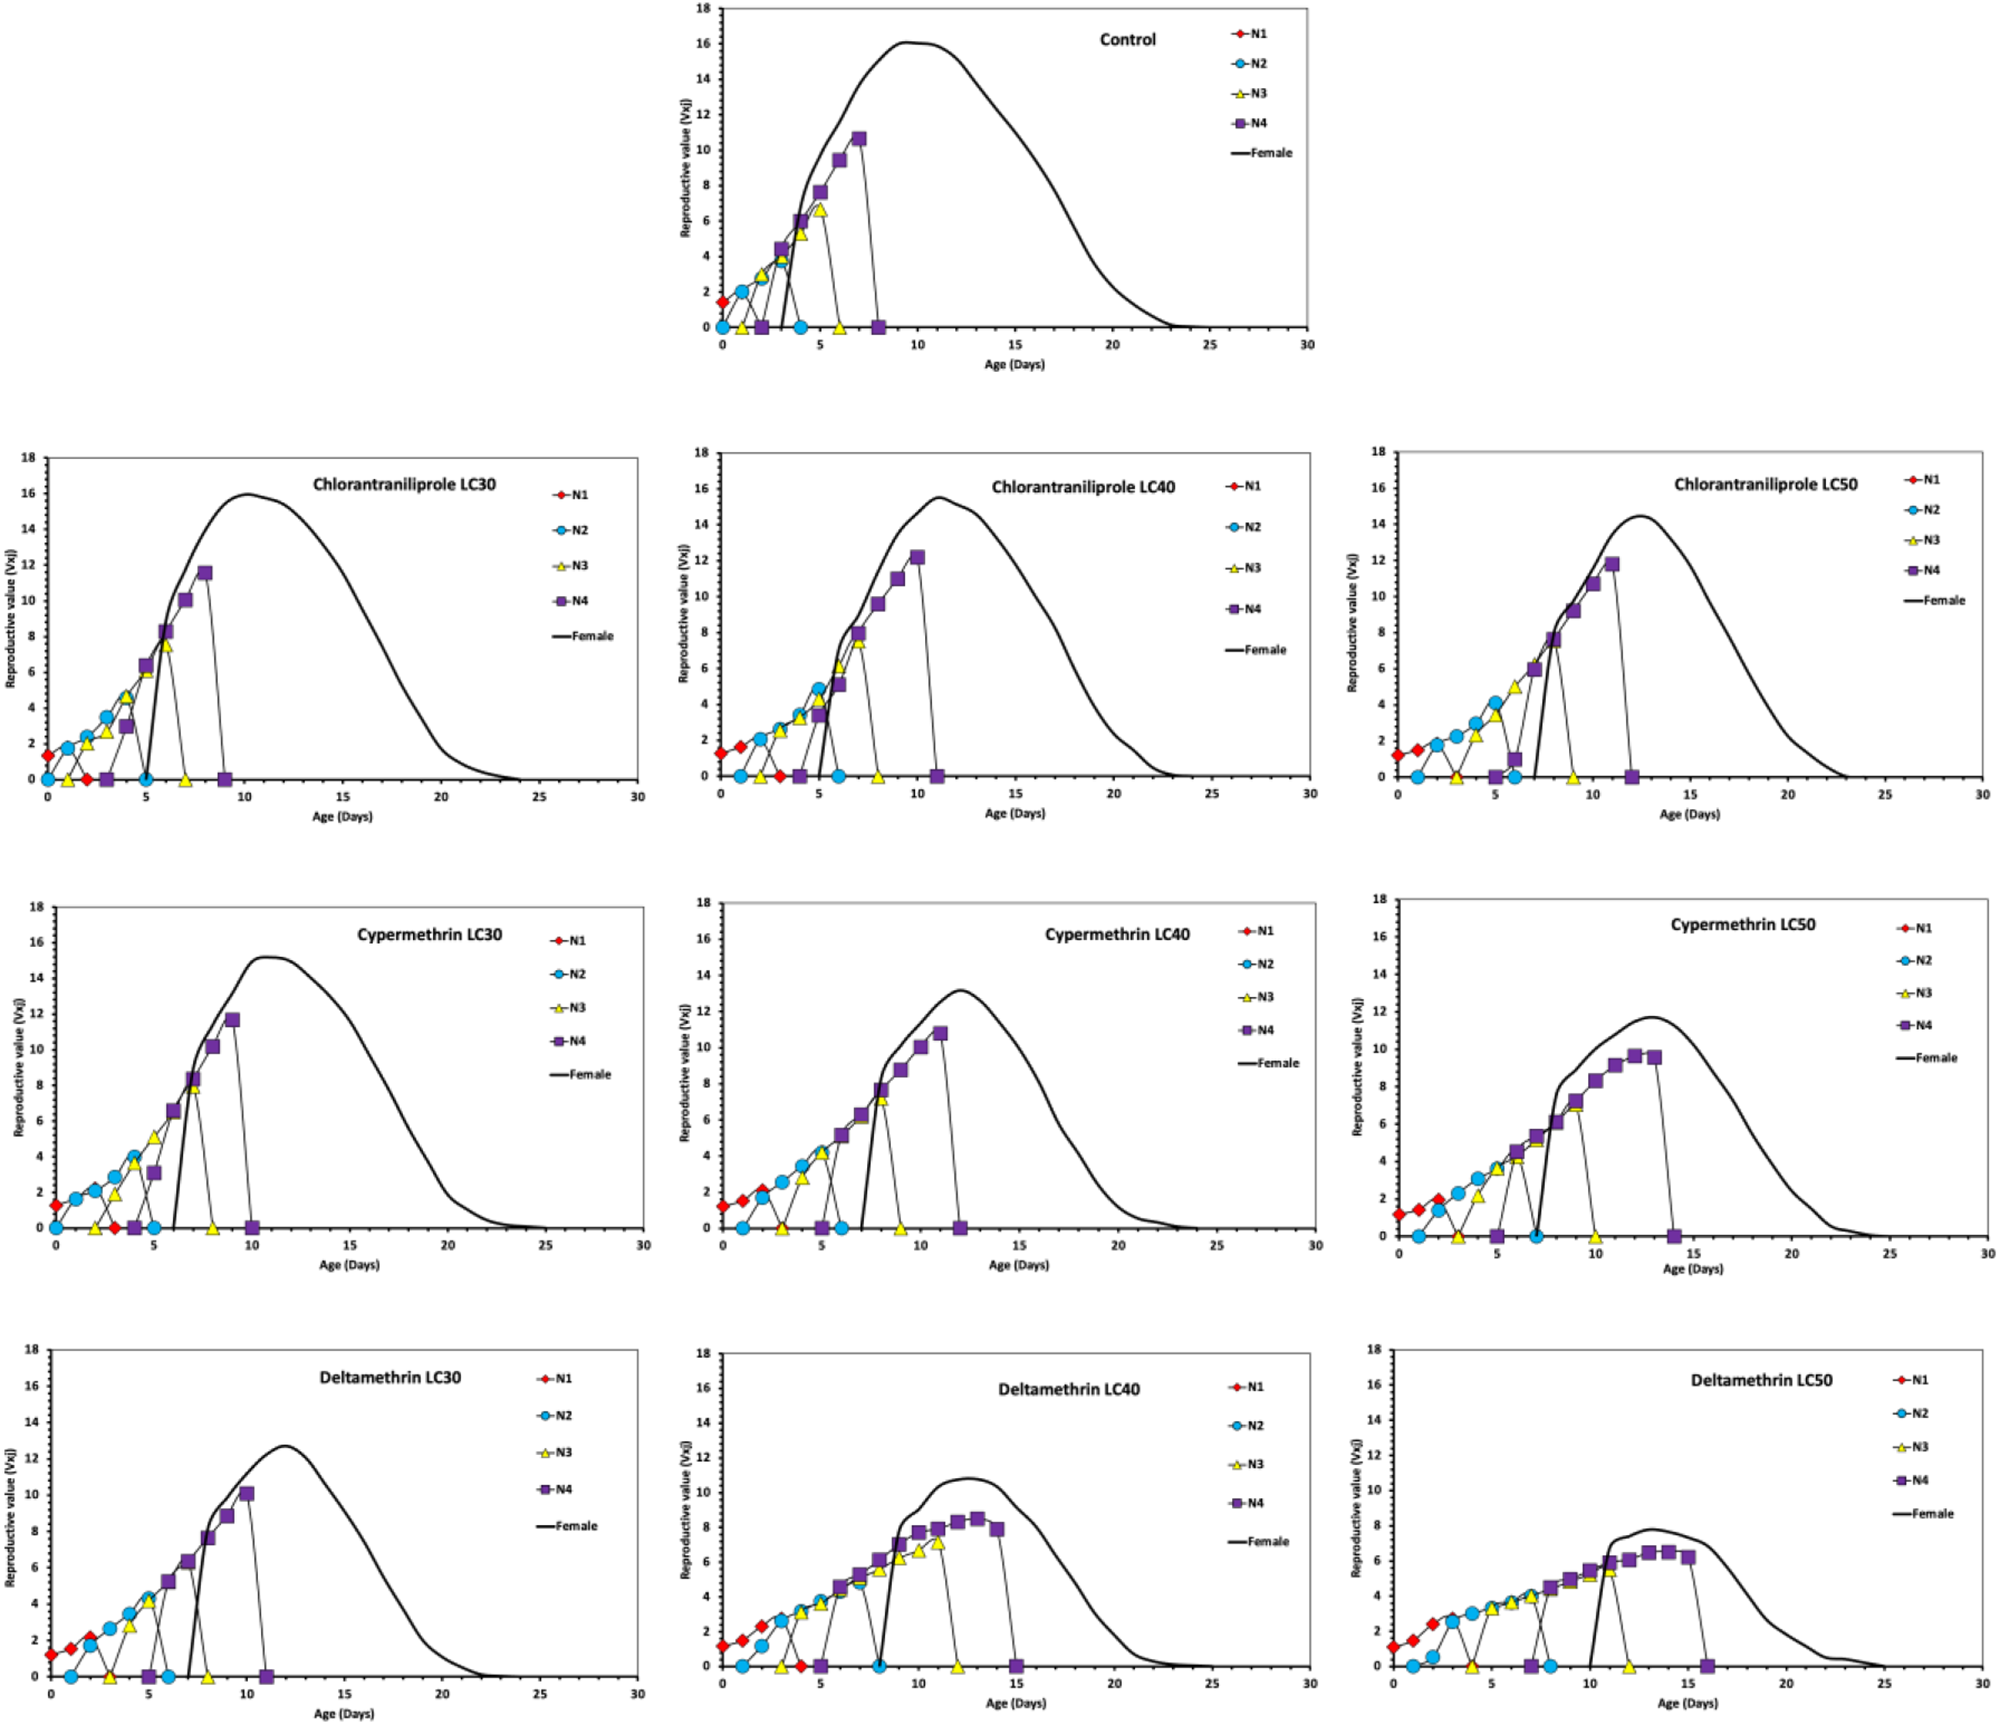
The effects of the insecticidal treatments on the reproductive value (vxj) of R. padi are shown in Fig. 4. According to Fisher (Reference Fisher1930), reproductive value is a quantitative estimate of an individual’s expected contribution to future generations. Within the framework of the Age–Stage, Two-Sex Life Table Theory proposed by Chi (Reference Chi1988), age- and stage-specific reproductive value (vxj) describes the potential impact of an individual at a given age (x) and developmental stage (j) on subsequent population growth. The results showed that vxj peaked during the adult female stage in both the control and insecticide treatments. In the control cohort, the maximum reproductive value was recorded on day 10, with a value of 16.02. Under chlorantraniliprole exposure, the highest vxj values for LC₃₀, LC₄₀, and LC₅₀ doses were observed on day 11 (15.94), day 14 (15.50), and day 12 (14.37), respectively. For cypermethrin, the corresponding peaks were detected on day 11 (15.19), day 12 (13.15), and day 13 (11.70). In deltamethrin-treated populations, LC₃₀, LC₄₀, and LC₅₀ levels yielded maximum reproductive values of 12.70 (day 12), 10.77 (day 13), and 7.77 (day 13). These findings indicate that reproductive value in R. padi shows clear temporal and quantitative changes in response to insecticidal stress (Fig. 4).
Reproductive value (Vxj) of Rhopalosiphum padi exposed to different insecticides and their different doses.

Figure 4 Long description
The image A showing a line graph titled Control. The horizontal axis label is Age (Day). The vertical axis label is Reproductive value. The horizontal axis shows 0, 10, 20, 30, 40, 50, 60. The vertical axis shows 0, 2, 4, 6, 8, 10, 12, 14, 16. A smooth curve rises from near 0 at age 0 to a peak near 16 around age 10, then declines toward 0 by about age 50 to 60. Multiple marker series are plotted near ages 0 to about 15, with several vertical line segments dropping to 0 at specific ages. The image B showing a line graph titled Chlorantraniliprole LC30. The horizontal axis label is Age (Day). The vertical axis label is Reproductive value. The horizontal axis shows 0, 10, 20, 30, 40, 50, 60. The vertical axis shows 0, 2, 4, 6, 8, 10, 12, 14, 16. A smooth curve rises to a peak near 16 around age 10 to 12, then declines toward 0 by about age 50 to 60. Multiple marker series are plotted from near age 0 to about age 20, with several vertical line segments dropping to 0 at specific ages. The image C showing a line graph titled Chlorantraniliprole LC40. The horizontal axis label is Age (Day). The vertical axis label is Reproductive value. The horizontal axis shows 0, 10, 20, 30, 40, 50, 60. The vertical axis shows 0, 2, 4, 6, 8, 10, 12, 14, 16. A smooth curve rises to a peak near 16 around age 10 to 15, then declines toward 0 by about age 50 to 60. Multiple marker series are plotted from near age 0 to about age 25, with several vertical line segments dropping to 0 at specific ages. The image D showing a line graph titled Chlorantraniliprole LC50. The horizontal axis label is Age (Day). The vertical axis label is Reproductive value. The horizontal axis shows 0, 10, 20, 30, 40, 50, 60. The vertical axis shows 0, 2, 4, 6, 8, 10, 12, 14, 16. A smooth curve rises to a peak near 16 around age 10 to 15, then declines toward 0 by about age 50 to 60. Multiple marker series are plotted from near age 0 to about age 25, with several vertical line segments dropping to 0 at specific ages. The image E showing a line graph titled Cypermethrin LC30. The horizontal axis label is Age (Day). The vertical axis label is Reproductive value. The horizontal axis shows 0, 10, 20, 30, 40, 50, 60. The vertical axis shows 0, 2, 4, 6, 8, 10, 12, 14, 16. A smooth curve rises to a peak near 16 around age 10 to 12, then declines toward 0 by about age 50 to 60. Multiple marker series are plotted from near age 0 to about age 25, with several vertical line segments dropping to 0 at specific ages. The image F showing a line graph titled Cypermethrin LC40. The horizontal axis label is Age (Day). The vertical axis label is Reproductive value. The horizontal axis shows 0, 10, 20, 30, 40, 50, 60. The vertical axis shows 0, 2, 4, 6, 8, 10, 12, 14, 16. A smooth curve rises to a peak near 16 around age 10 to 15, then declines toward 0 by about age 50 to 60. Multiple marker series are plotted from near age 0 to about age 30, with several vertical line segments dropping to 0 at specific ages. The image G showing a line graph titled Cypermethrin LC50. The horizontal axis label is Age (Day). The vertical axis label is Reproductive value. The horizontal axis shows 0, 10, 20, 30, 40, 50, 60. The vertical axis shows 0, 2, 4, 6, 8, 10, 12, 14, 16. A smooth curve rises to a peak near 16 around age 10 to 20, then declines toward 0 by about age 50 to 60. Multiple marker series are plotted from near age 0 to about age 35, with several vertical line segments dropping to 0 at specific ages. The image H showing a line graph titled Deltamethrin LC30. The horizontal axis label is Age (Day). The vertical axis label is Reproductive value. The horizontal axis shows 0, 10, 20, 30, 40, 50, 60. The vertical axis shows 0, 2, 4, 6, 8, 10, 12, 14, 16. A smooth curve rises to a peak near 12 to 14 around age 10 to 15, then declines toward 0 by about age 50 to 60. Multiple marker series are plotted from near age 0 to about age 35, with several vertical line segments dropping to 0 at specific ages. The image I showing a line graph titled Deltamethrin LC40. The horizontal axis label is Age (Day). The vertical axis label is Reproductive value. The horizontal axis shows 0, 10, 20, 30, 40, 50, 60. The vertical axis shows 0, 2, 4, 6, 8, 10, 12, 14, 16. A smooth curve rises to a peak near 10 to 12 around age 10 to 20, then declines toward 0 by about age 50 to 60. Multiple marker series are plotted from near age 0 to about age 40, with several vertical line segments dropping to 0 at specific ages.
Life table parameters
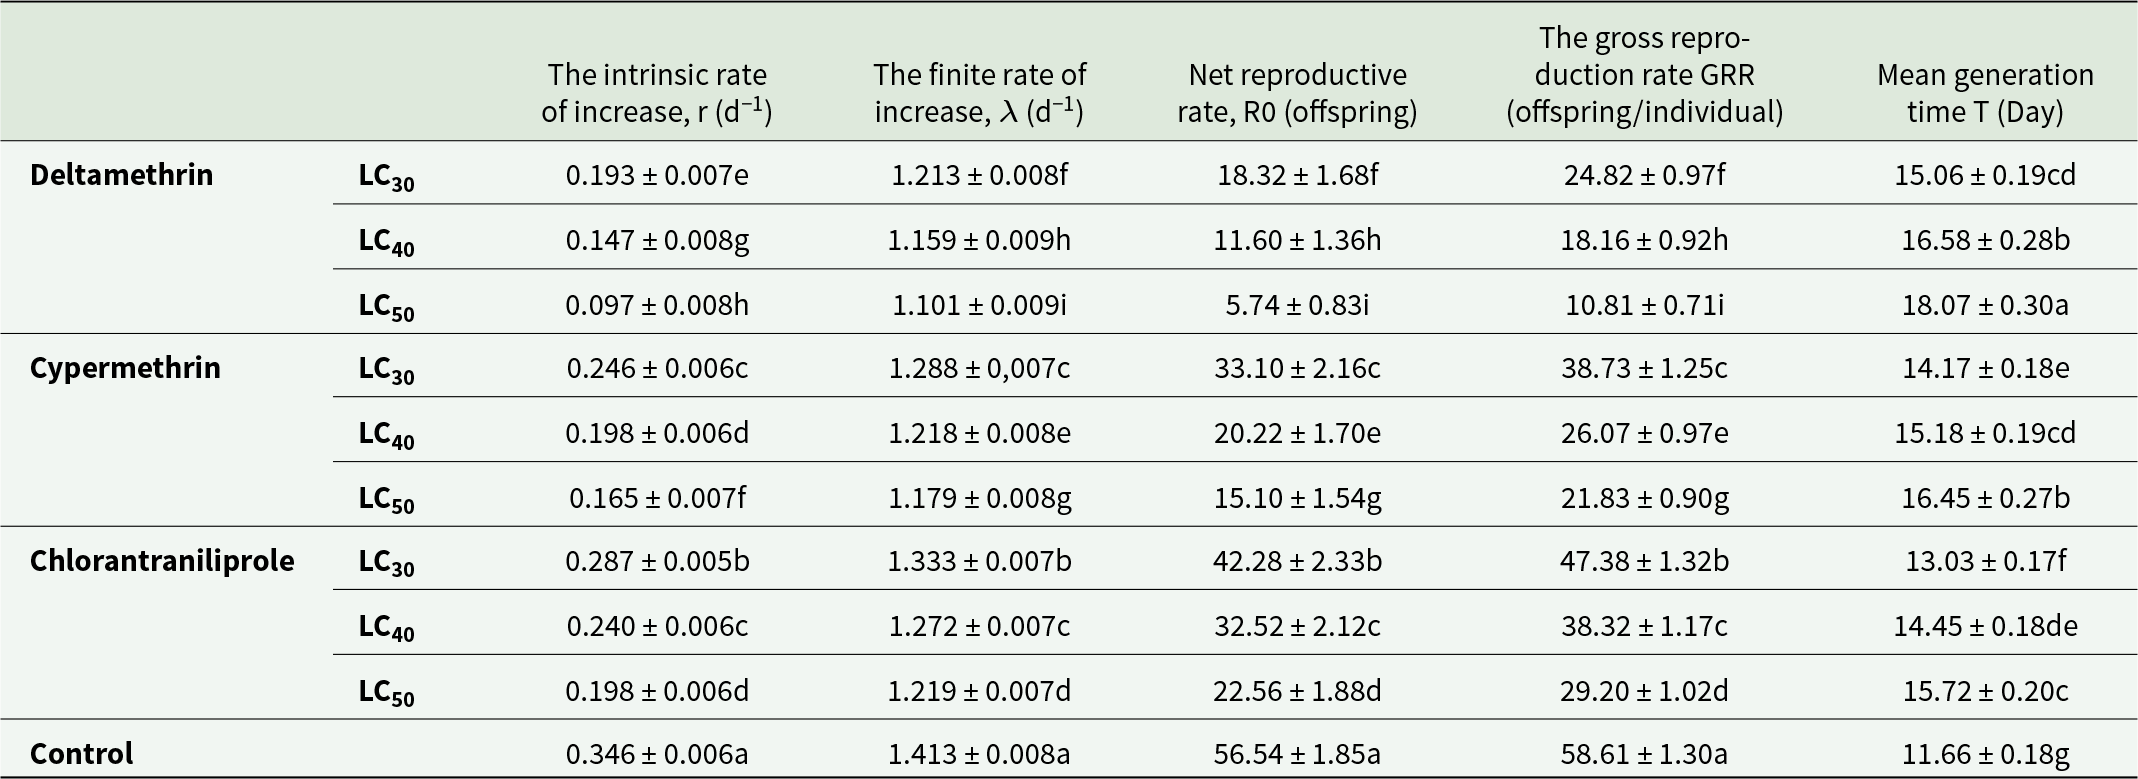
Life-table analyses further confirmed that all three insecticides significantly suppressed the population growth potential of R. padi. The control population showed an intrinsic rate of increase (r) of 0.346, a net reproductive rate (R₀) of 56.54, and a finite rate of increase (λ) of 1.413, indicating rapid population expansion under untreated conditions. In contrast, deltamethrin LC50 sharply reduced these parameters to r = 0.097, R₀ = 5.74, and λ = 1.101, representing the strongest inhibitory effect among the tested compounds. Cypermethrin LC50 produced intermediate suppression (r = 0.165, R₀ = 15.10, λ = 1.179), while chlorantraniliprole LC50 had the weakest impact (r = 0.198, R₀ = 22.56, λ = 1.219). Mean generation time (T) also increased significantly, rising from 11.66 days in the control to 18.07 days under deltamethrin LC50, reflecting a clear slowdown in generational turnover. Overall, these results show that population suppression occurred through a dual mechanism: reduced reproductive output and prolonged generation time, ultimately limiting the species’ ability to sustain rapid population growth (Table 5).
The life table parameters of Rhopalosiphum padi on different insecticides (Deltamethrin, Cypermethrin and Chrolarantraniliprole) and their different doses (LC30, LC40, LC50) (mean±SE)

Table 5 Long description
The table reports life table parameters for the bird cherry oat aphid under three insecticides at LC30, LC40, and LC50, compared with an untreated control, giving means with standard errors. Outcomes include intrinsic and finite rates of increase, net and gross reproduction, and mean generation time. The control had the highest population growth and reproduction (r 0.346, lambda 1.413, R0 56.54, GRR 58.61) and the shortest generation time (11.66 days). For each insecticide, increasing dose generally lowered r, lambda, R0, and GRR, while increasing mean generation time. Deltamethrin showed the strongest suppression at LC50, with the lowest r (0.097), lowest lambda (1.101), lowest R0 (5.74), lowest GRR (10.81), and the longest generation time (18.07 days). At comparable doses, chlorantraniliprole tended to retain higher growth and reproduction than cypermethrin and deltamethrin (for example at LC30, r 0.287 and R0 42.28), while cypermethrin was intermediate (LC30 r 0.246, R0 33.10). Letter groupings indicate statistically significant differences among means within each column, so comparisons should follow those group labels rather than small numeric gaps.
* Standard errors were calculated using the bootstrap method with 100000 repeats.
* The differences between the mean signed in the same column with the different letters are significant according to bootstrap method (100000 times) p < 0.05.
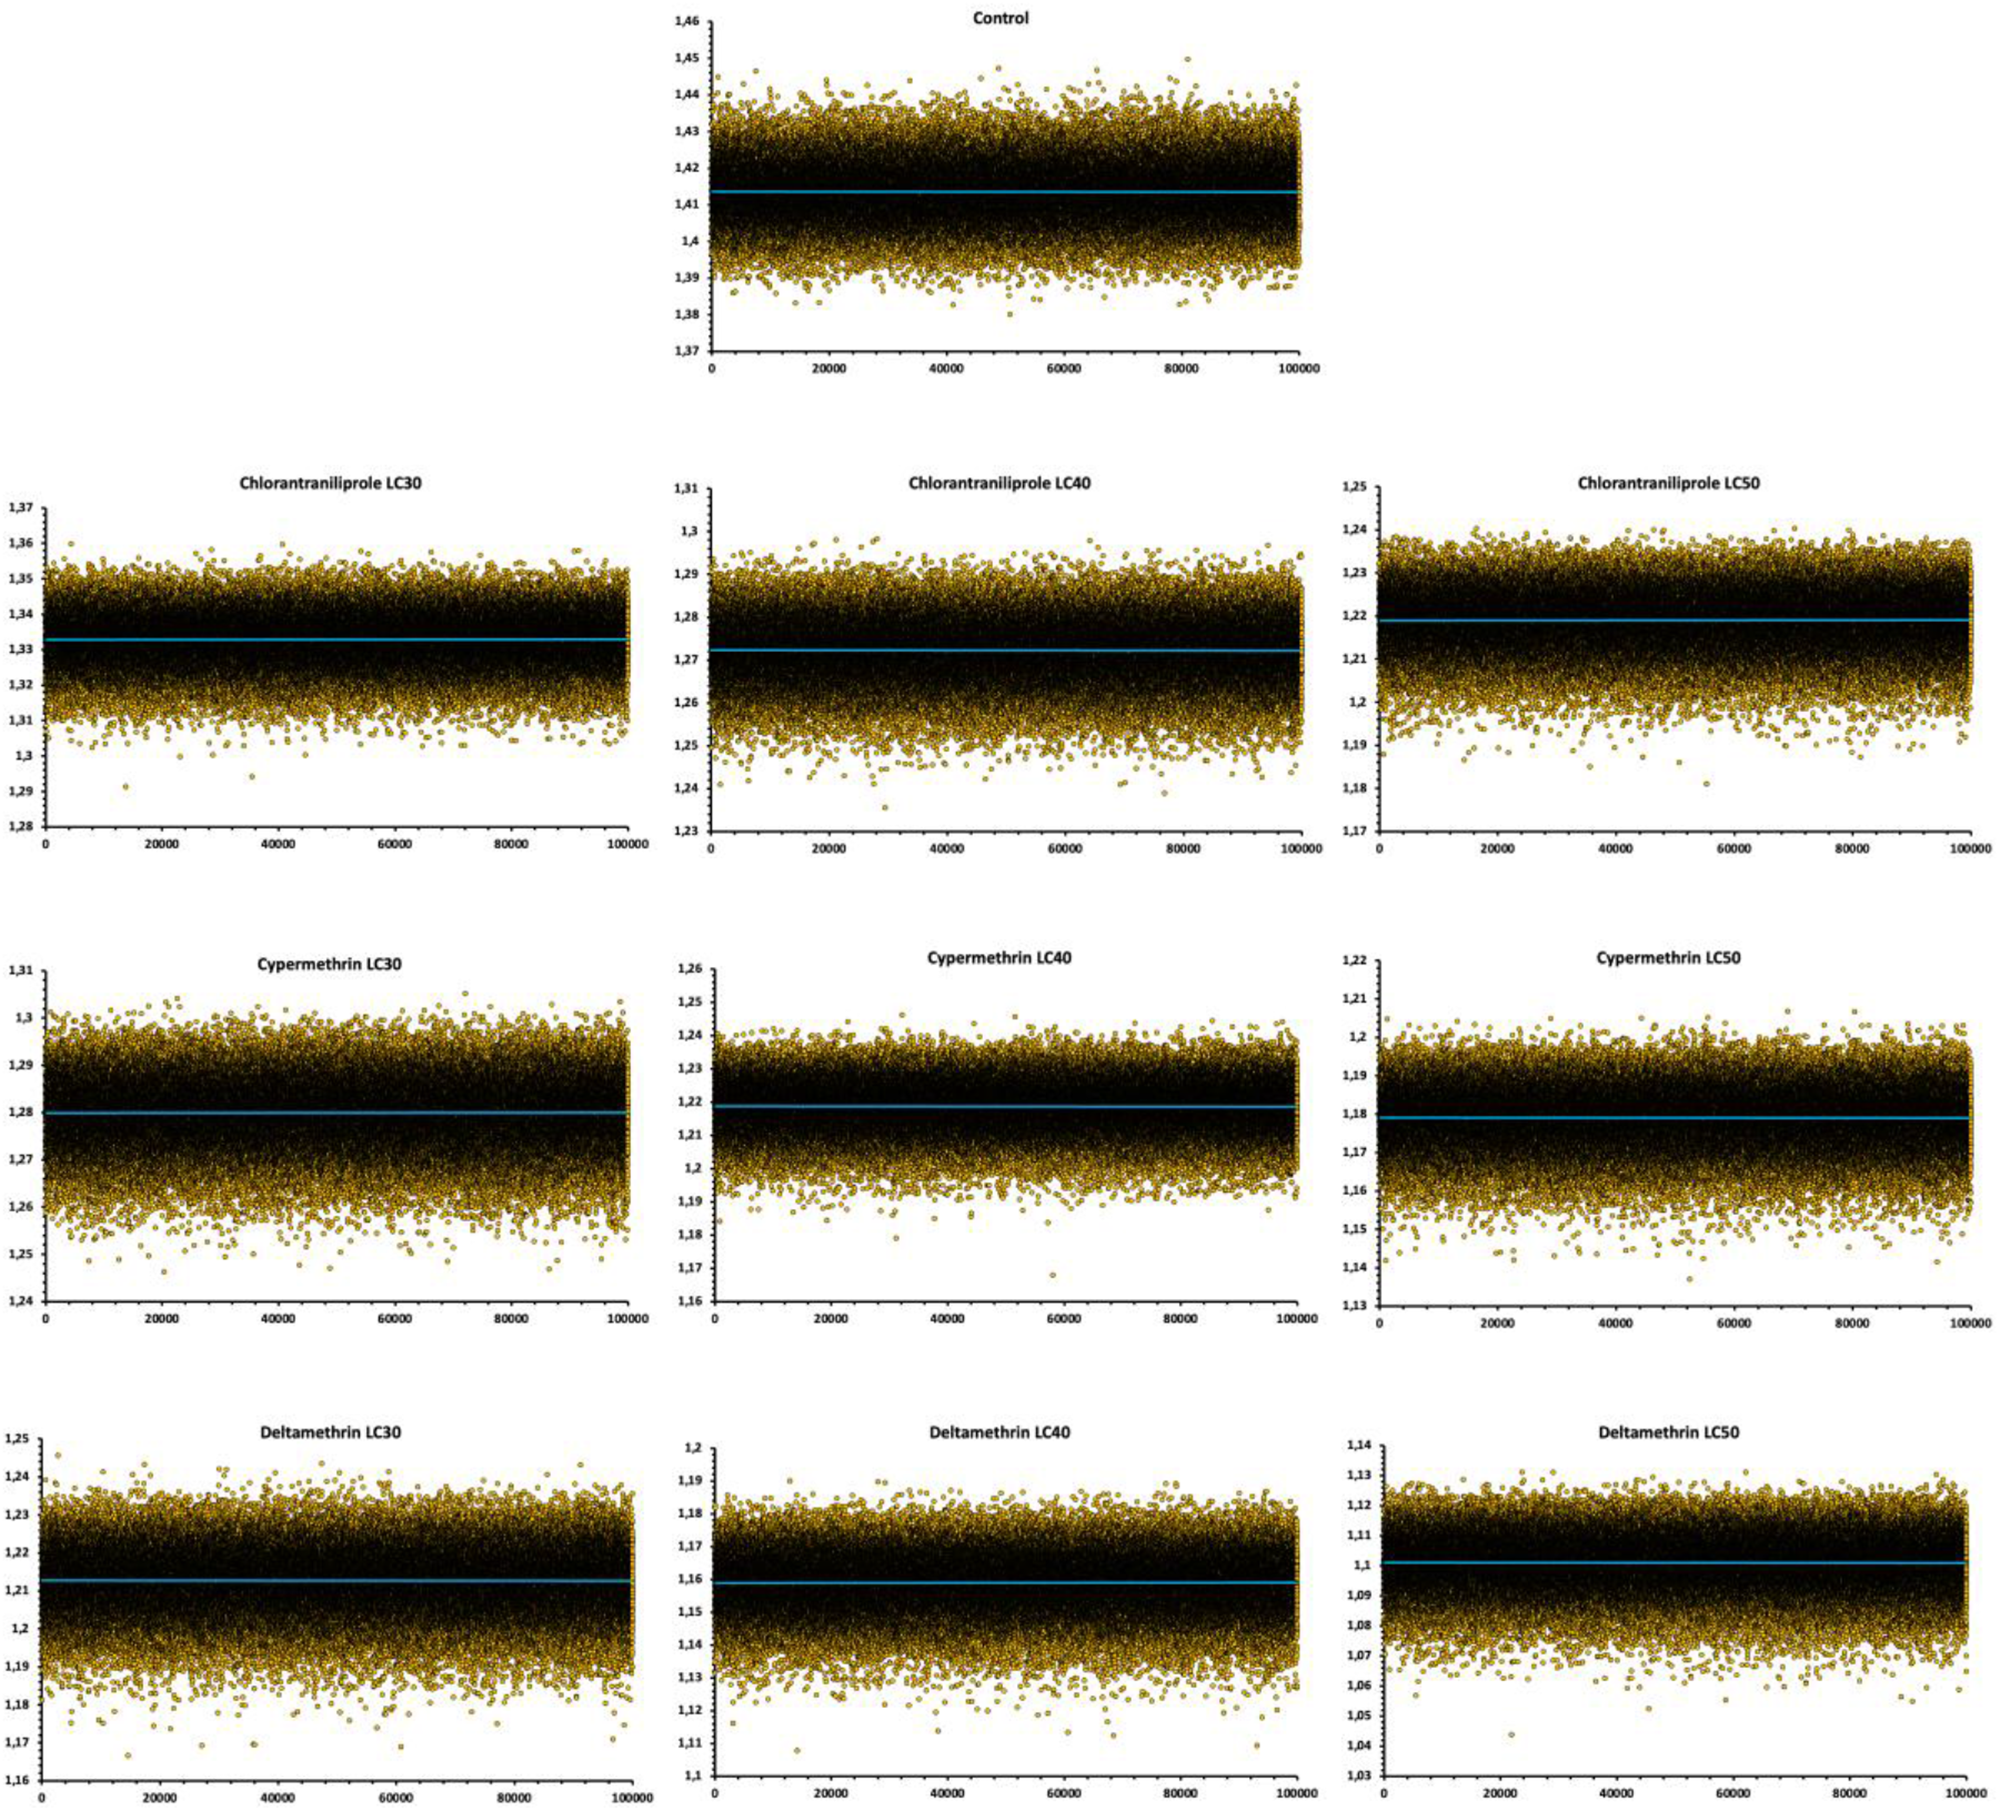
Exposure of R. padi individuals to different concentrations (LC₃₀, LC₄₀, and LC₅₀) of the insecticides Deltamethrin, Cypermethrin, and Chlorantraniliprole resulted in significant alterations in the finite rate of increase (λ). These changes were attributed to variations in developmental time, longevity, and reproductive performance among treatments. The λ estimates were generated using a bootstrap resampling procedure with 100000 iterations (Fig. 5). Application of the replacement-based bootstrap random sampling approach introduced stochastic variation in the estimated λ values around their respective means (Özgökçe et al., Reference Özgökçe, Chi, Atlıhan and Kara2018a, Reference Özgökçe, Chi, Atlıhan and Kara2018b, Reference Özgökçe, Kına and Kara2018c; Kanle Satishchandra et al., Reference Kanle Satishchandra, Chakravarthy, Özgökçe and Atlıhan2019).
The finite rates (λ) of 100000 bootstrap samples, arranged according to the original bootstrap procedure (x-axis), represent Rhopalosiphum padi exposed to different insecticides and their respective doses. These bootstrap-derived finite rates exhibit random fluctuations around the mean.

Figure 5 Long description
The image contains ten scatter plots arranged in rows. Each plot shares the same axis structure. The x-axis is labeled with bootstrap sample order ranging from 0 to 100000. The y-axis is labeled with lambda values ranging from approximately 1.17 to 1.47. A horizontal reference line runs across each plot at the approximate mean lambda value. Data points are densely packed and scattered around this reference line across all plots. Most data points fall within the approximate range of 1.27 to 1.37 across all panels. All ten panels share the same axis scales, allowing direct visual comparison. The ten panels are as follows. The first panel is titled Control. Data points scatter closely around the reference line with relatively narrow spread. The second panel is titled Chlorantraniliprole LC30. Data points scatter around the reference line with spread similar to the control. The third panel is titled Chlorantraniliprole LC40. The spread of data points around the reference line appears slightly wider than in the LC30 panel. The fourth panel is titled Chlorantraniliprole LC50. The reference line appears positioned slightly higher than in the LC30 and LC40 panels, with visible spread in data points. The fifth panel is titled Cypermethrin LC30. Data points are distributed around the reference line with spread comparable to the control. The sixth panel is titled Cypermethrin LC40. The spread of data points around the reference line is visible and similar to Cypermethrin LC30. The seventh panel is titled Cypermethrin LC50. The reference line is positioned visibly higher relative to the other Cypermethrin panels, with data points spread around it. The eighth panel is titled Deltamethrin LC30. Data points scatter around the reference line with spread similar to the control. The ninth panel is titled Deltamethrin LC40. The spread of data points around the reference line is comparable to Deltamethrin LC30. The tenth panel is titled Deltamethrin LC50. Data points scatter around the reference line with spread similar to the other Deltamethrin panels. Across all ten panels, data points are densely packed and the reference line remains the central visual anchor in each plot.
Modelling population trends of Rhopalosiphum padi under insecticidal stress
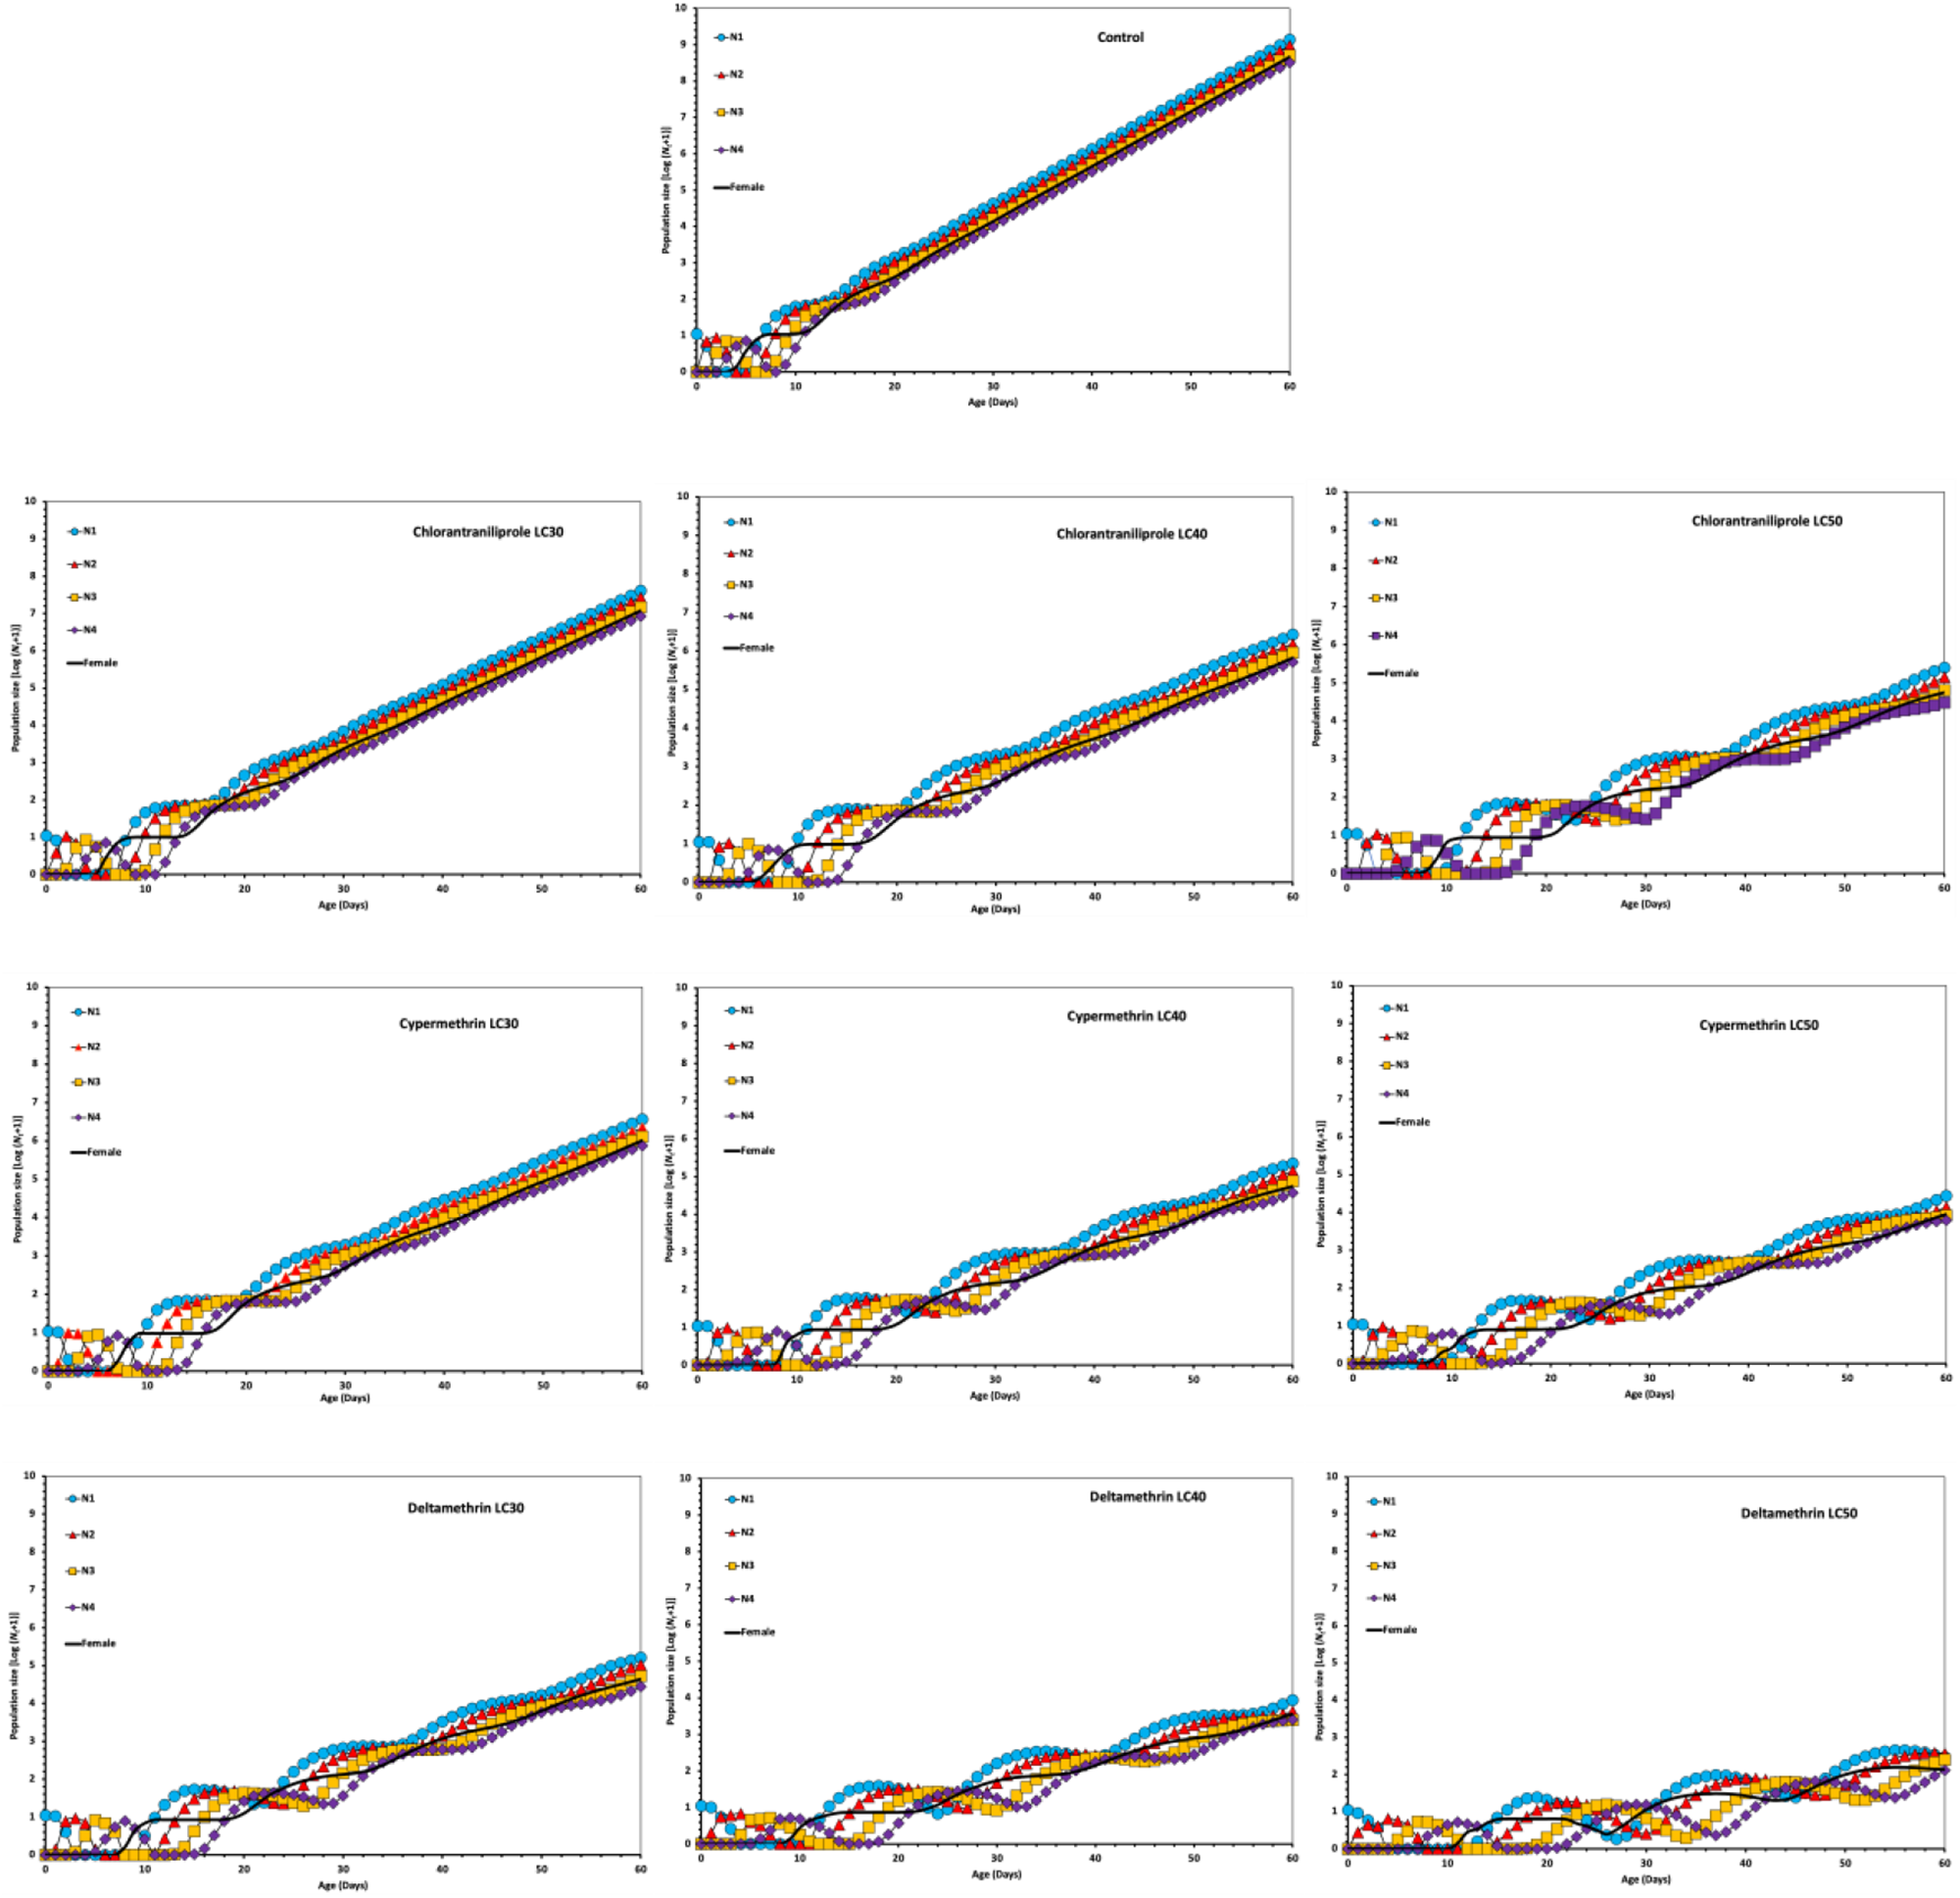
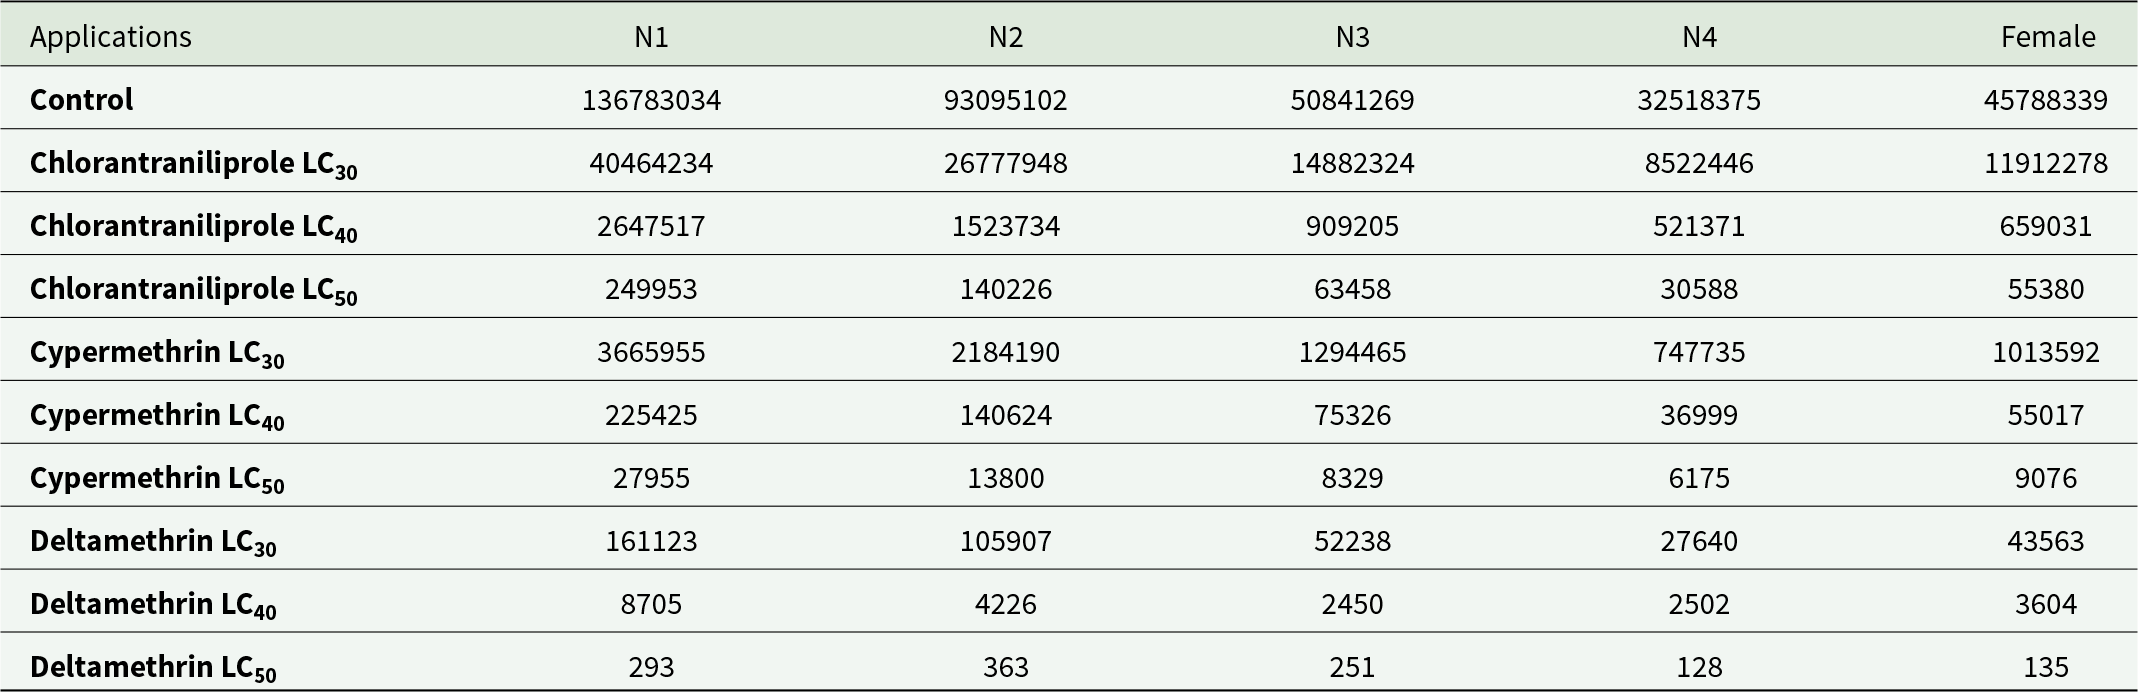
Population projection analyses were conducted by exposing R. padi individuals to three insecticides – deltamethrin, cypermethrin, and chlorantraniliprole – at gradient concentrations (LC₃₀, LC₄₀, and LC₅₀). All treatments, including control and insecticide-exposed groups, were maintained under uniform environmental conditions. Each replicate began with ten newly moulted first-instar nymphs as the founding cohort. The simulated age–stage population trajectories showed a progressive decline in overall population abundance with increasing insecticide concentrations. The comprehensive results of these projections are summarised in Table 6 and illustrated in Fig. 6.
Population size of Rhopalosiphum padi with 10 nymphs’ initial population on different insecticides (Deltamethrin, Cypermethrin, and Chrolarantraniliprole) and their different doses (LC30, LC40, LC50) after 60th days.

Figure 6 Long description
The image contains multiple line graphs comparing the population size of Rhopalosiphum padi under different insecticides and doses over 60 days. Each graph represents a specific insecticide and dose combination. The x-axis is labeled 'Time (days)' ranging from 0 to 60 and the y-axis is labeled 'Population size' with values from 0 to 100. 1. Control: Shows a steady increase in population size over time. 2. Chlorantraniliprole LC30, LC40, LC50: Each graph shows a gradual decline in population size as the dose increases. 3. Cypermethrin LC30, LC40, LC50: Similar trend with population size decreasing more sharply at higher doses. 4. Deltamethrin LC30, LC40, LC50: Displays a significant reduction in population size, especially at LC50. Key trends include a general decline in population size with increasing insecticide concentration. The graphs visually differentiate datasets using distinct markers for each dose level. Overall, the comparison illustrates the impact of different insecticides and concentrations on Rhopalosiphum padi population dynamics.
Population size of Rhopalosiphum padi with 10 nymphs’ initial population on different insecticides (Deltamethrin, Cypermethrin and Chrolarantraniliprole) and their different doses (LC30, LC40, LC50) after 60th days

Table 6 Long description
The table reports Rhopalosiphum padi population counts after 60 days, starting from 10 nymphs, broken out by nymph stages N1 to N4 and adult females for each treatment and dose. The control has the highest counts in every stage, with N1 at 136,783,034 and females at 45,788,339. For each insecticide, increasing dose from LC30 to LC50 consistently lowers counts across all stages. Chlorantraniliprole drops from 40,464,234 at N1 and 11,912,278 females at LC30 to 249,953 at N1 and 55,380 females at LC50. Cypermethrin declines from 3,665,955 at N1 and 1,013,592 females at LC30 to 27,955 at N1 and 9,076 females at LC50. Deltamethrin shows the strongest suppression overall, falling from 161,123 at N1 and 43,563 females at LC30 to 293 at N1 and 135 females at LC50, with similarly low values for N2 to N4. Comparisons across insecticides at the same dose indicate deltamethrin generally produces lower populations than cypermethrin, and both are far lower than chlorantraniliprole at LC30. Values are raw counts and do not indicate variability, replication, or statistical significance.
Discussion
The findings of this study clearly demonstrate that sublethal exposure to deltamethrin, cypermethrin, and chlorantraniliprole significantly affected the developmental traits and longevity of R. padi. Exposure to these compounds prolonged the nymphal and pre-adult periods and reduced adult lifespan, indicating that even concentrations below lethal thresholds can disrupt normal physiological functioning. Similar patterns have been reported in aphids and other hemipteran insects exposed to sublethal insecticide doses (Desneux et al., Reference Desneux, Decourtye and Delpuech2007; Liu et al., Reference Liu, Lu, Wu, Wyckhuys and Xue2008; Qu et al., Reference Qu, Ullah, Luo, Monticelli, Lavoir, Gao, Song and Desneux2020a). Deltamethrin exerted the strongest inhibitory effect on development, extending the total pre-adult duration by up to 7 days compared to the control group. This result is consistent with the neurotoxic mechanism of pyrethroids, which act on voltage-gated sodium channels and cause prolonged nerve depolarisation (Clark and Symington, Reference Clark and Symington2012). Comparable developmental delays were observed in Aphis craccivora following deltamethrin exposure (Qu et al., Reference Qu, Xu and Wang2020b). Cypermethrin also caused significant developmental retardation, though to a lesser extent, while chlorantraniliprole produced milder effects, reflecting its distinct mode of action through ryanodine receptor activation (Shi et al., Reference Shi, Zhang and Sun2022b). The overall reduction in adult longevity observed across treatments indicates that sublethal doses impose cumulative physiological stress. Deltamethrin-treated aphids exhibited the shortest lifespan, likely due to disruptions in neural and metabolic processes, whereas individuals exposed to chlorantraniliprole lived longer, suggesting comparatively lower toxicity and faster physiological recovery.
Sublethal concentrations of all insecticides caused significant reductions in fecundity, daily reproductive rate, and oviposition duration, while increasing the total pre-oviposition period (TPOP). These findings are consistent with previous studies showing that sublethal exposure impairs reproductive capacity by interfering with endocrine signalling and reproductive tissue integrity (Quan et al., Reference Quan, Qiu, Zhang, Sun, Li and Yan2016; Afza et al., Reference Afza, Shad and Abbas2021b). Deltamethrin caused the greatest reduction in fecundity, decreasing offspring production by over 80% at LC₅₀. This sharp decline may result from impaired feeding behaviour, disrupted neurotransmission, and altered vitellogenesis due to oxidative stress (Liu et al., Reference Liu, Li, Huang, Kang, Yang and Wu2015a). Cypermethrin also substantially reduced reproductive performance, consistent with its known interference with hormonal regulation and nervous system function (Tan et al., Reference Tan, Jia, Foster, Homem, Williamson, Han and Shan2021a). Although chlorantraniliprole was less disruptive, significant declines in fecundity and reproductive timing were still evident, corroborating previous reports that ryanodine receptor modulators can reduce reproductive potential in susceptible species (Liu et al., Reference Liu, Zhang and Li2015b; Tan et al., Reference Tan, Wang and Zhao2021b). The observed delays in reproductive onset suggest that sublethal stress alters resource allocation, forcing individuals to prioritise survival over reproduction. This prolongation of the pre-reproductive period contributes to lower generational overlap, which in turn slows population growth.
The life table parameters derived from the age–stage, two-sex model showed substantial declines in intrinsic (r) and finite (λ) rates of increase, as well as significant extensions in generation time (T). These demographic variables serve as comprehensive indicators of overall population fitness (Chi, Reference Chi2014; Wei et al., Reference Wei, Chi, Guo, Li, Zhao and Ma2020). The control population of R. padi exhibited rapid demographic expansion (λ = 1.413; r = 0.346), reflecting its inherent reproductive capacity under favourable conditions. In contrast, deltamethrin exposure at LC₅₀ caused a dramatic reduction in λ (1.101) and r (0.097), indicating severe population suppression. Cypermethrin induced moderate decreases, while chlorantraniliprole resulted in the mildest, yet still significant, demographic inhibition. These outcomes are consistent with similar findings for Aphis gossypii and Schizaphis graminum exposed to pyrethroids and flonicamid (Shi et al., Reference Shi, Luo, Lv, Zhang, Desneux, You, Li, Ullah and Ma2022a; Gul et al., Reference Gul, Ul Haq, Ullah, Khan, Yaseen, Shah, Tariq, Güncan, Desneux and Liu2023). The prolonged generation time under sublethal stress conditions (up to 18 days compared to 11.6 in the control) suggests that these insecticides not only reduce reproductive potential but also delay generational turnover. Over multiple generations, such demographic constraints could diminish field population density. However, chronic low-dose exposure may favour the persistence of tolerant phenotypes, thereby facilitating resistance development (He et al., Reference He, Zhao, Zheng, Desneux and Wu2012; Ma et al., Reference Ma, Tang, Liang, Li and Gao2022).
The adverse effects observed are likely mediated by a combination of biochemical and behavioural mechanisms. Pyrethroids such as deltamethrin and cypermethrin cause hyperexcitation and paralysis by disrupting sodium ion flow in neurons (Clark and Symington, Reference Clark and Symington2012). Even at sublethal concentrations, these effects trigger the activation of detoxification enzymes (e.g., cytochrome P450, esterases, glutathione S-transferases), leading to oxidative stress and altered metabolic allocation (Liu et al., Reference Liu, Li, Huang, Kang, Yang and Wu2015a; Graily-Moradi et al., Reference Graily-Moradi, Hejazi, Enayati and Hamishehkar2021). The energy diverted to detoxification reduces the resources available for reproduction and growth, explaining the observed demographic declines. Chlorantraniliprole acts through a different pathway by activating ryanodine receptors, leading to calcium leakage in muscle cells (Shi et al., Reference Shi, Zhang and Sun2022b). This mode of action may cause reduced feeding and locomotion, indirectly impairing reproductive activity. Although chlorantraniliprole is generally regarded as safer for non-target organisms, chronic sublethal exposure still generates measurable demographic costs, emphasising the need for careful field application strategies.
The outcomes of this study highlight the importance of including sublethal and demographic analyses in pesticide risk assessments. Conventional bioassays that focus solely on mortality may underestimate long-term ecological effects. Even when immediate mortality is low, reductions in λ, r, and R₀ can significantly affect pest population trajectories over time. From an IPM perspective, the strong suppressive effects of deltamethrin and cypermethrin indicate their continued efficacy against R. padi; however, repeated or improper use may accelerate resistance evolution (Bass et al., Reference Bass, Denholm, Williamson and Nauen2015; Kheradmand et al., Reference Kheradmand, Heidari, Sedaratian-Jahromi, Talaei-Hassanloui and Havasi2022). Incorporating compounds such as chlorantraniliprole into rotation schemes or combining them with biological control agents could reduce resistance pressure and minimise non-target effects (Desneux et al., Reference Desneux, Decourtye and Delpuech2007; Atlıhan et al., Reference Atlıhan, Kasap, Özgökçe, Polat-Akköprü and Chi2017). Therefore, evaluating the sublethal responses of pest populations provides valuable guidance for developing sustainable chemical control strategies that balance immediate efficacy with long-term ecological safety.
Overall, this study provides comprehensive and robust demographic evidence that sublethal concentrations of deltamethrin, cypermethrin, and chlorantraniliprole profoundly influence the biological performance and population dynamics of R. padi. The findings clearly demonstrate that these insecticides, even at doses insufficient to cause immediate mortality, significantly prolong developmental duration, suppress fecundity, and markedly reduce overall population growth potential. Such sublethal effects can lead to long-term demographic instability by altering life-history traits essential for population renewal and persistence. Among the compounds tested, deltamethrin imposed the most severe physiological and reproductive constraints, reflecting its potent neurotoxic action on voltage-gated sodium channels. Cypermethrin produced intermediate but still considerable adverse impacts, whereas chlorantraniliprole exhibited relatively milder effects, consistent with its more selective activity on ryanodine receptors. The comparative responses observed among the insecticides underscore the importance of understanding compound-specific and concentration-dependent variations in sublethal toxicity. Although chlorantraniliprole is often considered a more environmentally compatible option, the observed reductions in fecundity and intrinsic rate of increase indicate that even ‘safer’ insecticides can impose substantial demographic stress on pest populations. These findings also suggest that chronic exposure to low-level residues in agricultural environments may serve as a hidden but persistent selection pressure, driving adaptive physiological changes or resistance evolution in R. padi populations. From a broader ecological and pest management perspective, the study highlights that sublethal exposure plays a pivotal role in shaping aphid population trajectories and must be integrated into comprehensive risk assessments. Ignoring these subtle yet biologically significant effects can lead to underestimation of insecticide impacts on target and non-target organisms, potentially compromising the long-term effectiveness of pest control programmes. Therefore, incorporating sublethal and demographic analyses into resistance management frameworks and ecological safety evaluations is essential for developing sustainable, evidence-based IPM strategies aimed at minimising both economic losses and environmental risks.
This study comprehensively evaluated the sublethal effects of three commonly used insecticides – deltamethrin, cypermethrin, and chlorantraniliprole – on the biological traits and demographic parameters of R. padi. The results showed that exposure to these insecticides, even at concentrations below lethal levels (LC₃₀–LC₅₀), significantly altered the developmental duration, adult longevity, and reproductive potential of the aphid population. Life table analyses demonstrated significant reductions in intrinsic (r) and finite (λ) rates of increase, as well as extended generation times, indicating marked population-level suppression. Among the insecticides tested, deltamethrin caused the most severe sublethal effects, including pronounced developmental delays and drastic reductions in fecundity. Cypermethrin had intermediate negative effects, while chlorantraniliprole showed comparatively lower toxicity but still significantly reduced reproductive performance at higher concentrations. These differences reflect the varying physiological and biochemical pathways affected by each compound, linked to their distinct modes of action on the insect nervous and muscular systems. The demographic consequences observed in this study emphasise that sublethal insecticide exposure can profoundly influence population dynamics, potentially reducing pest density in the short term but also imposing evolutionary selection pressures that may accelerate resistance development over time. Therefore, evaluating insecticides solely on the basis of acute mortality provides an incomplete understanding of their ecological and long-term impacts. From an IPM perspective, including analyses of sublethal effects is crucial for designing effective, sustainable control strategies. Strategic rotation or combination of insecticides with different modes of action, together with biological control agents, may help mitigate resistance risks and preserve ecological balance. The present findings provide valuable insights into the demographic and physiological consequences of sublethal insecticide exposure in cereal aphids and highlight the need for more comprehensive ecological risk assessments in pest management programmes.
Data availability statement
Not applicable.
Author contributions
Conceptualisation, B.K. and A.K; methodology, B.K. and A.K.; software, B.K. and A.K.; validation, B.K. and A.K.; formal analysis, B.K. and A.K.; investigation, B.K. and A.K.; resources, B.K. and A.K.; data curation, B.K. and A.K.; writing – original draft preparation, B.K. and A.K.; writing – review and editing, B.K. and A.K.; visualisation, B.K. and A.K.; supervision, B.K. and A.K. All authors have read and agreed to the published version of the manuscript.
Financial support
This research received no external funding.
Conflicts of interests
The authors declare no conflict of interest.
Ethics approval
It has been implemented in accordance with all ethical rules.