I. INTRODUCTION
Nowadays, the environmental protection is receiving much more attention than ever before. One of the major efforts is focused on controlling the emission of toxic pollutants produced during the combustion of fuels in automotive engine. Most of vehicles in the world are equipped with a catalytic converter, which is almost exclusively based on the so-called three-way catalysts (TWC). Generally, a conventional TWC involves two main carriers: oxygen storage materials (ceria-based materials) and supports with high surface area and antisintering at high temperature (such as Al2O3, La-stabilized Al2O3). Ceria-based solid solutions have been intensively studied for their utilization in TWCs due to the multiple positive effects on the enhancement of catalytic performance. In catalysts, these materials possess large oxygen storage capacity (OSC) and an ability of promoting dispersion of noble metals, promote water-gas shift reaction, and steam reforming reaction and minimize the thermal sintering of alumina supports. But a major drawback of CeO2 is significant deactivation of the redox couple when it is used at high temperature in the driving conditions, which is attributed to the sintering of CeO2 particles and the reactions between CeO2 and γ-Al2O3 support or active noble metals.Reference Gandhi and Shelef1, Reference Kim2 For TWC application, the homogeneity and textural stability of the mixed oxide are fairly important. Recently, special attention has been focused on the preparation of CeO2–ZrO2 with good thermal stability, excellent redox properties, and high OSC, and the catalytic activity of these materials are strongly enhanced in comparison with pure CeO2.Reference Pijolat, Prin, Soustelle, Touret and Nortier3–Reference Kašpar, Di Monte, Fornasiero, Graziani, Bradshaw and Norman7 The effect of insertion of ZrO2 into CeO2 lattice is clearly confirmed by recent data gathered from literature, and high ZrO2 content favors the highest textural stability under equivalent synthesis condition.Reference Pijolat, Prin, Soustelle, Touret and Nortier3, Reference Kašpar, Di Monte, Fornasiero, Graziani, Bradshaw and Norman7 Balducci et al.Reference Balducci, Kašpar, Fornasiero, Graziani, Islam and Gale8, Reference Balducci, Kašpar, Fornasiero, Graziani and Islam9 have reported that introduction of ZrO2 into CeO2 lattice lowers the energy for Ce4+ reduction, and with high mobility of lattice oxygen, the diffusion of oxygen from bulk to surface promotes the redox action of Ce4+/Ce3+ couples. Further investigation has been showed that Y3+ or La3+ adding into CeO2–ZrO2 can influence the crystalline structure, oxygen mobility, OSC, thermal stability, and redox properties of CeO2–ZrO2 solid solutions.Reference Ikryyannikova, Aksenov, Markaryan, Muravieva, Kostyuk, Kharlanov and Lunina10–Reference Vidmar, Fornasiero, Kaspar, Gubitosa and Graziani13 In our precious study,Reference Guo, Wu, Zhang, Gong, Zhao and Chen14–Reference Guo, Yuan, Gong, Zhang, Wu, Zhao and Chen16 it is found that Ce0.35Zr0.65O2 has excellent texture performance, stable cubic phase, and high OSC, whereas Y3+ or La3+ adding into Ce0.35Zr0.65O2 further improves its performance. Recently, Turko et al.Reference Turko, Ivanva, Plyasova, Litvak and Rogov17 have reported that the physicochemical properties of a thermally stable single-phase cerium zirconium oxide with a fluorite structure can be stabilized by Y3+ and La3+. To our knowledge, there are few systemic reports on a combined investigation of texture, structure, OSC, and redox properties of CeO2–ZrO2–Y2O3–La2O3solid solution.
The aim of the present study was to develop a novel oxygen storage material for the removal of toxic pollutants from automotive engine. In this paper, Ce0.35Zr0.65−xRExO2 (RE = Y and La; x = 0 and 0.10) and Ce0.35Zr0.50Y0.075La0.075O2were prepared by a conventional coprecipitation method. The texture, structure, OSC, and redox properties of solid solutions were investigated using Brunauer–Emmett–Teller (BET) surface area characterization, x-ray diffraction (XRD), Raman spectra, and temperature-programmed technique. The OSC of the samples was examined by oxygen pulse reaction.
II. EXPERIMENTAL
A. Materials
Aqueous ammonia (30% NH3), ammonium carbonate (analytical reagent), and hydrogen peroxide (30%, w/w) were purchased from Chengdu Kelong Chemical Reagent Factory (Chengdu, China). Lanthanum nitrate hexahydrate [La(NO3)3·6H2O, chemically pure (CP)], cerous nitrate hexahydrate [Ce(NO3)3·6H2O, CP], yttrium nitrate pentahydrate [Y(NO3)3·5H2O, CP], and zirconyl nitrate pentahydrate [ZrO(NO3)2·5H2O, CP] were purchased from Leshan Wutongqiao Dongfeng Chemical Factory, (Leshan, China). All chemicals were used as received without further purification. Distilled water was used throughout the study.
B. Preparation
Ce0.35Zr0.65−xRExO2 (RE = Y and La; x = 0 and 0.10) and Ce0.35Zr0.50Y0.075La0.075O2 were prepared by coprecipitation technique. Ce(NO3)3·6H2O, ZrO(NO3)2·5H2O, Y(NO3)3·5H2O, and La(NO3)3·6H2O were used as the raw materials. The precursors were mixed in an aqueous solution at the nominal composition with cation concentration of 0.02 mol/L, and an appropriate amount of fresh H2O2 (30%) was added to this mixed salt solution. The resulting metal salt solution was simultaneously dropwised to a new container with a mixed solution of ammonia (3 mol/L) and ammonia carbonate aqueous solution (3 mol/L) to reach a pH value of 10. The obtained precipitates were aged at 90 °C for 3 h with vigorous agitation and then filtered. The obtained cake was washed with distilled water until the washing fluid became neutral, subsequently spray dried, and calcined at 600 °C in muffle furnace for 5 h. To compare their thermal stability, the obtained samples were calcined at 1000 °C for 5 h. The resulting powders were in turn tabletted, crushed, and sieved to 40–80 mesh before they were used. Ce0.35Zr0.65O2, Ce0.35Zr0.55Y0.10O2, Ce0.35Zr0.55La0.10O2, and Ce0.35Zr0.50Y0.075La0.075O2calcined at 600 °C were written as CZ, CZY, CZL, and CZYL. The aged samples were labeled as CZA, CZYA, CZLA, and CZYLA.
C. Characterization
The N2 adsorption isotherms of the samples at the temperature of liquid nitrogen were obtained on a ZXF-06 automatic surface analyzer (Xibei Chemical Institute, Xianyang, China). All samples were degassed for 1 h at 350 °C in vacuum before commencement of the measurement to remove the surface impurities. The adsorption isotherm data were used to calculate the surface area (S BET) of each sample via the BET equation at relative pressures between 0.05 and 0.35. The crystal structure of the samples was determined by XRD analysis on a computer-controlled DX-1000 diffractometer (Dandong Fangyuan Instrument Co., Dandong, China) using Cu Kαradiation (λ = 0.15406 nm). The x-ray tube was operated at 40 kV and 100 mA. The samples were scanned within the 2θ range of 10–90° at a scanning rate of 0.03°/s. The crystalline phases were identified by comparing them with the reference data from the International Center for Diffraction Data (JPCDS). The laser Raman spectra were recorded using a HORIBA Jobin Yvon LabRAM HR Raman spectrometer (Paris, France) with a 30 mW Ar ion laser (532 nm).
OSC was measured by gas chromatogram in flowing pure N2 (20 mL/min) on a 200-mg sample at 200 °C. Prior to the OSC measurement, the 200-mg sample was reduced under pure H2 flow (40 mL/min) from room temperature (RT) to 550 °C and kept at 550 °C for 45 min. And then, the treated sample was cooled to 200 °C under the same conditions and purged with pure N2. The OSC was measured by injecting pulses of oxygen (82 μmol of O2) into the sample bed until no oxygen consumption can be detected by a thermal conductivity detector. The temperature-programmed reduction (TPR), oxidation (TPO), and desorption (TPD) experiments were preformed in a quartz tubular microreactor to observe the reductive and oxidative properties of ceria-based solid solutions. Prior to H2-TPR measurement, the 100-mg sample was pretreated in N2 with 20 mL/min flow rate from RT to 400 °C with heating rate of 10 °C/min and maintained at 400 °C for 45 min. The treated sample was cooled to RT. The reduction was performed with 5% H2–95% N2 mixture at a heating rate of 10 °C/min from RT to 800 °C. The H2 consumption was monitored by a TCD. After TPR, the samples were cooled to RT in pure N2 (20 mL/min). And then, the TPO experiments were performed via using a gas 10% O2–90% N2 with a ?ow rate of 20 mL/min, and the temperature was heated at a rate of 10 °C/min from RT to 700 °C. The O2 consumption was measured by a TCD. Before performing an O2-TPD experiment, the 100-mg sample was first pretreated in pure N2 with a flow rate of 20 mL/min at 400 °C for 45 min, and then, the gas flow was switched to 10% O2–90% N2 with a flow rate of 20 mL/min at 400 °C for 45 min. Finally, the sample was cooled to RT in the same atmosphere. After being cooled to RT, the sample was heated at a rate of 10 °C/min from RT to 600 °C in pure N2 (20 mL/min) for O2desorption. The effluent gas was monitored online by a TCD.
III. RESULTS
A. Textural properties and phase structure of the solid solutions
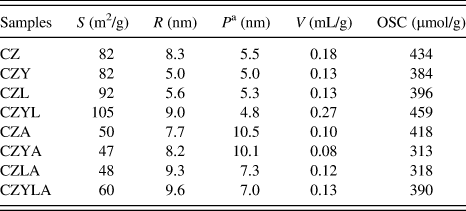
The textural properties of all samples before and after aging at 1000 °C are summarized in Table I. When Y3+ or La3+ is added to CeO2–ZrO2, the pore volume of both samples slightly decreases. The surface area of CZL reaches to 92 m2/g, and the surface area and pore volume of CZYL increase to 105 m2/g and 0.27 mL/g, respectively. The average pore radius of CZ, CZY, and CZL is 8.3, 5.0, and 5.6 nm, respectively, whereas that of CZYL is 9.0 nm. After aging at 1000 °C for 5 h, the surface area, average pore radius, and pore volume of all samples undergo a decrease, but CZYLA still has 60 m2/g of surface area, 9.6 nm of average pore radius, and 0.13 mL/g of pore volume, indicating that some synergic effects of Y3+ and La3+ significantly enhance textural stability of CeO2–ZrO2.
Surface area (S), average pore radius (R), average particle size (P), pore volume (V), and OSC.
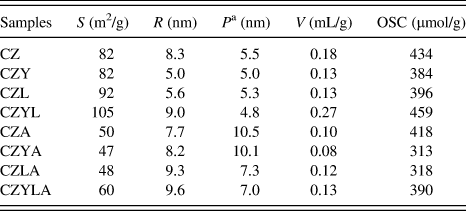
a Estimated according to XRD peak-broadening analysis.
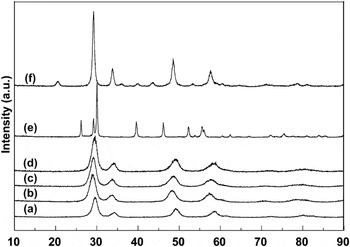
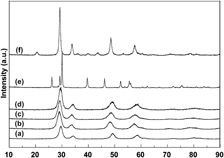
The XRD patterns of La2O3, Y2O3, CZ, CZY, CZL, and CZYL are shown in Fig. 1. The diffraction peaks at 26.18°, 29.18°, 30.08°, 39.58°, 46.18°, 52.18°, 52.93°, 55.54°, 55.39°, 60.19°, 62.32°, 66.94°, 71.92°, 75.31°, 80.74°, 83.56°, and 84.28° are due to hexagonal structure of La2O3 (JCPDS Card No. 74-2430). The XRD pattern of Y2O3 powders exhibits the cubic structure, and the diffraction peaks are at 2θ = 20.47°, 29.20°, 33.85°, 35.89°, 39.73°, 43.66°, 48.61°, 53.35°, 57.64°, 60.64°, 77.68°, 71.17°, 77.89°, and 81.01°, which is in good agreement with the pattern in JCPDS File No. 83-0927. The broadening of the reflections in the diffractograms distinctly indicates its nanocrystalline nature. It is revealed that all samples calcined at 600 °C are nanocrystalline with about 5 nm size calculated from XRD peak-broadening analysis (Table I). For CZ, the obvious peaks at 2θ = 29.56°, 34.3°, 49.15°, 58.48°, 61.90°, 72.67°, 79.93°, and 82.54° [Fig. 1(a)] are observed. When Y3+ is induced into CeO2–ZrO2, a new solid solution is formed, whereas the diffraction peaks (2θ) [Fig. 1(b)] shift to 29.14°, 34.03°, 48.46°, 57.22°, 60.7°, 71.20°, 78.86°, and 81.43°. Similar profiles are also obtained from the others. The diffraction peaks (2θ) of CZL [Fig. 1(c)] are 29.20°, 33.73°, 48.61°, 57.85°, 60.82°, 71.56°, 78.64°, and 81.04°. The broadest diffraction peaks of CZYL [Fig. 1(d)] are attributed to the presence of small crystallites (4.8 nm) effect, and the diffraction peaks are 29.29°, 34.15°, 49.48°, 58.51°, 60.94°, 71.62°, 78.58°, and 81.10°. These results indicate that Y3+ or/and La3+ can enter into the CeO2–ZrO2lattice.
XRD patterns of CZ (a), CZY (b), CZL (c), CZYL (d), La2O3 (e), and Y2O3(f).

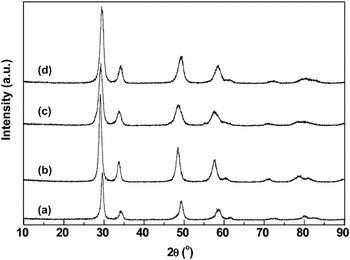
The structural homogeneity and thermal stability of the prepared materials are performed by the following calcination at high temperature. All samples are calcined at 1000 °C for 5 h, and the nature of phase is examined. The XRD patterns are reported in Fig. 2. No asymmetric peaks are found in the XRD patterns of all samples, indicating that the prepared materials could form a single-phase solid solutions. And the width of all XRD peaks become narrow, which is an indication that all samples occur sintering [compared with Figs. 1(a)–1(d) and the average particle size of the solids increases (Table I)]. However, the prepared materials containing La3+ still maintain nanometeric level, 7.3 nm for CZLA and 7.0 nm for CZYLA, indicating that La3+ could better efficiently retard CeO2–ZrO2 crystal sintering and particles growth. From phase analysis, the obvious diffraction peaks of CZA at 2θ = 29.62°, 34.51°, 49.39°, 58.57°, 61.90°, 72.85°, 80.38°, and 82.87° are observed. When Y3+ or La3+ is induced into CeO2–ZrO2, the diffraction peaks of CZYA shift to 29.11°, 33.85°, 48.52°, 57.76°, 60.79°, 71.53°, 79.12°, and 81.64°, and those of CZLA shift to 29.23°, 34.00°, 48.73°, 57.97°, 61.57°, 71.44°, 79.03°, and 80.86°. When Y3+ and La3+ are simultaneously added to CeO2–ZrO2, the diffraction peaks of ZYLA at 29.44°, 34.24°, 49.54°, 58.55°, 61.45°, 72.43°, 80.62°, and 82.51° are detected. These results indicate that Y3+ or/and La3+effectively stabilize the phase of materials and significantly improve thermal stability.
XRD patterns of aged CZA (a), CZYA (b), CZLA (c), and CZYLA (d).

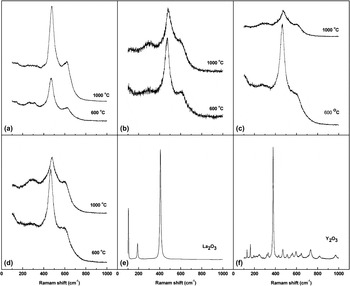
The Raman spectra can be used to confirm the structure of the solid solutions. The Raman spectra of the prepared materials, La2O3 and Y2O3. are illustrated in Fig. 3. The Raman bands at 104, 190, and 407 cm−1 are assigned to La2O3 and bands at 130, 162, 194, 245, 318, 331, 377, 420, 431, 470, 508, 560, 594, 645, 734, 815, and 970 cm−1 are assigned to Y2O3. All fresh samples have one strong Raman peak at ∼471 cm−1 and weak peak at ∼627 cm−1, indicating that Y3+ and/or La3+ enter into the CeO2–ZrO2 lattice. The former is due to F2g mode of c-CeO2, and the latter is attributed to the presence of intrinsic O vacancies in the lattice.Reference McBride, Hass, Poindexter and Weber18 After aging at 1000 °C for 5 h, one strong Raman peak at ∼474 cm−1 and a broad weak peak at ∼628 cm−1 are observed for aged CZ, indicating that CeO2–ZrO2 can form a stable cubic phase under our experimental condition. When Y3+ is induced into CeO2–ZrO2, one strong Raman peak at ∼478 cm−1, a broad weak peak at ∼300 cm−1, and a weak peak at ∼605 cm−1 are observed. For aged CZL, there are a strong Raman peak at ∼472 cm−1 and two broad weak peaks at ∼300 and 605 cm−1. When Y3+ and La3+ are simultaneously added to CeO2–ZrO2, a strong Raman peak at ∼481 cm−1, a weak peak at ∼605 cm−1, and a broad peak at ∼300 cm−1 are observed. These results indicate that Y3+ and/or La3+ do not segregate from the CeO2–ZrO2solid solution after aging at 1000 °C.
Raman spectra of CZ (a), CZY (b), CZL (c), CZYL (d), La2O3 (e), and Y2O3(f).

B. OSC and redox behaviors
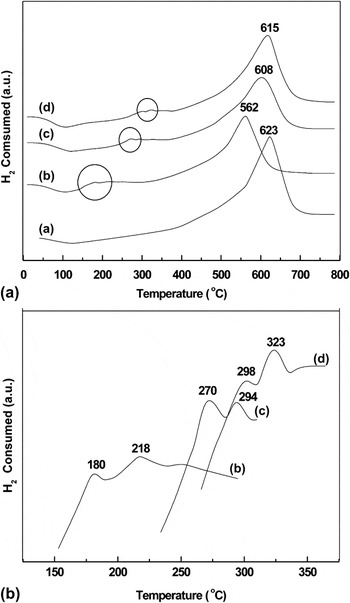
The OSC and redox properties of the sample used in this work are investigated by oxygen pulse reaction and temperature-programmed technique, respectively. The H2-TPR profiles of fresh samples are illustrated in Fig. 4. Yao and YaoReference Yao and Yao19 have found that a new oxygen species, probably a molecular oxygen anion, is formed at 25 °C, which converts slowly at 500 °C to the capping oxygen anion, and complete restoration of all three types of oxygen anions is accomplished at 850 °C in air. The reduction peaks of the surface capping oxygen and the bulk oxygen of CeO2 are centered at 500 and 800 °C,Reference Yao and Yao19 respectively. Zhu et al.Reference Zhu, Qin, Shan, Shen and Wang20 have found that the reduction of CeO2 starts at 280 °C and two broad peaks are observed at 510 and 800 °C, respectively. The peak at 510 °C is assigned to the reduction of surface capping oxygen of CeO2, and the peak at 800 °C can be attributed to the reduction of bulk CeO2. Teng et al.Reference Teng, Luo and Yang21 have reported that two reduction peaks (420 and 567 °C) of m-Ce0.8Zr0.2O2 correspond to the reduction of oxygen from surface and bulk ceria, respectively. He et al.Reference He, Dai, Wong and Au22 have found that Y3+ doping into the CeO2–ZrO2 lattice can increase the concentrations of oxygen vacancies and Ce3+ ions, and the reduction peaks at ∼528 and 825 °C in the first TPR run are observed. The peak at around 400 °C is ascribed to the reduction of surface capping oxygen (O2−, O) species due to the defects of structure and electronic properties of nonstoichiometric ceria.Reference Li, Zhou, Wang, Dong, Li and Cheng23 For CZ, a single broad reduction peak centered at 580 °C is observed. For CZY, a broad reduction peak at 562 °C with two small peaks at 180 and 218 °C (local) are observed, indicating that there are at least two types of adsorbed surface oxygen species located at lower temperatures and the reduction peak centered at 562 °C could be assigned to the Ce4+ reduction of surface or subsurface. For CZL, the reduction peak centered at 608 °C is due to the reduction of Ce4+ located on the surface (subsurface), and the reduction peaks at 270 and 294 °C are attributed to the adsorbed oxygen species on the surface. There are three separate reduction peaks at 298, 323, and 615 °C for CZYL, suggesting that the reduction at the higher temperature belongs to the Ce4+ located on the surface (subsurface), whereas the reduction at the lower temperature is probably adsorbed oxygen species. These results indicate that the introduction of trivalent dopants (Y3+ or/and La3+) to the CeO2–ZrO2solid solution can change the surface chemical property of solid solution, which increases the adsorption capacity of oxygen species on the surface of solid solution.
H2-TPR profiles of fresh CZ (a), CZY (b), CZL (c), and CZYL (d) samples; (A) whole, (B) local (○).

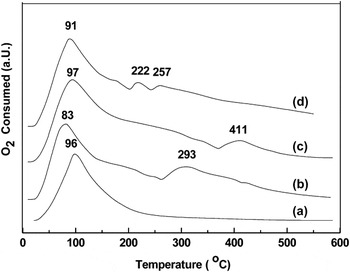
All samples are measured by O2-TPO after TPR to obtain a deeper insight into the reoxidation property. The O2-TPO profiles of CZ, CZY, CZL, and CZYL are illustrated in Fig. 5. There is only one oxidation peak at 96 °C for CZ, indicating that only a surface Ce3+ is oxidized to Ce4+. For CZY, two oxidation peaks at 83 and 293 °C are observed, suggesting that the surface Ce3+ is oxidized to Ce4+ at 83 °C and the oxidation peak at 293 °C belongs to the oxidation of subsurface Ce3+. For CZL, there are two oxidation peaks at 97 and 411 °C. They belong to the Ce3+ oxidation of surface and subsurface, respectively. Three oxidation peaks at 91, 222, and 257 °C for CZYL are observed, showing that the surface Ce3+ is oxidized to Ce4+ at 91 °C and the presence of Ce3+ oxidation peaks at 222 and 257 °C due to the subsurface Ce3+. These results show that when Y3+ and La3+ are simultaneously induced to CeO2–ZrO2, the oxygen mobility increases from surface to bulk, which is in favor of oxygen migration.
O2-TPO profiles of CZ (a), CZY (b), CZL (c), and CZYL (d) samples.

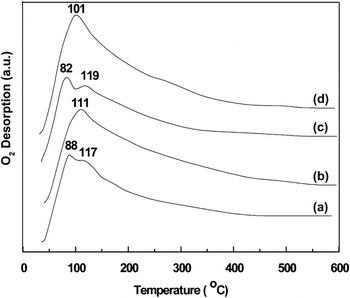
The O2-TPD profiles of the prepared materials are shown in Fig. 6. According to the literature,Reference Teraoka, Yoshimatsu, Yamazoe and Seiyama24, Reference Zhang, Shimizu, Teraoka, Miura and Yamazoe25 in O2-TPD curves, two desorption peaks are usually observed that the low temperature peak (T < 400 °C) represents the desorption of oxygen adsorbed on the surface oxygen vacancies, such as the species O2− and O−, and the high temperature peak (T > 400 °C) is considered as coming from the bulk of the solid.Reference Xue, Zhang, He and Teraoka26 One desorption peak at 88 °C and a shoulder at 117 °C are observed for CZ. With the incorporation of Y3+ into the CZ lattice, there is a large peak centered at 111 °C [Fig. 6(b)]. When La3+ is incorporated into the CeO2–ZrO2, there are two desorption peaks at 82 and 119 °C [Fig. 6(c)]. For CZYL, a large broad peak centered at 101 °C is observed. This indicates that Y3+ and La3+ are simultaneously induced into the CeO2–ZrO2lattice resulting in the increase of oxygen adsorbed capacity.
O2-TPD profiles of fresh CZ (a), CZY (b), CZL (c), and CZYL (d) samples.

The oxygen pulse technique is used to study the OSC of samples, and the results are summarized in Table I. It is reported by Vidal et al.Reference Vidal, Kašpar, Pijolat, Colonb, Bernal, Cordón, Perrichon and Fally27 that the OSC of Ce0.15Zr0.85 has 260 μmol/g at 427 °C measurement and that of Ce0.50Zr0.50 has 740 μmol/g. In our previous study,Reference Guo, Wu, Zhang, Gong, Zhao and Chen14 the OSC of Ce0.50Zr0.50 before and after aging at 1000 °C has 414 and 268 μmol/g at 200 °C, respectively. The OSC of CZ, CZY, CZL, and CZYL at 200 °C are 435, 384, 396, and 460 μmol/g, respectively. After aging at 1000 °C for 5 h, the OSC of all samples are in decrease, but CZYLA still possesses 390 μmol/g, showing that the Y3+ and La3+ coincorporation into the CeO2–ZrO2increases the OSC compared to CZYA and CZLA. In a summary, the OSC of fresh samples follows a sequence of CZY < CZL < CZ < CZYL and that of aged samples is CZYA < CZLA < CZYL < CZ.
IV. DISCUSSION
A. Defective structure and textural properties
In previous research, it has been observed that pure CeO2 (JCPDS Card No. 43-1002Reference Aghabozorg, Sakhaie, Ramezani and Aghabozorg28) has the fluorite structure. When ZrO2 is inserted into the CeO2 framework, CeO2–ZrO2 mixed oxides have a quite complex phase diagram, containing three stable phases [monoclinic, tetragonal (t), and cubic] and two metastable phases (t′ and t″). The t phase is formed through a decomposition of the diffused phases, whereas the t′ phase is obtained through a diffusion transition. The t″ phase is an intermediate phase between t′ and cubic CeO2 and is very close to the fluorite cubic structure except that there is the displacement of the oxygen atom in its crystal lattice.Reference Yashima and Wakitak29, Reference Yashima, Arashi, Kakihana and Yoshimura30 In the intermediate domain, the true nature of CeO2–ZrO2 phase diagram is still unidentified due to the presence of many stable and metastable tetragonal phases.Reference Yashima, Arashi, Kakihana and Yoshimura30–Reference Kašpar, Fornasiero and Graziani32 It is generally accepted that the crystal structure of a CeO2–ZrO2 solid solution depends on chemical composition and synthesis procedure. Nakatani et al.Reference Nakatani, Okamoto and Ota31 has reported that the amount of monoclinic ZrO2 decreases and metastable tetragonal ZrO2 appears when the content of CeO2 increases from 0 to 20 mol%. But when CeO2 content is above 80 mol%, there is only one cubic phase. Given the relatively large difference (13%) between the cation radius of Ce4+ (0.097 nm) and Zr4+ (0.084 nm), a limited mutual solubility might be expected. The bulk Ce1−xZrxO2 (χ = 0.4–0.65) materials exhibit the t′ phase at RT in previous report.Reference Yashima, Arashi, Kakihana and Yoshimura30, Reference Masui, Ozaki, Machida and Adachi33 It has been established that six Raman-active modes of A1g + 3Eg + 2B1g symmetry are observed for tetragonal ZrO2 (space group P42/nmc), while for the cubic fluorite structure (space group Fm3m), only one F2g mode centered at around 465 cm−1 is Raman active for CeO2.Reference Yashima, Arashi, Kakihana and Yoshimura30, Reference Vlaic, Monte, Fornasiero, Fonda, Kašpar and Graziani34 The weak peaks at ∼620 (Ref. Reference McBride, Hass, Poindexter and Weber18) and 600 cm−1 (Ref. Reference Ayastuy, Gurbani, González-Marcos and Gutiérrez-Ortiz35) are attributed to the intrinsic O vacancies in the lattice. The Raman peak at ∼315 cm−1 indicates a metastable phase (t″) in CeO2–ZrO2 materials.Reference Wang, Kang and Li36 The appearance of weak bands at ∼300 cm−1 could be attributed to the displacement of the O atoms from their ideal fluorite lattice position.Reference Cao, Pan, Ni, Yuan and Wang37 Raman bands at 403, 186, and 102 cm−1 are assigned to La2O3 and bands at 131, 163, 196, 318, 332, 379, 433, 470, and 585 cm−1 belong to Y2O3.Reference Zhang, Yang, Zhang and Lu38 In Fig. 1, no phase segregation is observed, and a stable solid solution is formed under the conditions adopted in our work for CeO2–ZrO2-based material preparation. For fresh Ce0.35Zr0.65O2, the diffraction peaks are close to cubic phase of CeO2 (JPCDS Card No. 43-1002), indicating that fresh Ce0.35Zr0.65O2 solid solutions show a face-centered cubic lattice structure at ambient conditions. It is reported that the addition of Y3+ stabilizes the cubic structure of ternary systems at very low content of both yttrium and cerium oxides (less than 10 mol%).Reference Markaryan, Ikryannikova, Muravieva, Turakulova, Kostyuk, Lunina, Lunin, Zhilinskaya and Aboukaïs39 Kulyova et al.Reference Kulyova, Lunina, Lunin, Kostyuk, Muravyova and Kharlanov40 have also found that Y0.1Ce0.1Zr0.8O2 possesses a stable cubic phase. In our experiment, when Y3+ or/and La3+ are incorporated into CeO2–ZrO2 with 35 mol% CeO2 content, a single cubic phase is detected and no phase separation is observed. For all fresh samples in Fig. 3, the Raman peaks at ∼472 and 627 cm−1 are respectively attributed to F2g mode of c-CeO2 and the presence of defective structure. It is confirmed that the as-prepared CeO2–ZrO2-based materials form a single cubic phase. For all aged samples, no phase segregation is observed (in Fig. 2), but the corresponding sample shows a different Raman shift (in Fig. 3), indicating that CeO2–ZrO2-based materials have different structure, which cannot be distinguished in the XRD. For aged Ce0.35Zr0.65O2, one strong Raman peak at ∼474 cm−1 and a broad weak peak at ∼628 cm−1 are observed for aged CZ. The former is attributed to F2g mode of c-CeO2, and the latter is due to the presence of intrinsic O vacancies, indicating that CeO2–ZrO2 can form a stable cubic phase under our experimental condition. When Y3+ or/and La3+ are added to CeO2–ZrO2, no new phase is observed and the displacement of the O atoms from their ideal fluorite lattice position is increased. In our studies, the diffraction peaks of La2O3 and Y2O3 are not detected in XRD characterization, and Raman spectra of La2O3 and Y2O3 are not observed. This result implies that Y3+ or/and La3+ increase the defective structure of CeO2–ZrO2. In Table I, the prepared materials containing La3+ have small particle size (7.3 nm for CZL and 7.0 nm for CZYL) after high temperature (1000 °C), indicating that La3+ can significantly improve thermal stability. When small Y3+ is introduced into the CeO2–ZrO2–La2O3, the face-centered cubic phase of CeO2–ZrO2 is more stable at high temperature treatment for long time. This result indicates that Y3+ or/and La3+ enter into CeO2–ZrO2crystal lattice, which can significantly increase phase homogeneity, defective structure, and high thermal stability.
The performance of catalysts depends on the phase composition, homogeneity, and surface area of powders.Reference Terribile, Trovarelli, Llorcha, de Leitenburg and Dolcctti41 Furthermore, high surface area, appreciable pore volume, and high calcination temperatures may be used to obtain an efficient incorporation of both ZrO2 and trivalent dopants (such as Y3+ and La3+) into the CeO2 lattice. The first two properties would be very important for noble metal deposition in the preparation of TWCs. In Table I, there are only slightly changes about surface area of the samples containing 10 mol% Y3+ or La3+. The dopants with 7.5 mol% Y3+ and 7.5 mol% La3+ are conducive to form a single cubic phase and significantly increase the surface area, indicating that there are some synergistic effects of Y3+ and La3+ because they have near ionic radii (Y3+ 0.110 nm and La3+0.118 nm) in the solid solution formation process.
B. Oxygen storage and redox behavior
In Table I, the OSC of CZ is 434 μmol/g and higher than that of CZY (384 μmol/g) and CZL (396 μmol/g) but less than that of CZYL (456 μmol/g). This represents a mechanism for the release of the stress generated by insertion of the smaller Zr4+ (0.084 nm) into the CeO2 lattice, and at the same time, it is responsible for the high oxygen mobility in the bulk by generating mobile oxygen in the lattice itself. Because Y3+ (0.110 nm) and La3+ (0.118 nm) are close to Ce4+ (0.101 nm), Y3+ or La3+ may easily compete with Ce4+ for the low coordinated sites, not allowing an efficient release of the stress in the lattice. This is not conducive to the movement of oxygen in the bulk. The face-centered cubic lattice is described as oxygen ions occupying the empty of tetrahedral interstitial sites and octahedral sites in a perfect fluorite structure.Reference Mamontov, Egami, Brezny, Koranne and Tyagi42 The OSC of ceria-based oxides is not correlated with the surface area but depends on the concentration of oxygen defect.Reference Mamontov, Egami, Brezny, Koranne and Tyagi42 The crystal lattice of CZYL is close to the face-centered cubic lattice of CZ, and their OSC is also very close. This explains that the OSC of materials is more determined by the oxygen-defective structure, whereas the external texture is not the key factor for governing the OSC performance of the prepared CeO2–ZrO2-based solid solution.
The TPR profiles of the prepared materials show a single, slightly asymmetric, and reduction peak centered at about 600 °C. In the XRD characterization and Raman spectra, the fresh materials display a single stable face-centered cubic nanostructure. This evidence indicates that TPR profiles of ceria–zirconia oxides with single phase generally display a single reduction peak.Reference Fornasiero, Montini, Graziani, Kašpar, Hungria, Martinez-Arias and Conesa43 In Fig. 4, the small shifts of the reduction peaks in the fresh samples could be related with the increase of oxygen mobility by the dopants. The reductive behavior of CeO2–ZrO2-based solid solution is strongly affected by the temperature of the preoxidation performed before the TPR run: a mild oxidation generates a low temperature reduction profile, whereas the severe high temperature oxidation generates high temperature reduction profiles.Reference Balducci, Fornasiero, Di Monte, Kašpar, Meriani and Grazini44 In our work, the reduction peak of all samples is occurring around 600 °C. That is because the samples are only pretreated in pure N2 at 400 °C for 45 min before TPR and the chemical environment of reductive species on the samples are not changed. Compared with the reduction peak of Ce0.35Zr0.65O2, the reduction peak of solids doping with Y3+, La3+ and Y3+, and La3+ is performed at less than 61, 15, and 8 °C, respectively, suggesting that CZY is the most easy to release oxygen so that it has the lowest reduction temperature compared to CZL and CZYL (Fig. 4). Oxygen vacancies in the defective structures of CZY, CZL, and CZYL are believed to be responsible for the good performance in O2 oxidation at low temperature (Fig. 5) and for the high tendency of oxygen diffusion (Fig. 6). In the TPR of fresh sample, there are a collapse of surface area and a filling of pore, which can hinder the concomitant reduction of the surface. Conversely, the different initial texture of the solid solution modifies the reduction temperatures in the TPR and affects the behavior in the TPO (Fig. 5).
C. Oxygen mobility
Oxygen mobility is an important factor to consider when solid oxides are used as catalysts in the oxidation of carbon monoxide and hydrocarbons and in the removal of automotive exhaust. Generally, there are several oxygen adsorbed species such as O2−, O22−, and O− on the surface of an oxygen-containing catalyst. Semiconductor oxides and some metal surface can adsorb O2 (including some O2−) at the lower temperature, while at higher temperatures, O2 or O2− is dissociated into O− and adsorbed on the oxide surface. The order of the adsorption energy of the three kinds of particles is O2 < O2− < O−. Liotta et al.Reference Liotta, Ousmane, Di Carlo, Pantaleo, Deganello, Marcì, Retailleau and Giroir-Fendler45 have found that a sharp peak of physisorbed O2 is observed at 50 °C. Superoxide (O2−) and/or peroxide (O22−) species are transiently produced by oxygen adsorption on the surface reduced defects formed under vacuum already at 200 °C or upon thermal treatment at higher temperatures.Reference Binet, Daturi and Lavalley46 From the O2-TPD, the prepared materials should be expected to exhibit significant differences in their structural and chemical surface properties, which may lead to a distinct capability for activating the dioxygen molecule. Oxygen adsorbed on the surface of the prepared materials exhibits different desorption temperature, showing that there are several different active oxygen species. CZ and CZL have two desorption peaks [Figs. 6(a) and 6(c)], showing that two active oxygen species exist on the surface. One broad peak of CZY and CZYL is observed [Figs. 6(b) and 6(d)], indicating that one active oxygen species locates on the surface of solid solution. The first TPD peak corresponds to the existence of O2− ions, which is nested in surface oxygen vacancies presented in the prepared CeO2–ZrO2-based solid solution. From the profiles of O2-TPD, it can be concluded that the introduction of Y3+ into CeO2–ZrO2 lattice can increase surface oxygen vacancies, which is consistent with the literature.Reference He, Dai, Wong and Au22 When La3+ is added to CeO2–ZrO2 lattice, there are two types of superoxide species on the surface. These oxygen species can intertransform via a sequence of O2− ⇔ O22− ⇔ O− ⇔ Olattice2− at elevated temperatures. In this study, it is suggested that the oxygen mobility of CeO2–ZrO2-based solid solution may increase the available surface oxygen to enhance the surface oxidation reaction (Fig. 5). The characterization results of TPO and TPD reveal that the presence of Y3+ and La3+ in the CeO2–ZrO2framework increases the oxygen mobility.
V. CONCLUSIONS
In summary, the present investigation has an important role of trivalent dopants in proving the oxygen storage at low temperatures in the CeO2–ZrO2. In our work, Ce0.35Zr0.50Y0.075La0.075 with high OSC at low temperatures is prepared by a simple coprecipitation method. The insertion of trivalent cation (Y3+ and La3+) into CeO2–ZrO2 significantly improves textural and structural properties, and most importantly, it favors the homogeneity of face-centered cubic phases and high thermal stability. A hinder thermal deactivation should be achieved under the real exhaust conditions. Ce0.35Zr0.50Y0.075La0.075can become new generation oxygen storage material and be widely used in TWCs. This novel oxygen storage material can be satisfied with rigorous emission regulations of vehicle exhaust.
ACKNOWLEDGMENTS
This project is financially supported by the National Nature Science Youth Fund of China (Grant No. 21173153). We would like to thank Professor Zhu, College of Materials Science and Engineering, Sichuan University for XRD measurements, and Dr. Wu, Analytical and Testing Center, Sichuan University for Raman spectra characterization.