I. INTRODUCTION
Today, the study of systems at nanoscale has devoted a large area of research work to itself, because of the unique physical, chemical, and structural properties appearing in these groups of materials. Reference Shi1–Reference Liao4 As an example, nanocrystalline materials melt at temperatures lower than the melting temperatures of coarse-grain polycrystals. The reason for this behavior is the presence of high volume fraction of grain boundaries (GBs) in nanocrystals and probably, premelting of these regions. With regard to the fact that each grain enjoys different crystallographic orientations in nanocrystalline materials, different boundary regions such as GBs, triple-junctions (TJs), and quad nodes (QNs) (or higher) have significant structural disorders relative to the grains. Therefore, the idea of premelting at GBs stems from a structure similar to melt at a temperature significantly lower than the normal melting temperature. Yet, due to the very small width of the different regions of the grain boundary and the need for in situ tests, direct experimental observations of premelting and study of the melt behavior are very difficult in nanocrystals, since it requires high precision and definition tools. Therefore, the tendency to perform atomic simulations as a suitable substitute for the study of the behavior of nanocrystals is growing. But, in spite of extensive studies performed in the area of melting behavior in nanoparticles Reference Zhang, Lu and Jiang5–Reference Luo, Su, Li, Liao, Hu and Jia10 and in bicrystals, Reference Broughton and Gilmer11–Reference He, Duan, Shao, Wang and Qin16 significant and systematic studies have not been performed on the disorders of the solid state and on the nature of melting at different regions of grain boundary network in polycrystalline materials and also on the effect of the average grain size on the melting temperature of the nanocrystals. Therefore, the present research is devoted to the study of the behavior of melting in Al nanocrystals with different grain sizes and to the study of the effect of the structural disorders of different regions of the grain boundary network on melting. Thus, after explaining simulation method and recognizing the conditions of the samples, first the results were obtained from perfect crystal simulation and then Al nanocrystals were studied. Also, in continuation, to justify the obtained results, the role of the atoms of different regions of grain boundary network in the melt of Al nanocrystals is separately studied.
II. SIMULATION METHODS
Al nanocrystalline samples (with GBs of high angle) with an average grain size of 1–10, 12, 14, and 16 nm were made by using Voronoi tessellation method. To study the effect of the grain size on the behavior of the melt, the samples were made in a way which by increasing the grain size, the number of grains (60 grains) and atoms orientation in the same grains was constant. Atomic simulations on fabricated samples were performed using LAMMPS molecular dynamics code (http://lammps.sandia.gov) and under 3D periodic boundary conditions in the isothermal-isobaric (NPT) ensemble. Interaction among the atoms was also predicted by the use of Finnis–Sinclair potential. Reference Mendelev, Kramer, Becker and Asta17 To remove high-energy regions, the initial configurations were relaxed using energy minimization method. Then, the samples were heated with the heating rate of 100 K per 500 ps in the range of ambient temperature to the temperatures over melting point. The heating temperature intervals for low temperatures and near the melting point were set at 50 and 20 K, respectively. Equations of motion were integrated using Verlet algorithm with a step size of 1 fs. It should be noted that to study the effect of grain size, all the samples were simulated in a way in which the grain size did not grow by time. Indeed, we used Voronoi tessellation method in such a way that GBs are not curved (nonequilibrium structure). Therefore, this condition in addition to the high heating rate prevented from growth of grains during temperature increase. Hence, because of the type of structure used in the simulations and also the high heating rate, the results for melting temperature of nanocrystalline samples are in a nonequilibrium condition. Obviously, if we let grain growth to occur, the samples will melt exactly at the melting point for perfect crystal that is not our purpose. In reliable experiments, we can also use methods such as spark plasma sintering to see the same phenomenon. In the other method, Xiao et al. Reference Xiao, Hu and Yang18 used tentative tessellation method to study the effect of grain size on general melting temperature of nanocrystalline materials.
Also, to compare the results, a perfect crystalline solid (with 2000 atoms) and also an amorphous sample resulting from quenching from higher than the melting temperature (1500 K) at 0.002 K/fs were studied in the same conditions.
Melt behavior and structural disorders of various samples have been studied using calculation of physical and structural calculations including enthalpy (or potential energy), Reference Dalgic and Domekeli19,Reference Han, Shuai, Lu and Meng20 density (or volume), Reference Chen, Ouyang and Ching21,Reference Puri and Yang22 order parameter, Reference Morris and Song23,Reference Delogu24 Lindemann index, Reference Puri and Yang22,Reference Shibuta and Suzuki25,Reference Neyts and Bogaerts26 and radial distribution function (RDF). Reference Puri and Yang22,Reference Morris and Song23 The calculation of local and global order parameters was performed by the use of Morris and Song method Reference Morris and Song23 rendered for crystals with specific orientation in contact with the melt. In this method, a collection of N q wave vectors is selected in a way that:
 $$\exp \left( {iq \cdot r} \right) = 1\quad ,$$
where r is a vector connecting the closest neighbors together in a perfect fcc lattice. Because of the fcc structural symmetry, only one of each pair of the parallel wave vectors in opposite direction has been taken into consideration, so N q = 6. Therefore, the local order parameter for one atom (ψi) is calculated by using Eq. (2) and the global order parameter (ψ) is calculated by averaging the total number of atoms.
 $${\psi _i} = {\left| {{1 \over {{N_q}}}{1 \over Z}\sum\limits_r {\sum\limits_q {\exp \left( {iq \cdot r} \right)} } } \right|^2}\quad ,$$
where Z is the number of the nearest neighbors for each atom. Reference Morris and Song23
Considering nanocrystalline materials, atoms in different grains have different orientations, therefore, to calculate the local order parameter for each atom in nanocrystalline samples, it is required that the atoms orientation in each grain be extracted and the q vectors allocated to each grain atoms. Hence, in the present research, the orientation of atoms in the grains during production of nanocrystals was used as the reference orientation for the calculation of the order parameter. In fact, the best reference orientation was considered to be equal to the lowest angle assigned to the atoms of each grain. Therefore, it is possible to attribute a specific orientation to each atom with a specific id. By annealing nanocrystalline samples and increasing temperature, atomic disorder can be distinguished by changing the orientation connecting to their nearest neighbors. It is obvious through comparison with the initial state. Therefore, q vector is equal to the number of grains. The q vectors for the perfect fcc crystal were calculated according to Eq. (3) and then, the q vectors related to the atoms of each grain with specified orientation were determined using Euler angles rotation matrix.
 $$\eqalignb{ & {q_1} = \left[ {0,2\pi /a,2\pi /a} \right],\;{q_2} = \left[ {0,6\pi /a,2\pi /a} \right],\;\cr & {q_3} = \left[ {2\pi /a,0,2\pi /a} \right],\;{q_4} = \left[ {6\pi /a,0,2\pi /a} \right],\; \cr & {q_5} = \left[ {2\pi /a,2\pi /a,0} \right],\;{q_6} = \left[ {2\pi /a,6\pi /a,0} \right]\quad . \cr}$$
The local (δi) and global (δ) Lindemann indexes for a system are also calculable as follows:
 $${\delta _i} = {1 \over {N - 1}}\sum\limits_{j \ne i} {{{\sqrt {{{\left\langle {r_{ij}^2} \right\rangle }_T} - \left\langle {{r_{ij}}} \right\rangle _T^2} } \over {{{\left\langle {{r_{ij}}} \right\rangle }_T}}}} \quad ,$$
 $$\delta = {1 \over N}\sum\limits_i {{\delta _i}} \quad ,$$
where
 ${\left\langle {...} \right\rangle _T}$
is the thermal average at temperature T and r
ij
is the distance between i and j atoms.
Reference Puri and Yang22
III. RESULTS AND DISCUSSION
A. Melting phenomenon in perfect Al crystal
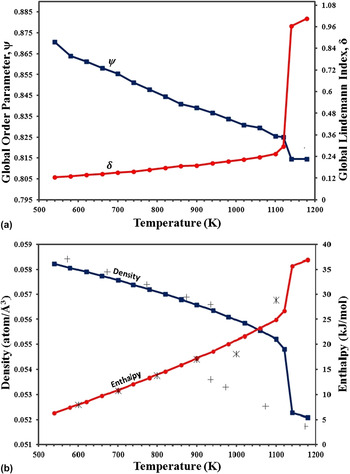
In this section by calculating the order parameter, Lindemann index, density, and enthalpy for a perfect crystal (coarse-grain polycrystal), the melting temperature conditions are studied based on the structural disorder. As illustrated in Figs. 1(a) and 1(b), at 1140 K, there is a significant change in physical and structural properties of Al perfect crystal. To compare the results with experimental data, it has been assumed that enthalpy at 298.15 K is equal to 0. These changes caused an increase in Lindemann index and enthalpy and a drop in the order parameter and density. Since at temperatures before and after 1140 K, physical and structural properties were changed slightly versus temperature, the temperature of 1140 K could be considered as the melting temperature under these simulations. With regard to the fact that in conventional polycrystalline materials, the volume fraction of the GBs is negligible, therefore, it is expected that the predicted temperature is approximately equal to the Al melting temperature from used potential (926 K), while in practice, the predicted temperature is about 22% above the experimental temperature. Studies Reference Yip27–Reference Jin, Gumbsch, Lu and Ma29 in recent decades have shown that due to the use of periodic boundary conditions, surface effects have been removed and therefore melting occurred homogeneously at a temperature higher than the experimental melting point. It is worth to mention that we also cooled the perfect crystal sample from higher than melting point to 300 K. The results showed that the freezing point is equal to 650 K. The average temperature between the freezing and melting temperatures is about 895 K, which is near to the actual phase transition temperature (926 K). Also, the sharp gradient in enthalpy diagram (melting latent heat) is approximately equal to 11.8 kJ/mol which is in good agreement with the experimental value (11.09 kJ/mol). It is required to mention that the calculation of the melting latent heat was done by adapting the second-order polynomials to the enthalpy simulation results before and after melting.
Temperature changes of (a) global order parameter and global Lindemann index, (b) density and enthalpy for Al perfect crystal. (For comparison, experimental data for density and enthalpy Reference Mills30 are also shown.)

B. Melting phenomenon in Al nanocrystals
1. The effect of the average grain size on the nonequilibrium melting temperature
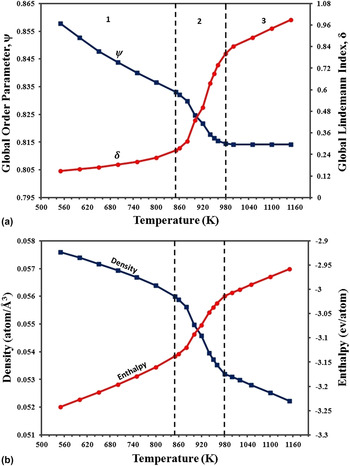
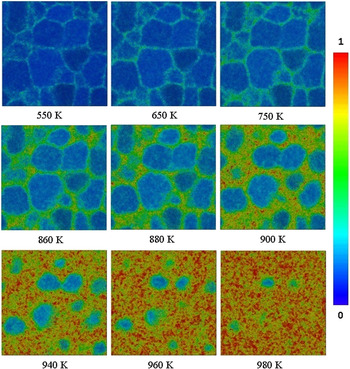
Figure 2(a) shows the order parameter and Lindemann index changes versus temperature and Fig. 2(b) shows the density and enthalpy changes versus temperature for an Al nanocrystalline sample with 8 nm grain size. The obvious changes in the above parameters for Al nanocrystalline sample at 980 K represent the complete melting of the nanocrystal at this temperature. As it is observed, it is possible to clearly divide the melting process into three stages. In the first stage where the temperature was below 850 K, as the temperature increased, the order parameter and the density decreased, but on the contrary, the Lindemann index and the enthalpy increased linearly and slowly, which is attributed to the linear increase in kinetic energy with temperature. The values of the aforementioned parameters represented a solid state. During the process of the second stage (850–980 K), reduction in the order parameter and the density and also an increase in Lindemann index and enthalpy occurred nonlinearly and fast (compared to the first stage). This behavior can be justified by the results obtained from the calculation of local Lindemann index for each atom at the end of each temperature (Fig. 3). It is worth mentioning that the calculations obtained from the local order parameter also showed similar results that the results are not presented here to avoid repetition. Figure 3 shows the local disorders produced in the Al nanocrystalline sample with 8 nm grain size versus temperature. As it is observed, by an increase in temperature the melt started to nucleate at boundary regions in the beginning (from higher bonds) and by further increase in temperature and near the melting point, the disorder extended to the intergranular regions. Finally, the complete melting of the nanocrystal was clearly visible at 980 K. Therefore, it can be said that in the beginning of the second stage, the premelting of the regions started at QNs and TJs and by reaching the temperature over 850 K, the kinetic energy of the atoms in the boundary regions grew to an amount that could overcome the energy of atoms bond and diffuse along the grain boundary. Therefore, at this stage, extreme changes were observed in the system parameters. The third stage is also a high-temperature region where melting completely took place. It could be concluded that contrary to the perfect crystal (Fig. 1), the melting of nanocrystal occurred within a range of temperature and not at a specific temperature (Fig. 2).
Temperature changes of (a) global order parameter and global Lindemann index, (b) density and enthalpy for Al nanocrystal with 8 nm grain size.

Temperature changes of local Lindemann index for Al nanocrystal with 8 nm grain size.

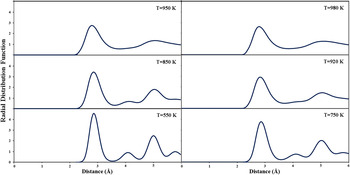
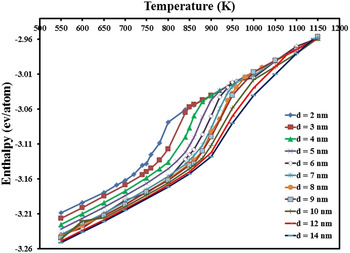
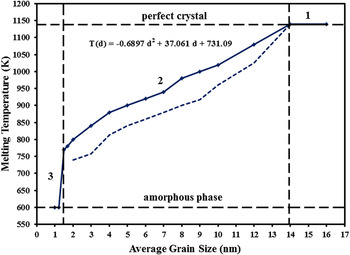
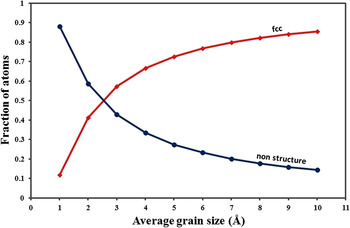
Also, the RDF was used to specify the structural disorder effects. The obtained results depicted in Fig. 4 confirmed that the nanocrystal melted at 980 K. It should be noted that the above studies have been done for all the nanocrystalline samples with the grain sizes of 1–10, 12, 14, and 16 nm. As an example, the results related to enthalpy are presented in Fig. 5. The comparison of the results obtained for nanocrystalline samples of different grain sizes with the perfect crystal is an indicator of the nanocrystalline samples melting at lower temperatures comparing to the perfect crystal (Fig. 6). It is done in a way in which for the nanocrystalline sample of the average grain size of 2 nm, the melting temperature reduced from 1140 ± 20 K to 800 ± 20 K which is approximately equal to 70% of the perfect crystal melting point. Also, by an increase in the grain size, the melting point deviation from the perfect crystal melting point has been reduced, so that for samples with greater grain size than 14 nm or equal to it, the melting point is constant and remains equal to the perfect crystal melting point. Another noticeable point is that by a reduction in the grain size to about 1 nm, the melting point is severely reduced at once and for the grain size of 1 nm, the melting point reached about 600 K. Therefore, it is clearly possible to divide the melting point diagram into three regions in terms of the grain size. The first region which is called the coarse-grain region is where the nanocrystal showed a behavior similar to a perfect crystal and was independent of the grain size. Also, in the middle region, the melting temperature changed slightly and nonlinearly according to the quadratic equation shown in the figure. Also, to justify the abnormal behavior of the melting temperature at the third region, the volume fraction of fcc atoms as well as nonstructured atoms has been studied in terms of the grain size. As it is observed in Fig. 7, by a reduction in the grain size to about 1 nm, the volume fraction of the nonstructured atoms (atoms located at the interface regions) increased intensely. Therefore, it might be concluded that for the grains with small size, nanocrystals showed a behavior similar to amorphous phase. Hence, the critical grain size could be defined in a way that for the grains which are smaller than this critical size, the nanocrystal showed a behavior similar to the amorphous phase obtained from liquid quenching. It is obvious that this critical size is a value between 1 and 2 nm for Al nanocrystal.
RDF diagrams of Al nanocrystalline sample with 8 nm grain size at different temperatures.

Enthalpy diagrams in terms of temperature for Al nanocrystals with different grain sizes.

Nonequilibrium melting temperature changes for Al nanocrystalline samples in terms of the average grain size (solid-line: complete melting temperature, dashed line: start of premelting).

Volume fraction of atoms with fcc structure and atoms without structure for Al nanocrystals with different grain sizes.

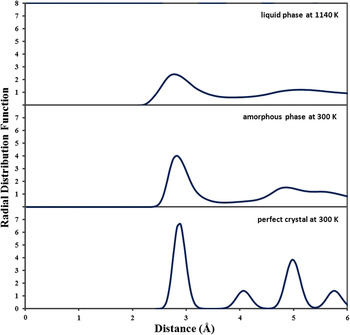
To calculate the critical grain size, nanocrystalline samples of 1.2, 1.3, 1.5, and 1.7 nm and an amorphous sample were studied. To identify the structure of the amorphous sample, the RDF diagrams of amorphous phases, liquid, and perfect crystal were compared. As it is observed in Fig. 8, while the peaks of the amorphous samples are flattened in RDF diagram, the first, the third, and the fourth peak of the RDF diagram related to the perfect crystal appear and the second peak disappears; in the liquid RDF diagram, the height of the highest peak was near to 1 and the peaks are disappeared. Therefore, it was concluded that the amorphous sample has a structure between perfect crystal and liquid. The diagrams resulting from the calculation of the system parameters for the amorphous sample indicated the melting temperature at 600 K. The simulations performed for the nanocrystalline samples with grain sizes between 1 and 2 nm had shown that for the grain size of 1.3 nm, the behavior of the melt was similar to that of an amorphous phase. Therefore, the grain size of 1.3 nm could be considered as the critical grain size for pure Al. With regard to the fact that the crystal lattice parameter, a, of Al is equal to 4.04527 Å, this critical grain size was about three times greater than the lattice parameter (12.13 Å) which was fully in agreement with the results obtained by Xiao et al. Reference Xiao, Hu and Yang31
RDF diagrams of perfect crystal, amorphous phase, and liquid phase for Al.

2. The effect of the average grain size on the nonequilibrium enthalpy of melting
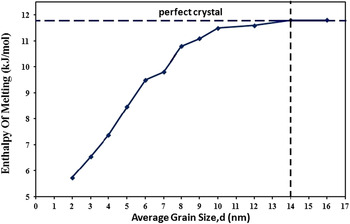
In addition to the effect of the grain size on the nonequilibrium melting temperature, the melting latent heat also showed a deviation from the perfect crystal by a decrease in the grain size. The results of the calculations related to the melting enthalpy versus the grain size for Al are depicted in Fig. 9. As it is observed, the latent heat is equal to that of the perfect crystal for nanocrystalline samples with the grain size of more than 14 nm. It is worth mentioning that due to the atomic disorders presented in the amorphous samples, the enthalpy diagrams experienced great fluctuations versus temperature for these samples and therefore, it was not possible to calculate the precise value of the melting latent heat.
Nonequilibrium melting enthalpy changes for Al nanocrystalline samples in terms of the average grain size.

Considering the above results, it seemed that the difference in melting behavior of the nanocrystals and the perfect crystal was due to the presence of the high volume fraction of the grain boundary regions in these samples. Thus, by identifying the atoms of different regions of the grain boundary network, the structural disorders during heating at different boundary regions were studied.
3. Melting behavior at different regions of nanocrystals
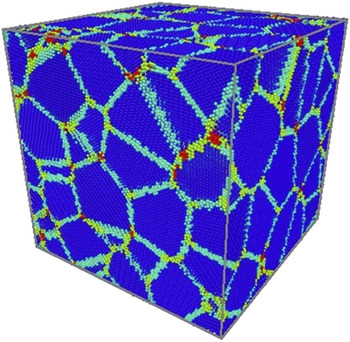
In this section, the premelting point of different regions of the nanocrystal, including grains, GBs, TJs, and QNs (or over) is calculated. Hence, by the use of the outward layering method, Reference Xu and Li32,Reference Li and Xu33 the atoms of different regions of the nanocrystals are separated from each other. Figure 10 shows the Al nanocrystalline sample with 8 nm grain size consisting of 60 grains that atoms are identified by this method.
Al nanocrystalline sample with 8 nm grain size (with 60 grains) that atoms are identified by outward layering method (blue: grain atoms, green: grain boundary atoms, yellow: triple junction atoms, and red: quad node atoms).

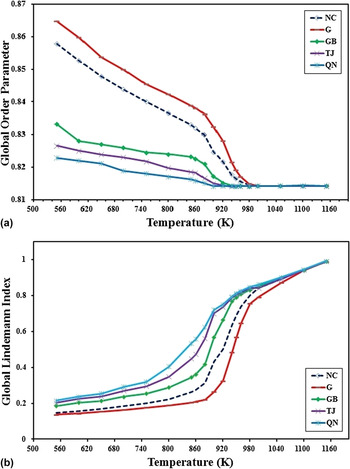
Considering the fact that in the previous stage the order parameter and Lindemann index for each atom were calculated, the global properties of different regions have been obtained in terms of temperature by averaging the atoms of each region. The results obtained for Al nanocrystal with 8 nm grain size are shown in Figs. 11(a) and 11(b). It should be mentioned that when the sample is melted (or near melting), the melt structure considered the same for all regions. As it is observed, also like the whole nanocrystal and in contrast to the perfect crystal, the structural disorders occurred within a range of temperature in different regions of the grain boundary network. In justifying this behavior, it should be considered that these regions are also disordered at temperatures far lower than the melting point (relative to the perfect crystal structure) and by an increase in temperature and approaching the melting point, this disorder would be increased. We consider the start temperature of changes in structural disorders as the premelting temperature of the GB region. With regard to Fig. 3, it is qualitatively observed that this idea can be right. Indeed, it can be concluded that the GB region started to premelt at this temperature, and finally is melted completely at the melting temperature of nanocrystalline sample. The results of the premelting temperature (T pm) and volume fraction (X) of different nanocrystalline samples are presented in Table I. Since the grain atoms were the last atoms that melted, the grain melting temperature was considered as the melting temperature of the nanocrystal.
Temperature changes of (a) order parameter and (b) Lindemann index for different regions of Al nanocrystalline sample with 8 nm grain size.

Premelting temperature and volume fraction of different regions for Al nanocrystalline samples with 2–10 nm grain sizes.

Another interesting point was the fact that the different regions of the boundary network melted at temperatures different from amorphous phase melting temperature (600 K). Also since their melting temperature changed with a change in grain size, it could be concluded that the structure of different regions of the grain boundary in nanocrystalline materials is not similar to amorphous phase.
Therefore, with regard to the role of the structural disorders of the grain boundary regions in determining the melting point of the nanocrystals, the local disorders of different regions of grain boundary would be discussed separately.
4. The manner of local disorder changes in different regions of grain boundary
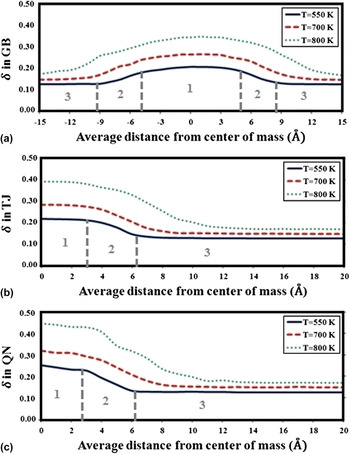
To study the manner of disorder changes in different regions of the grain boundary network, the local Lindemann index changed in terms of the distance from the mass center at different temperatures is shown in Fig. 12. It is obvious that each of these diagrams could be divided into three regions. In the first region, the Lindemann index changed slowly and it can be considered as the central area of the grain boundary region. Along the second region, the increase of Lindemann index is very fast and nonlinear. In fact, this region was affected by the boundary regions. The third region also showed the region related to the grain in which the order level increased compared to the previous regions and then it changed gently in terms of distance. This type of classification for 550 K is roughly shown in Fig. 12. It is worth mentioning that the calculations related to the order parameter changes also presented the same results. Also as it is observed, by an increase in temperature, the amount of order level in the above regions has decreased denoting that the structure has approached the melt state. It could be concluded that the disordering of the grain boundary regions did not take place at once, and an increase in temperature, gradually melted the boundary regions. Moreover, with regard to the fact that the order reduction in boundary regions was faster than in the grain region, premelting of the boundary regions at lower temperatures than the grain melting temperature was obvious.
Changes of Lindemann index in terms of the average distance from center of mass (a) in GBs, (b) in TJs, and (c) in QNs for Al nanocrystals with 8 nm grain size.

IV. CONCLUSIONS
In general, the above issues can be summarized as follows:
-
(1) By a decrease in the grain size in nanocrystals, the nonequilibrium melting temperature and melting were reduced. In fact, the changes occurred in a manner that by a decrease in the grain size up to less than 1.3 nm for Al, the nanocrystal melted at temperatures similar to the amorphous solid phase. Also, by an increase in the grain size, the nonequilibrium melting temperature and melting enthalpy increased with moderate changes within the range of the grain sizes of 1.3–14 nm. For nanocrystals of 14 nm and higher grain size, the nonequilibrium melting temperature and melting enthalpy were also stable and equal to the values of a perfect crystal.
-
(2) For nanocrystals with grain size of less than a critical value, the nanocrystal changed into an amorphous phase. The results have shown that this critical grain size was about three times the crystal lattice parameter.
-
(3) Reduction of the melting temperature and melting enthalpy of the nanocrystalline samples compared to a perfect crystal was due to disorder and premelting of different regions of grain boundary in these nonequilibrium samples. In fact, by an increase in nanocrystalline materials' temperature, at first the melt nucleates at QNs and TJs discontinuously, and then by distributing the disorders into the grain boundary and finally into the grains, complete nanocrystal melting took place.
-
(4) Premelting and melting at grain boundary regions did not take place instantly, but an increase in temperature and in disorder rate gradually led to the melting of GBs.
-
(5) The structure of different regions of grain boundary was not similar to amorphous phase.
ACKNOWLEDGMENTS
This study has been carried out in the Particulate Materials Research Groups (Department of Materials Engineering, Isfahan University of Technology) and National High Performance Computer Center (http://nhpcc.iut.ac.ir). The authors are grateful for their support for this work.