Introduction
Cocoa (Theobroma cacao L., Malvaceae) is a native tree from tropical rainforest of South America (Motamayor et al., Reference Motamayor, Risterucci, Lopez, Ortiz, Moreno and Lanaud2002). Cocoa represents one of the commercially most important perennial crops worldwide, with an estimated global output of 4.75 million tons in 2019 and a yield greater than 600 kg/ha (ICCO, 2020). Venezuela is part of a select group of countries in America producing fine aroma cocoa, which together account for about 7% of total world production (ICCO, 2020). Cocoa activities and production in Venezuela are very low; therefore, the search for new strategies to recover cocoa productivity is required.
The increasing food demand due to the growth of world population has driven the large-scale use of traditional fertilizers. Due to resource limitations and the low efficiency of fertilizer usage, the cost to farmers is dramatically increased (Raliya et al., Reference Raliya, Saharan, Dimkpa and Biswas2017). Foliar fertilization has been used to supply nutrients, hormones, biostimulants, and other substances that are beneficial to plants, which usually results in an increase in growth, yield, and quality, and greater resistance to pests and diseases (Fernández et al., Reference Fernández, Sotiropoulos, Brown, Melgar and Fernández2015). One of the benefits of the applications of foliar nutrients is that the constant application, which allows adjusting the formula and dosing the fertilizer, avoiding the use of high concentrations that could generate an environmental impact (Morales-Díaz et al., Reference Morales-Díaz, Ortega-Ortíz, Juárez-Maldonado, Cadenas-Pliego, González-Morales and Benavides-Mendoza2017).
Foliar fertilizer applications imply that nutrients supplied must be absorbed and exported from the leaf surfaces to the mesophyll tissue (Monreal et al., Reference Monreal, DeRosa, Mallubhotla, Bindraban and Dimkpa2015). Leaf fertilizer nutrients move through leaf cuticle, stomatal pore, trichomes, or others epidermis structures; however, only small amounts of nutrients move through stomatal pores (<10%), because they represent a small proportion of the total leaf area (Fernández et al., Reference Fernández, Sotiropoulos, Brown, Melgar and Fernández2015).
Nanotechnology is defined as the research and technological development on a scale of 1 to 100 nm (nanoparticles) using atoms, molecules, or macromolecules (Raliya et al., Reference Raliya, Saharan, Dimkpa and Biswas2017; Ram et al., Reference Ram, Kumar, Rawat, Pandey and Singh2018). Nanotechnology may be the key to the evolution of the science of precision agriculture, it is emerging as a promising strategy that offers great potential to adapt the production of fertilizers with the desired chemical composition, improve water and nutrient use efficiency, reduce environmental impact, and increase productivity of crops (Morales-Díaz et al., Reference Morales-Díaz, Ortega-Ortíz, Juárez-Maldonado, Cadenas-Pliego, González-Morales and Benavides-Mendoza2017; Raliya et al., Reference Raliya, Saharan, Dimkpa and Biswas2017; Wang et al., Reference Wang, Jin, Xu, Miao, White, Gardea-Torresdey, Ji and Zhao2020).
Nanoparticles (NPs) have exhibited significant potential for promoting photosynthesis and enhancing crop productivity, therefore understanding the fundamental interactions between NPs and plants is crucial for the sustainable development of agriculture (Wang et al., Reference Wang, Jin, Xu, Miao, White, Gardea-Torresdey, Ji and Zhao2020). Recently, it has been shown that NPs are an attractive alternative for the manufacture of nanofertilizers (NF), which are nutrient compounds of nanostructured formulations that can be applied to plants, allowing efficient absorption or slow release of micronutrients, macronutrients, fungicides and insecticides, and thus are more effective and efficient than traditional fertilizers due to their larger impact on the nutritional quality and stress tolerance of crops (Elsheery et al., Reference Elsheery, Sunoj, Wen, Zhu, Muralidharan and Cao2020; Morales-Díaz et al., Reference Morales-Díaz, Ortega-Ortíz, Juárez-Maldonado, Cadenas-Pliego, González-Morales and Benavides-Mendoza2017; Raliya et al., Reference Raliya, Saharan, Dimkpa and Biswas2017).
A large number of studies related to the use of NF in an exhaustive number of crops species have been reported (Elsheery et al., Reference Elsheery, Sunoj, Wen, Zhu, Muralidharan and Cao2020; Raliya et al., Reference Raliya, Saharan, Dimkpa and Biswas2017); however, plant physiological responses to NF application are scarce, especially, the effects of application of SiO2 nanofertilizers (SiO2-NF) in cocoa. Application of foliar Si in cocoa plants subjected to water deficit caused an increase in photochemical efficiency, whereas stomatal conductance (gs), transpiration rate (E), and relative water content (RWC) decreased in non-irrigated plants at specific SiO2 concentrations (Zanetti et al., Reference Zanetti, Milanez, Gama, Aguilar, Souza, Campostrini, Ferraz and Figueiredo2016). Nano-silica confers tolerance to salt stress on tomato (Haghighi and Pessarakli, Reference Haghighi and Pessarakli2013), tolerance to drought in wheat and SiO2 nanoparticles mitigate chilling effects on photosynthesis and photoprotection in sugarcane, contributing to the increase of net photosynthetic rate (A), biomass production, photosynthetic pigments and TSP concentration, and RWC (Ahmed et al., Reference Ahmed, Qadeer, Ahmed and Hassan2016; Elsheery et al., Reference Elsheery, Sunoj, Wen, Zhu, Muralidharan and Cao2020; Raliya et al., Reference Raliya, Saharan, Dimkpa and Biswas2017).
There is an interest in studying ecophysiological traits in some Venezuelan cocoa clones (Ávila-Lovera et al., Reference Ávila-Lovera, Coronel, Jaimez, Urich, Pereyra, Araque, Chacón and Tezara2016, Reference Ávila-Lovera, Blanco, Móvil, Santiago and Tezara2021; De Almeida et al., Reference De Almeida, Herrera and Tezara2018; Tezara et al., Reference Tezara, Urich, Jaimez, Coronel, Araque, Azocar and Chacón2016, Reference Tezara, Pereyra, Ávila-Lovera and Herrera2020). However, the effect of specific NF, using SiO2 nanoparticles as nutrients vehicle (SiO2-NF), on the physiological traits of cocoa plants is largely unknown. In order to gain knowledge on the effect of SiO2-NF spray frequency on photosynthetic activity of two cocoa clones, we evaluated gas exchange, photosynthetic pigments and nutrient concentration, photochemical activity of PSII, and photosynthetic nitrogen and phosphorus use efficiency of two Criollo cocoa clones (OC-61 and BR-05), and whether there is a differential physiological response to spraying with SiO2-NF between the two clones. We expected positive effects of SiO2-NF spray on photosynthetic activity in both clones, which may contribute significantly to the incorporation of nutrients, especially those related to photosynthesis.
Materials and Methods
Plant material and growth conditions
The study was carried out in a greenhouse at the ‘Las Bromelias’ farm in Cumboto, Central coast, Venezuela (10° 25ʼ 10.3" N and 67° 46ʼ 48.2" W) at 500 m asl. Saplings of the two cocoa clones, Ocumare 61 (OC-61), and Bromelia 05 (BR-05) tested in this study were obtained by cuttings grafted onto OC-61 rootstock and planted in 5 kg bags of sandy soil from the banks of a nearby river. All plants were fertilized with N:P:K 15:15:15 once a week to ensure their growth and establishment before starting the experiments. A new exhaustive classification of cocoa germplasm has been proposed in ten genetically differentiated groups, where Criollo cocoa is one of them (Motamayor et al., Reference Motamayor, Lachenaud, Wallace, Loor, Kuhn, Steven and Schnell2008). Cocoa clones were selected based on their high productivity, presence of Criollo cocoa traits, and their presence within the study area: OC-61 is a modern Criollo, that is, a hybrid between Criollo and Forastero cocoa that differs in quality, vigor, and yield, and has many Criollo morphological traits such as high quality and fine flavor (Motamayor et al., Reference Motamayor, Risterucci, Lopez, Ortiz, Moreno and Lanaud2002); BR-05 is a new selection with characteristics of Criollo generated in the “Las Bromelias” farm.
Experimental design
Three blocks (one control and two spray frequencies with SiO2-NFs) of 30 m2 area shaded to 30% of sunlight with the use of neutral polythene sheets were established in the greenhouse, and each block consisting of 30 plants: 15 plants per clone 50 cm apart (3 m × 2.5 m), with a distance of 2 m between blocks. Plants were rotated weekly in each treatment within and between blocks, thus avoiding possible block and edge effects.
Plant treatments
Seven months after grafting, saplings of both clones of similar number of leaves and height (approximately 50–60 cm) were subjected to a 35-day long treatment of two foliar spray frequencies with 25 mL NF per plant with a constant concentration of 11 μmol mol–1 nanostructured SiO2-NFs suspended in water, as follows: (1) low frequency application, LF (spray SiO2-NFs every 15 days); (2) high frequency application, HF (spray SiO2-NFs every 7 days), and (3) control (C) plants without application of SiO2-NFs.
The fertilizer is a nanocomposite of silicon dioxide (SiO2) nanoparticles doped with different elements. The SiO2 nanoparticles encapsulated fertilizer composites (SiO2-NF) consisted of SiO2 doped with 0.025% Co, 0.025% B, 0.025% Mo, 0.35% Mg, 0.15% Fe, 0.15% Cu, 0.10% Mn, 0.25% Zn, 0.35% Ca, and 0.20% S, and coated in a chitosan matrix (N:P:K 15:15:15).
The SiO2 NPs were synthesized from rice husks (RHs). The RHs were washed and lixiviated in an aqueous solution of HCl 1% m/v for 24 h. Then, the lixiviated RHs were rinsed with water until pH 7, and dried in an oven at 110°C. The dried RHs were heated to 500°C for 1 h and 700°C for 9 h with a ramp of 500°C/h, and the resulting white solid was ball-milled until obtaining nanometric distribution (1–100 nm), which was verified by dynamic light dispersion (DLS) technique.
Nanocomposites were prepared by wet impregnation methods. SiO2 NPs were impregnated with different metal ion salts (FeCl3, CaCl2, MgCl2, and CuSO4) in the minimum quantity of water. Once the impregnation process ended the mixture was dried and heated to 350°C. The salt concentration warrantied 30% of weight of metal in the SiO2 nanoparticle.
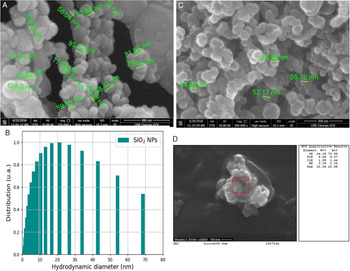
Figure 1 shows images obtained by scanning electron microscopy (SEM) and DLS data for the raw SiO2 nanoparticles. The DLS signal data is more accurate and showed a wide size distribution for the NPs of an approximate size of 34 nm and SiO2 NPs stabilized with chitosan. The variation in the size distribution is too small to be considered further.
A, Scanning electron microscopy (SEM) images of SiO2 NPs from rice husks ash; B, SiO2 NPs DLS signal; C, SiO2 NPs with Chitosan; D, SiO2 NPs doped with iron.

Silicon nanoparticles and mesoporous aluminosilicates have important properties such as highly ordered channels with high accessible porosity (with diameters between 2 and 50 nm, according to the chemical compound nomenclature system, IUPAC), large surface areas, active sites for adsorption, ion exchange, and catalysis (Monreal et al., Reference Monreal, DeRosa, Mallubhotla, Bindraban and Dimkpa2015; Wu et al., Reference Wu, Wang, Zhuang, Sun, Wang and Zhu2008).
All plants were placed on benches at a height of 50 cm above the ground to avoid soil nutrient uptake by roots.
Soil characteristics
Soil from the banks of a nearby river used in the study was sandy loam, slightly acidic (pH = 6.4) and not saline (cation exchange capacity of 1.3 mΩ, and composed of 77.5% sand, 12.5% loam, and 10% clay). The soil had high concentration of Si (13.2 mol kg–1). High concentration of K, Mg, and Ca (42, 215 and 148 mmol kg–1, respectively), low concentration of P (0.13 mmol kg–1), and no N were detected in the irrigation water.
Microclimatic measurements
Air temperature and relative humidity in the greenhouse were measured throughout the experiment with two HOBO Pro V2 loggers and data stored in a HOBO Waterproof Shuttle (Onset Computer Corporation, Pocasset, MA, USA). Photosynthetic photon flux density (PPFD) was measured with a quantum sensor and a light meter (LI-250, LI-COR Inc., Lincoln, NE, USA). Leaf and soil temperature were measured with thermistors (YSI 04B0618-409B) connected to a Switch Craft LN4153-405 (8402-10, Cole-Parmer Instrument Company, IL, USA) and connected to a telethermometer (Yellow Springs Instruments Co, Texas, USA). With data of temperature and relative humidity, leaf-to-air vapor pressure deficit (ΔW) values were calculated. Microclimatic variables were measured every hour between 07:00 and 17:00 h.
Leaf and soil nutrients concentration
Nutrient concentration was determined in the leaves used for the determination of photosynthetic pigments. Fresh mass (FM) of the leaves was recorded when they were collected, next they were washed with deionized water and dried in a ventilated oven at 60 °C until reaching a constant dry mass (DM). The leaves were ground to a powder and acid digestions (sulfuric and perchloric acid with a 4:1 ratio) were done on a digester block (Digestion Kjeltec System 40–1016, Tecator, Sweden). Total phosphorous concentration (P) was determined according to Murphy and Riley (Reference Murphy and Riley1962); major cations (Na+, K+, Ca+2, and Mg+2) were determined by flame atomic absorption (SpectrAA 55B, Varian, Australia). The total organic nitrogen concentration was determined according to the microKjeldahl method (Jackson, Reference Jackson1958). The leaf and soil Si concentration was determined by X-ray diffraction using a Quanta FEI 2501 Scanning Electron Microscope with an EDAX/EDX detector.
Physiological variables
Physiological measurements were made on the third mature, fully expanded leaf of seven plants per clone per treatment. Measurements were carried out at the beginning of the experiment (day zero) and every 7 days after the application of sprays with SiO2-NFs during 35 d. Samples of leaf, soil, and water used for irrigation were collected to determine macronutrient concentrations at the beginning (day zero) and at the end of the experiment (day 35). Aluminum sheets were placed in the base of the stem of the plant (on the ground), to avoid the incorporation of nutrients from the SiO2-NFs to the soil throughout the study.
Gas exchange
Measurements of leaf gas exchange were made in intact leaves with a portable infrared gas analyzer (CIRAS-II, PP Systems Inc., Amesbury, MA, USA) connected to a leaf chamber PLC (B) at a CO2 concentration of 410 ± 10 μmol mol–1, a leaf chamber temperature of 28.0 ± 0.5∘C, a ΔW of 1.25 ± 0.017 kPa and a PPFD of 1000 μmol m–2 s–1 (light provided by a LED-based light unit from the same manufacturer). Water use efficiency was calculated as WUE = A/E. Measurements were taken from 10:00 to12:00 h because it was previously determined that maximum rates of photosynthesis are attained during this period (De Almeida et al., Reference De Almeida, Herrera and Tezara2018).
Photosynthetic pigment and total soluble protein concentration
Leaf chlorophyll and carotenoid concentrations were determined in 80% chilled acetone extracts of leaf discs of known area in leaves (n = 7), after Wellburn (Reference Wellburn1994). Total soluble protein concentration (TSP) was determined in leaves (n = 7) using a standard protocol (Bradford, Reference Bradford1976).
Specific leaf area
Specific leaf area (SLA) was calculated as the ratio between leaf area and dry mass in seven individuals per clone using a protocol described by Tezara et al. (Reference Tezara, Pereyra, Ávila-Lovera and Herrera2020).
Photochemical activity
Photochemical activity of PSII was determined by fluorescence measurements of chlorophyll in intact leaves of seven plants (one leaf per plant in seven different plants per treatment), using a fluorometer (PAM 2100, Walz, Effeltrich, Germany) after the protocol described by Genty et al. (Reference Genty, Briantais and Baker1989). Measurements of maximum quantum yield PSII (Fv/Fm) were made at pre-dawn (dark-adapted leaves), where Fv = variable fluorescence, and Fm = maximum fluorescence in dark-adapted leaves, relative quantum yield of PSII at steady state photosynthesis (ΦPSII), electron transport rate (J), photochemical (qP), and non-photochemical (qN) quenching coefficients were measured in light-adapted leaves at 10:00–12:00 h at a PPFD of 1000 ± 10 μmol m-2 s-1. Values of J were estimated as J = ΦPSII × PPFD × 0.84 × 0.5, where ФPSII = (F´m-Fs)/F´m) in light-adapted leaves, F´m = maximum fluorescence and Fs = steady-state fluorescence in light-adapted leaves.
Growth variables
Total height (H), height of the main branch of graft (HG), and diameter of graft (DG) were measured with a measuring tape and a vernier caliper, respectively, in four plants (n = 4) per clone and treatment after 14, 21, and 35 days of spray with SiO2-NFs.
Statistical analysis
Results are presented as mean ± standard error (SE). Significance was tested at p < 0.05 and assessed by one-way ANOVA using the Statistica 10 package (StatSoft Inc., Tulsa, OK, USA). All regressions and correlations were tested for significance at P < 0.05. Curves were fitted using the Sigmaplot 11.0 package (Systat Software, Inc., San Jose, CA, USA).
Results
Microclimatic parameters
Mean maximum PPFD outside the greenhouse was reached at noon (1600 ± 100 μmol m–2 s–1); the neutral mesh effectively reduced 70% of the PPFD inside the greenhouse. The highest Ta was also reached at noon (30 ± 2 ºC). Air, soil, and leaf temperature ranged from 20 to 32 ºC, and had a similar trend throughout the day, the lowest values of temperature being found in soil. Relative humidity decreased from 90% in the early morning to 60% in the afternoon (Figure 2). Maximum leaf ΔW, though, was relatively low during the experiments (1.6 ± 0.3 kPa).
Time course of changes in microclimatic parameters during the experiment: A, photosynthetic photon flux density outside (●) and inside the greenhouse (○); B, air temperature and relative humidity; and C, leaf temperature in the greenhouse. Control plants (●), low frequency (○), and high frequency (▼). Values are mean ± SE (n = 5).

Leaf and soil nutrients
No significant differences in leaf (p > 0.63) and soil (p > 0.75) nutrient concentration were observed between day 0 (start the experiments) and day 35 (end of the experiments). In OC-61, leaf N concentration in LF and HF was 30 and 31% higher than in control plants. Also, leaf P concentration was 26% higher in HF in OC-61 than in control plants. For BR-05, there was a significant increase of 22 and 10% and of 38 and 23% in leaf N and K concentration, respectively in LF and HF (Table 1). No significant differences in Mg and Ca concentration in the leaves of both clones were observed among treatments. For BR-05, there was a significant increase of two-fold on leaf Si concentration in LF and HF, whereas no changes were observed in OC-61. In soil, differences were found in Ca concentration between the LF and HF in OC-61. A similar result was found in BR-05 with P concentration; also, a significant reduction in K concentration in HF compared to C was found (Table 1).
Changes in leaf and soil nutrients concentrations of cocoa clones OC-61 and BR-05, control plants (C), low frequency (LF), and high frequency (HF) of spray with SiO2-NF, after 35 days of treatment. Values are mean ± standard error (n = 7). Different letters indicate significant differences among treatments at the end of the trial (one-way ANOVA, p < 0.05 and Duncan’s post hoc test)

Gas exchange
In both cocoa clones, significant changes in gas exchange variables due to treatment were observed (Figure 3). An increase of 16 and 20% in A was found in OC-61 in LF and HF, respectively, whereas in BR-05 increases of 56 (LF) and 60% (HF) on day 35 were observed. At day 35, clone OC-61 showed a 26% reduction in E in LF and HF compared to C, while in BR-05, E decreased by 23 and 36% in HF and LF, respectively. Stomatal conductance had a similar trend for E; in OC-61, a decline of gs of 11 and 37% was found in HF and LF, respectively; whereas in BR-05, a 22% decrease in HF was observed compared to C plants. This resulted in an increase in WUE by 42% in LF in OC-61, while BR-05 showed an increase in WUE of 100% in HF and LF.
Time course of changes in gas exchange in cocoa clones subjected to low frequency (○) and high frequency (▼) of spraying with SiO2-NF and in control plants (●): A–E, net photosynthetic rate; B–F, transpiration rate; C–G stomatal conductance; and D–H, water use efficiency. Values are mean ± SE (n = 7). Clone name indicated in the center panels.

Photosynthetic pigments and total soluble protein
No significant differences in photosynthetic pigment concentration or in Chla+b/Cx+c ratio were observed between treatments in any clone. A significant increase of 15 and 54% of TSP was observed in OC-61 in LF and HF, respectively; while in BR-05, an increase of 26% and 33% in HF and LF, respectively, was found (Table 2).
Changes in the total chlorophyll (Chla+b), carotenoids content (Cx+c), chlorophyll to carotenoids ratio (Chla+b/Cx+c), total soluble proteins (TSP) content, and specific leaf area (SLA) of cocoa clones OC-61 and BR-05, under three treatments: control plants (C), low frequency (LF), and high frequency (HF) of spray with SiO2-NF, after 35 days of treatment. Values are mean ± standard error (n = 7). Different letters indicate significant differences among treatments at the end of the trial (one-way ANOVA, p < 0.05 and Duncan’s post hoc test)

Specific leaf area
Clone OC-61 showed significantly lower values of SLA in LF and HF compared to C but no change was observed in BR-05 (Table 2).
Photochemical activity
Clone OC-61 on average had higher Fv/Fm (0.81 ± 0.002 HF, 0.81 ± 0.01 BF and 0.78 ± 0.005 C) compared to clone BR-05 (0.79 ± 0.006 HF, 0.80 ± 0.007 LF, 0.77 ± 0.010 C). Significant changes in variables of chlorophyll a fluorescence were found between clones and across treatments (Figure 4). Clone OC-61 showed a significant increase of 44% in J in HF compared to LF and C at the end of the experiment; whereas BR-05, showed an increase of 162 and 94% in J in LF and HF, respectively. In OC-61, an increase of 70% in qP was observed in HF compared to LF and C. In BR-05, an increase in qP was found of 221 and 45% in LF and HF compared to C. High values of qN in both cocoa clones was observed throughout the experiment, and a slight decrease of qN in HF and LF compared to C in BR-05 was found.
Time course of changes in variables of chlorophyll a in plant of cocoa clones subjected to low frequency (○) and high frequency (▼) of spraying with SiO2-NF and in control plants (●): A–D, electron transport rate; B–E, photochemical quenching coefficients; and C–F, non-photochemical quenching coefficients. Values are mean ± SE (n = 7). Clone name indicated in the center of the panels.

Growth
In both cocoa clones, neither H nor HG of plants sprayed with SiO2-NF were affected significantly, but there was a significant increase of 27 and 32% of DG in clone OC-61 in LF and HF, respectively, and 24% increase in BR-05 in LF with no change in HF compared to C (Table 3).
Time-course of growth variables of plants of cocoa clones (OC-61 and BR-05) subjected to different treatments in the greenhouse: height (H), height of the main branch of graft (HG), and diameter of graft (DG). Control (C), low frequency (LF), and high frequency (HF) of spray with SiO2-NF. Values are mean ± standard error (n = 4). Different letters indicate significant differences among treatments for each day (one-way ANOVA, p < 0.05 and Duncan’s post hoc test)

Photosynthetic N and P use efficiency
A significant reduction in PNUE was found in OC-61 after 35 of LF and HF treatment, whereas in BR-05 an increase was observed. The PPUE remaining unchanged under treatment in both cocoa clones (Table 4).
Photosynthetic N and P use efficiency (PNUE, PPUE) of cocoa clones (OC-61 and BR-05) in control plants (C) and subjected to low frequency (LF) and high frequency of spraying (HF) after 35 days of treatment. The values represented are averages ± SE (n = 7 per treatment). The letters indicate significant differences obtained among treatments on day 35 through a one-way ANOVA (P < 0.05) and a post hoc Duncan test

Discussion
Foliar fertilization with the SiO2-NF was beneficial for the Criollo cocoa clones. Mainly, SiO2-NF caused positive effects in physiological processes, resulting in an improvement in the photosynthetic capacity in both cocoa clones (significant increases in A, J, and qP), mostly possibly related to an increase in leaf nutrient concentration, such as N and P, and soluble protein content. Also, spraying of SiO2-NF caused an increase in WUE as a result of both increase in A and reductions in gs and E. The significant increase in A and leaf nutrient concentration resulted in a greater diameter of the main stem of the graft, suggesting that plants could be more vigorous by the time they would be transplanted to the field. The physiological response to SiO2-NF was different between clones, with clone BR-05 having a better physiological performance, given the high percentages of increases in many of the variables studied.
Leaf and soil nutrients concentration
The values of foliar N, P, K, and Mg concentration obtained in cocoa clones OC-61 and BR-05 coincide with some of the nutritional proposals for different cocoa clones (Puentes-Páramo et al., Reference Puentes-Páramo, Menjivar-Flores and Aranzazu-Hernández2016). In comparison with the most recent reports of nutritional of the leaves (Puentes-Páramo et al., Reference Puentes-Páramo, Menjivar-Flores and Aranzazu-Hernández2016), clones OC-61 and BR-05 had higher values of P, K, and lower values of Ca. The differences in foliar nutrient concentration may be due mainly to the type of substrate, age of the plant, leaf age, and duration of the experiment and the specific nutritional requirement for each clone (Puentes-Páramo et al., Reference Puentes-Páramo, Menjivar-Flores and Aranzazu-Hernández2016).
In OC-61, a significant increase in leaf N concentration was obtained for LF and HF treatments compared to C; also, in the leaf P concentration in HF treatment; while in BR-05, there was a significant increase in leaf N and K concentration in LF and HF treatment. Those increases were most probably due to the source of external nutrient incorporation (sprayed SiO2-NF), since the samples of their respective soils presented very low N and P concentration; in the case of K for clone BR-05, it may be due to the application of SiO2-NF and, in turn, to the constant incorporation of K through irrigation, because irrigation water presented high concentrations of K, Mg, and Ca. The critical soil concentration for cocoa plants are below 42.8 mmol kg–1 N, 0.3 mmol kg–1 P, 0.3 mmol kg–1 K, 8 mmol kg –1 Mg, and 22.5 mmol kg–1 Ca (Aikpokpodion, Reference Aikpokpodion2010), therefore, the concentration of nutrients (N, P, K, Mg, and Ca) obtained in the soils on day 0 and day 35 for both clones were suitable for cocoa seedlings.
Gas exchange
The average A values obtained in OC-61 and BR-05 agreed with those previously reported in different varieties and cocoa clones in Venezuela and elsewhere (A between 0.5 and 7 μmol m–2 s–1) (Ávila-Lovera et al., Reference Ávila-Lovera, Coronel, Jaimez, Urich, Pereyra, Araque, Chacón and Tezara2016, Reference Ávila-Lovera, Blanco, Móvil, Santiago and Tezara2021; Bertolde et al., Reference Bertolde, Almeida, Pirovani, Gomes, Ahnert, Baligar and Valle2012; Daymond et al., Reference Daymond, Tricker and Hadley2011; De Almeida et al., Reference De Almeida, Herrera and Tezara2018; Tezara et al., Reference Tezara, Urich, Jaimez, Coronel, Araque, Azocar and Chacón2016, Reference Tezara, Pereyra, Ávila-Lovera and Herrera2020). The results observed in A coincide with the increase in leaf N and P concentration due to treatment. The suitable supply of nutrients to the plants certainly provided the necessary requirements for specific processes of the metabolism during the development of the plants (Gattward et al., Reference Gattward, Almeida, Souza, Gomes and Kronzucker2012; Latsague et al., Reference Latsague, Sáez and Mora2014) that resulted in increased photosynthetic capacity and growth of the main stem of the graft. Furthermore, this increased in A was not due to increases in chlorophyll and total carotenoid concentration because no variations due to treatment in their concentrations were observed in any of the clones. Contrary to our results, Chl a, Chl b, and C x+c concentrations in Berberidopsis corallina increased in plants fertilized, contributing to enhanced A (Latsague et al., Reference Latsague, Sáez and Mora2014).
In both cocoa clones a reduction of gs was obtained after foliar spraying with SiO2-NF compared to C. The changes in gs reduced water loss under unchanging ΔW. The reduction of gs and E in cocoa plants with foliar spraying of Si subjected to water deficit has been reported before, however, in that study, there was no improvement in photosynthetic capacity during one week of fertilization (Zanetti et al., Reference Zanetti, Milanez, Gama, Aguilar, Souza, Campostrini, Ferraz and Figueiredo2016). Similarly, another study found a significant reduction in E and leaf RWC during the irrigation of SiO2-NF in wild pear seedlings, but A and gs did not change with irrigation (Zarafshar et al., Reference Zarafshar, Akbarinia, Askari, Hosseini, Rahaie and Struve2015).
Considerable WUE enhancement was obtained in both clones after the foliar spraying with SiO2-NF at the end of the experiment, in accordance with increased A and reduced gs and E found here. The increase in WUE was of greater magnitude in clone BR-05 than OC-61, so the former clone appears to respond better to the application of SiO2-NF. Therefore, SiO2-NF could promote greater tolerance to water loss during dry periods (Ahmed et al., Reference Ahmed, Qadeer, Ahmed and Hassan2016; Raliya et al., Reference Raliya, Saharan, Dimkpa and Biswas2017; Zarafshar et al., Reference Zarafshar, Akbarinia, Askari, Hosseini, Rahaie and Struve2015), an aspect of great interest for cocoa since it is a perennial crop whose productivity can be affected by drought, which is why the search for new strategies to overcome this limitation is promoted in Venezuela (De Almeida et al., Reference De Almeida, Tezara and Herrera2016; Tezara et al., Reference Tezara, Pereyra, Ávila-Lovera and Herrera2020).
Similar to our findings, the application of SiO2-NF in Solanum lycopersicum improved photosynthetic capacity of plants under salt stress, and improved WUE by significantly reducing gs and E (Haghighi and Pessarakli, Reference Haghighi and Pessarakli2013). The mitigation of the effects of abiotic stress, such as water deficit, nutrient availability, and chilling on physiological process, has been found by increasing the uptake of water through the roots, maintaining the nutrient balance, reducing E and stimulating A (Elsheery et al., Reference Elsheery, Sunoj, Wen, Zhu, Muralidharan and Cao2020; Wang et al., Reference Wang, Jin, Xu, Miao, White, Gardea-Torresdey, Ji and Zhao2020; Zhu and Gong, Reference Zhu and Gong2014). Furthermore, deposition of Si occurs on leaf epidermal cells forming a barrier that can reduce the loss of water through the cuticle (Trenholm et al., Reference Trenholm, Datnoff and Nagata2004).
The increase in A and WUE observed in the clones studied could be due to the beneficial effects of leaf spraying of SiO2-NF on leaf nutrient concentration, both N and P concentration, as well as the accumulation of Si in leaf tissues. These physiological responses supports the idea that nanoparticles of SiO2 with a size of 34 nm can be used as a means of supplying and delivering nutrients to cocoa plants. Perhaps, the incorporation of nanoparticles was mediated by cuticular penetration mechanisms such as the ‘polar’ or ‘watery pore’ route (Schönherr, Reference Schönherr2006; Schreiber and Schönherr, Reference Schreiber and Schönherr2009; Schreiber, Reference Schreiber2005), since cocoa is a plant with hypoestomatic leaves (Hernández et al., Reference Hernández, Leiva and Ramírez2017).
Photosynthetic pigments and total soluble protein
Chlorophyll and total carotenoid contents in OC-61 and BR-05 clones were within the range of those previously reported in other cocoa clones: 30–112 μg cm–2 of total chlorophyll and 5–18 μg cm–2 of carotenoids (Bertolde et al., Reference Bertolde, Almeida, Pirovani, Gomes, Ahnert, Baligar and Valle2012; De Almeida et al., Reference De Almeida, Herrera and Tezara2018; Tezara et al., Reference Tezara, Pereyra, Ávila-Lovera and Herrera2020). There were no differences in pigment concentrations among treatments in either clone. In contrast, in Triticum spp and Lupinus albus, a dramatic increase in the concentration of photosynthetic pigments and TSP was reported after irrigation with high concentrations of SiO2 nanoparticles (Sun et al., Reference Sun, Hussain, Yi, Rookes, Kong and Cahill2016). Additionally, it has been proposed that the concentration of photosynthetic pigments may be an indicator of nanoparticles toxicity (Rico et al., Reference Rico, Hong, Morales, Zhao, Barrios, Zhang, Peralta-Videa and Gardea-Torresdey2013), a hypothesis that could be ruled out in our study since there was no negative effect of the SiO2-NF on photosynthetic pigment concentration.
Leaf TSP content for clones OC-61 and BR-05 were similar to values previously reported for different Trinitario clones of a germplasm bank in Barlovento, Venezuela, in which values between 1.6 and 8.8 mg g–1 have been found (Quiñones-Gálvez et al., Reference Quiñones-Gálvez, Sosa, Demey, Aleman, Sosa, Parra, Móvil, Trujillo, Capdesuñer, Quirós, Hernández and Infante2015; Tezara et al., Reference Tezara, Pereyra, Ávila-Lovera and Herrera2020). Clone OC-61 presented higher values of TSP compared to BR-05, with values between 5.1 and 6.9 mg g–1 in OC-61 and between 4.3 and 5.4 mg g–1 in BR-05. The differences obtained between treatments and C in both clones indicate that the SiO2-NF had a positive effect in the formation of proteins in the photosynthetic tissues of the cocoa plants. Similarly, TSP content was correlated with the increase of the photochemical and photosynthetic activity in wheat and lupin (Sun et al., Reference Sun, Hussain, Yi, Rookes, Kong and Cahill2016). These results are in accordance with the increase in leaf N concentration for the clones OC-61 and BR-05 due to spraying of SiO2-NF, since approximately 40% of the leaf N is usually invested in RubisCO (Spreitzer and Salvucci, Reference Spreitzer and Salvucci2002). Furthermore, the application of N, P, and K can directly influence the concentration of soluble carbohydrates (glucose), which is directly related to the synthesis of pigments and proteins (Latsague et al., Reference Latsague, Sáez and Mora2014).
Values of SLA in both cocoa clones were on average 237 cm2 g–1, similar to those reported in eight Forastero clones in the International Cacao Quarantine Centre at The University of Reading (Daymond et al., Reference Daymond, Tricker and Hadley2011), but lower than those reported in Forastero, Trinitario, and Criollo clones in Venezuela (Tezara et al., Reference Tezara, Urich, Jaimez, Coronel, Araque, Azocar and Chacón2016, Reference Tezara, Pereyra, Ávila-Lovera and Herrera2020). Clone OC-61 showed lower values of SLA in LF and HF, that is, leaves became thicker on a dry mass basis and/or denser, whereas no change was observed in BR-05 leaves.
Photochemical activity
The values of Fv/Fm and ΦPSII obtained in this study agreed with those previously reported in different ecophysiological studies with different varieties of cocoa (Ávila-Lovera et al., Reference Ávila-Lovera, Coronel, Jaimez, Urich, Pereyra, Araque, Chacón and Tezara2016; De Almeida et al., Reference De Almeida, Herrera and Tezara2018; Tezara et al., Reference Tezara, Urich, Jaimez, Coronel, Araque, Azocar and Chacón2016, Reference Tezara, Pereyra, Ávila-Lovera and Herrera2020). Throughout the experiment, clones OC-61 and BR-05 showed Fv/Fm values of 0.80 and 0.75, respectively, indicating that there was no damage in the photochemical apparatus, and that plants were healthy (Maxwell and Johnson, Reference Maxwell and Johnson2000). In OC-61 and BR-05, the increase of J, ΦPSII, and qP without changes in qN showed an improved of photochemical activity after the treatment with SiO2-NF. The application of SiO2-NF in cocoa plants could have generated a decrease in the emission of fluorescence due to a better stabilization of the photosystems in the membrane structure of the chloroplasts, translating into a greater photochemical activity (Zanetti et al., Reference Zanetti, Milanez, Gama, Aguilar, Souza, Campostrini, Ferraz and Figueiredo2016).
It has been proposed that Si has an important role in the synthesis of intracellular organic compounds and the maintenance of normal biochemical functions, such as the biosynthesis and degradation of chlorophyll, suggesting that the stimulation of the expression of some genes with the addition of Si can improve the activity of PSII and J, due to an increase in chlorophyll concentration (Li et al., Reference Li, Song, Li, Fan and Liang2015; Matichenkov et al., Reference Matichenkov, Bocharnikova, Kosobryukhov and Biel2008; Song et al., Reference Song, Li, Fan, Li and Liang2014). Silicon can improve photochemical efficiency in a variety of species subject to water deficit (Chen et al., Reference Chen, Yao, Cai and Chen2011), because the fluorescence emission of Chl a depends on the structures of the thylakoids membrane, which allows for a more stable anchoring of the photosynthetic pigments (Zanetti et al., Reference Zanetti, Milanez, Gama, Aguilar, Souza, Campostrini, Ferraz and Figueiredo2016). Cocoa plants subjected to water deficit after the foliar spraying of non-nanostructured SiO2 showed improvements in photochemical efficiency by increasing the density of active PSII reaction centers and the index of performance for the conservation of energy until the reduction of the final acceptor of PSII (Zanetti et al., Reference Zanetti, Milanez, Gama, Aguilar, Souza, Campostrini, Ferraz and Figueiredo2016).
Possible mechanism how SiO2-NF increased photosynthesis
A possible mechanism of how SiO2-NF foliar spray increased photosynthesis and WUE could be that the cocoa plants nanofertilized with mineral nutrients encapsulated in the nanoparticles, which were released in the foliar tissues, caused a higher incorporation of nutrients (Monreal et al., Reference Monreal, DeRosa, Mallubhotla, Bindraban and Dimkpa2015) that were probably used in the synthesis of proteins (higher concentration of TSP) or other enzymes that intervene in the Calvin–Benson cycle, or in protein complexes associated with the thylakoid membrane, all factors that enhance carboxylation efficiency and therefore A, qP, and J, without the need to increase photosynthetic pigment concentrations (Elsheery et al., Reference Elsheery, Sunoj, Wen, Zhu, Muralidharan and Cao2020; Morales-Díaz et al., Reference Morales-Díaz, Ortega-Ortíz, Juárez-Maldonado, Cadenas-Pliego, González-Morales and Benavides-Mendoza2017; Raliya et al., Reference Raliya, Saharan, Dimkpa and Biswas2017; Wang et al., Reference Wang, Jin, Xu, Miao, White, Gardea-Torresdey, Ji and Zhao2020). Furthermore, a dense layer formed by the deposition of Si can be found on the cuticle in many species. A formation of this layer forming a barrier between leaves and the atmosphere, could have reduced the loss of water through the cuticle; these factors are essential to cope with abiotic stress conditions, and are suggested here as a mechanism for Si-induced improvement of WUE.
Growth in both cocoa clones
Among the growth parameters that were considered in this experiment, only a significant increase in DG of both cocoa clones was observed. This increase may have been due to both increased in leaf nutrients and photosynthesis, as well as increased in Si concentration. In Poa pratensis, the accumulation of Si leads to hardness, can facilitate the erection of the leaves, and, therefore, increase the interception of light, which could contribute to the increase of photosynthetic capacity, photo-assimilation, and growth, which then improve overall plant performance (Saud et al., Reference Saud, Li, Chen, Zhang, Fahad, Hussain, Sadiq and Chen2014). Similarly, it has been reported in different species, such as S. lycopersicum, Triticum spp and L. albus, that after the application of SiO2-NF without fertilizer formulation, the dry mass of tomato plants increased, and root tissues and shoot dry mass increases by 51 and 26%, respectively, for Triticum spp and L. albus (Haghighi and Pessarakli, Reference Haghighi and Pessarakli2013; Raliya et al., Reference Raliya, Saharan, Dimkpa and Biswas2017; Sun et al., Reference Sun, Hussain, Yi, Rookes, Kong and Cahill2016). Also, it has been reported in rice plants that Si irrigation could increase biomass and promote the phytolith concentration (derived from the biomineralization of Si), although in enriched soils, excess Si may cause reduction in biomass (Sun et al., Reference Sun, Hussain, Yi, Rookes, Kong and Cahill2016).
The SiO2-NF can be an attractive agro-input for cocoa farmers and producers, since it could be applied as a complement to stimulate the photosynthetic apparatus, growth, and tolerance of cocoa plants against water deficit during their most important developmental stage, and without generating negative impacts on the environment. However, future tests with mature cocoa trees under field conditions are recommended to assess whether SiO2-NF spraying can improve important agronomic characteristics and yield in different cocoa clones.
Photosynthetic N and P use efficiency
All of the photochemical and biochemical process of photosynthesis involve nitrogen: RubisCO, regeneration of RuBP, chlorophylls, and thylakoids proteins (Ávila-Lovera et al., Reference Ávila-Lovera, Coronel, Jaimez, Urich, Pereyra, Araque, Chacón and Tezara2016). The values observed in PNUE were 4–5 times higher than those calculated with data from A and N reported in other cocoa plants (Ávila-Lovera et al., Reference Ávila-Lovera, Coronel, Jaimez, Urich, Pereyra, Araque, Chacón and Tezara2016, Reference Ávila-Lovera, Blanco, Móvil, Santiago and Tezara2021; Tezara et al., Reference Tezara, Pereyra, Ávila-Lovera and Herrera2020; Daymond et al., Reference Daymond, Tricker and Hadley2011). In our study, there was a differential PNUE response to spray with SiO2-NF, it increased in BR-05 and decreased in OC-61, suggesting that the BR-05 had a better use of nitrogen, i.e. a greater A per unit of foliar N. Contrary, PPUE was not affected by the treatment in either clone.
Conclusions
Foliar fertilization with SiO2-NF was beneficial for both Criollo cocoa clones (OC-61 and BR-05). Foliar spraying of SiO2-NF improved leaf gas exchange and photochemical activity of PSII by increasing net photosynthetic rate, electron transport rate, and the photochemical extinction coefficient of both cocoa clones. Spraying with SiO2-NF promoted higher concentration of TSPs, higher leaf N and P concentration in clone OC-61, and higher N, K, and Si in clone BR-05. This increased nutrient concentration may have increased both photosynthetic rate and photochemical activity of PSII. The improved water use efficiency was achieved by simultaneous increases in net photosynthetic rate and reduction in stomatal conductance and transpiration rates in both clones, without changes in the concentration of photosynthetic pigments. The significant increase in photosynthesis and leaf nutrient concentration resulted in a greater diameter of the main stem of the graft, suggesting that plants could be more vigorous with a better opportunity of surviving by the time they would be transplanted to the field.
We conclude that SiO2-NF has a positive effect on physiological processes related to photosynthesis in both cocoa clones studied, and this was associated with an increase of nutrients (N, P, and K) and Si concentration, which translates into greater growth (i.e., increase diameter of graft). Therefore, the SiO2-NF can be a useful tool for cocoa farmers, since they could be applied as a complement to stimulate the photosynthetic apparatus and growth during their most important stage of development, that is, the seedling stage.
A differential physiological response to spraying with SiO2-NF between clones was found, likely the great genetic variability among cocoa may determine different physiological responses to the foliar application of SiO2-NF. Clone BR-05 was the clone with a better physiological performance, given the high percentages of increases in many of the variables studied, and hence one that we would recommend for further field experimentation. However, more research on the effect of SiO2-NFs on adult cocoa trees grown in field conditions is necessary.
Acknowledgement
We thank the Foundation Empresas Polar, CDCH-UCV PGE 03-036-2018/1, Corporation for the Scientific and Technological Development (CODECYT, S.A.) and FONACIT No. 2019000026, for the financial support. We thank the Electron Microscopy Unit of the Chemistry Center, IVIC, for the determination of Si content and Freddy Fischer of the Bromelias farm, for allowing us to work and develop this research in their facilities. We further thank Fabiola Ríos and Olga Movil for their help with field measurements, and Eleinis Ávila-Lovera and Ana Herrera for helpful discussions that improved this manuscript.
Authors’ Contributions
PGV, JC, and WT designed the experiment. PGV, HBF, AMF, and WT performed the experiment. PGV, HBF, and AMF conducted the laboratory measurements. PGV and WT analysed the data. PGV and WT wrote the paper. All authors read and approved the final manuscript.
Financial Support
None.