I. INTRODUCTION
Perfectly spherical functional carbonaceous materials have attracted interests because of their unique morphology and electromagnetic, thermodynamic, and mechanical properties.Reference Reddy and Ramaprabhu1–Reference Ajayan3 These materials have potential applications in the areas of purification, drug delivery, adsorbents, catalysts, and catalyst supports.Reference Bruk, Bespalovol, Loginov, Loginov, Nickolai, Nikitta, Zefirov, Kal’nov, Klochikhina, Kulova, Yu and Skundin4–Reference Joo, Kim, Kim, Kim and Yi7 Because of problems related to the depletion of fossil fuels and environmental pollution, development of preparation methods for carbonaceous materials has focused on the use of environmental friendly resources and methods.
Recently, many attempts have been made to produce spherical carbon from biomass by hydrothermal synthesis.Reference Chen, Sun, Jiang, Niu, Yu, Liu and Li8 Biomass is a promising starting material because it is inexpensive, abundant, readily available, and environmental friendly and rapidly regenerates.Reference Hu, Yu, Wang, Liu and Xu9 Compared with traditional approaches,Reference Gherghel, Kubel, Lieser, Rader and Mullen10–Reference Demazeau12 hydrothermal synthesis is an environmental friendly route. It proceeds under mild conditions (e.g., T < 300 °C and t < 14 h) in a sealed container without any organic solvent. In hydrothermal synthesis, it is easy to control the shape and chemical structure of the products for targeted applicationsReference Qian, Yu, Luo, Gong, Fei and Liu13, Reference Titirici, Thomas, Yu, Muller and Antonietti14 that depend on specific properties (e.g., size, diameter distribution, shape, and chemical functionalities).
Oxygen-rich carbon spheres (CSs) (Ø 0.25–5 μm) were first reported by Wang et al.Reference Wang, Li, Chen and Huang15 in 2001. Sucrose was used as the starting material, and hydrothermal carbonization was carried out at 190 °C for 5 h. Since then, many relevant studiesReference Mi, Hu, Dan and Liu16–Reference Yang, Du, Guo, Yu, Chen, Zhang, Chen and Liu34 using saccharides as raw materials have been reported. CSs with diameters ranging from several hundred nanometers to several micrometers have been prepared by hydrothermal treatment at 160–250 °C from glucose,Reference Wang, Li, Chen and Huang15 sucrose,Reference Mi, Hu, Dan and Liu16, Reference Zheng, Cao, Jun, Liu and Ma17 fructose,Reference Zhuang and Yang18 starch,Reference Yao, Shin, Wang, Windisch, Samuels, Arey, Wang, Risen and Exarhos19 and cellulose.Reference Sevolilla and Fuertes21, Reference Shen, Lin and Nan22 The CSs formed in these studies have many surface oxygen groups (mainly –OH and –C=O).Reference Makowsi, Cakan, Antonieitti, Goettmann and Titirici23–Reference Sun and Li25 Benefited by these groups, CSs can be used as supports, loaded with metal particles (Ag, Au, Pt) or metal oxide–carbon materials (Fe3O4, SnO2, SiO2),Reference Mi, Hu, Dan and Liu16, Reference Sun and Li26–Reference Liu, Wang, Wang, Hosono and Zhou29 or used as templates to prepare inorganic compounds (GaN, Ga2O3, TiO2) with complex spherical structures (core–shell structures, hollow spheres) without any surface modification.Reference Lou, Li and Lynden30–Reference Yang, Du, Guo, Yu, Chen, Zhang, Chen and Liu34 Consequently, it is important to synthesize CSs with specific morphologies (size and shape) and chemical properties.
However, to the best of our knowledge, there are few reports on control of the morphology and chemical properties of CSs. In the present study, the effects of hydrothermal synthesis conditions (temperature, reaction time, and concentration) on the morphology and chemical properties of CSs were investigated using glucose as the starting material. Scanning electron microscopy (SEM), x-ray diffraction (XRD), Fourier-transform infrared (FTIR) spectroscopy, elemental analysis, and x-ray photoelectron spectroscopy (XPS) were used to analyze the CSs. A possible formation mechanism for the CSs is discussed.
II. EXPERIMENTAL
A. Preparation of CSs
Forty milliliters of glucose solution (0.3–0.7 mol/L) was transferred into a stainless-steel autoclave with a capacity of 60 mL, sealed, and heated at 140–290 °C for 3–7 h. When the reaction was completed, the autoclave was cooled to room temperature. The black precipitate that formed was collected and washed with water, pure ethanol, and acetone for three times. The final product was dried at 80 °C for 6 h. The brown solids obtained from glucose (0.3 mol/L) after hydrothermal treatment for 4 h at 180, 230, and 290 °C were labeled CS180, CS230, and CS290, respectively. The solids obtained after hydrothermal treatment of 0.5 and 0.7 mol/L glucose at 190 °C for 4 h were labeled 0.5CS and 0.7CS, respectively, and those obtained after hydrothermal treatment of glucose at 190 °C for 3, 4, 5, and 7 h were named CS-3, CS-4, CS-5, and CS-7, respectively.
B. Characterization methods
The morphologies and sizes of the products were determined by SEM (Quanta 200, FEI, Hillsboro, OR). Diffuse reflectance infrared spectra of powders of the CSs were recorded on a PerkinElmer TV1900 FTIR spectrometer (Waltham, MA). The XPS measurements were recorded on a Physical Electronics PHI5700 spectrometer (Chanhassen, MN) using Al-Kα radiation (hν = 1486.6 eV). The binding energies were referenced to the C1S line at 284.6 eV. XRD measurements were performed on a Rigaku D/Max-rB diffractometer (Tokyo, Japan) using Cu-Kα radiation (45 kV, 40 mA, λ = 1.54178 Å). Quantitative analyses of C and O were based on the peak intensities of the C1S and O1S signals, respectively. Elemental analysis (C, H, and O) of the samples was carried out on an EA 3000 analyzer (EuroVector, Milan, Italy).
III. RESULTS AND DISCUSSION
A. Morphology
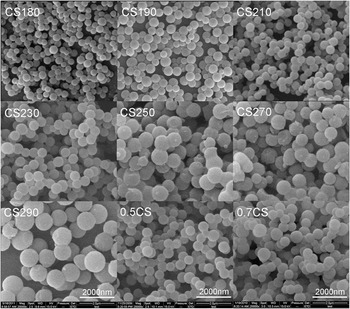
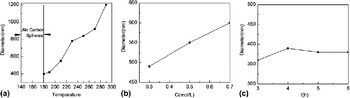
The experimental results suggested that when T <180 °C were used for the hydrothermal synthesis, no solid products were obtained, but the glucose solution became brown and its viscosity increased. As the temperature increased above 180 °C, solids appeared. The color of the suspension changed from yellow ochre to deep brown, to puce, to black as the temperature increased from 180 to 290 °C. SEM images of the CSs obtained by hydrothermal treatment at various experimental conditions are presented in Fig. 1, and the effects of temperature [Fig. 2(a)], glucose concentration [Fig. 2(b)], and time [Fig. 2(c)] on the diameter of the CSs are shown in Fig. 2. For CS180–CS290, when the temperature was increased from 180 to 290 °C, the diameter of the CSs increased from 300 to 1200 nm [Fig. 2(a)], and the morphology changed obviously. At low temperature (≤230 °C), the CSs had a smooth surface and regular shape. When T > 230 °C, the surface of the CSs became rough, and fused spheres and irregular spherical particles appeared. These results show the reaction temperature is an important factor in morphology control, and temperatures between 180 and 230 °C are optimal for the preparation of CSs (Ø 300–800 nm) with regular shapes and smooth surfaces. For CS190, 0.5CS, and 0.7CS, as the glucose concentration increased from 0.3 to 0.7 mol/L, the diameter of the CSs increased from 400 to 650 nm [Fig. 2(b)], and their surface and regular shape did not change. This indicates that the glucose concentration can be used in size control and is directly related to the size of the CSs.
Scanning electron microscopy (SEM) images of CS180, CS190, CS210, CS230, CS270, CS290, and 0.5CS, 0.7CS.

Effects of (a) temperature, (b) concentration, and (c) reaction time on the size of the carbon spheres (CSs).

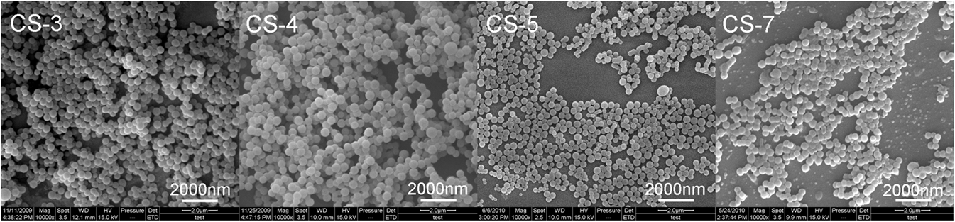
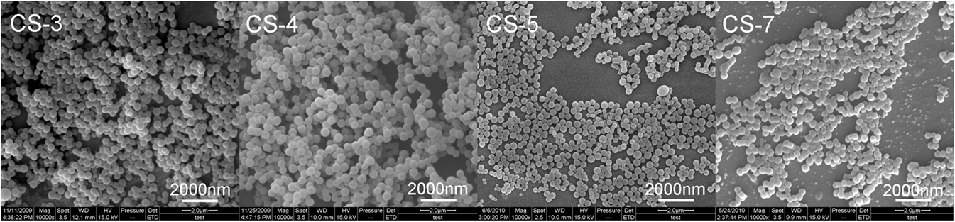
Figure 3 shows the SEM images of the CSs obtained with various reaction times. When the reaction time was increased from 3 to 7 h, the diameter of the CSs remained around 400 nm [Fig. 2 (c)], but the morphology changed. With a reaction time of 3 or 4 h, CSs with regular shapes and smooth surfaces were produced. When the reaction time was increased to 5 h, the spheres became irregular and some fused together. With a reaction time of 7 h, most of the CSs aggregated. This indicates that the reaction time can be used in shape control and that 3–4 h is the optimum reaction time to obtain regular CSs with smooth surfaces and a diameter of around 400 nm.
SEM images of CS-3, CS-4, CS-5, and CS-7.
B. X-ray diffraction
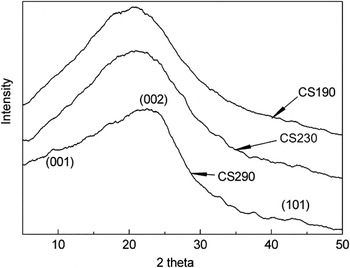
The phases of the CSs obtained by hydrothermal treatment of 0.3 mol/L glucose for 4 h at 190 °C (CS190), 230 °C (CS230), and 290 °C (CS290) were investigated by XRD (Fig. 4). For CS190 and CS230, a broad, weak, and symmetrical peak for the (002) reflection was observed, which indicates the CSs are in the amorphous carbon phase. When the temperature was increased from 190 to 230 °C, the intensity of the (002) peak increased and its width narrowed, indicating an increase in microcrystalline carbon.Reference Wang, Shi, Li and Tan31 At 290 °C, the (001) peak appeared at 10.8°, the (101) peak appeared at 43.2°, and the (002) peak shifted to 26° and became asymmetrical. These changes indicate that amorphous carbon, microcrystalline carbon, and turbostratic carbon coexist in the CSs and that phase transformation from amorphous to the turbostratic stacking is induced by carbonization.Reference Wang, Shi, Li and Tan31 These results show that the chemical properties of the CSs were largely affected by reaction temperature and that phase transformation was induced at T > 230 °C.
X-ray diffraction patterns of CS190, CS230, and CS290.

C. FTIR and XPS
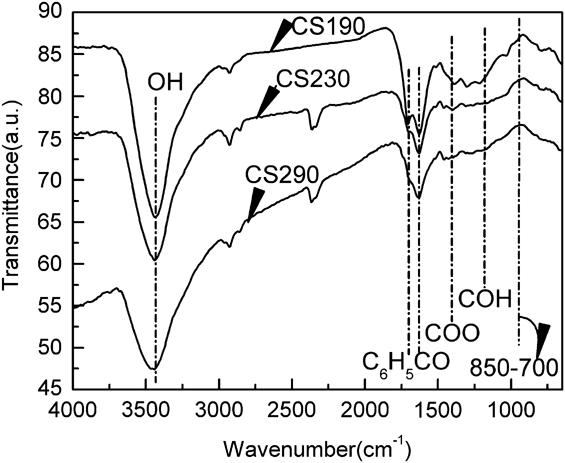
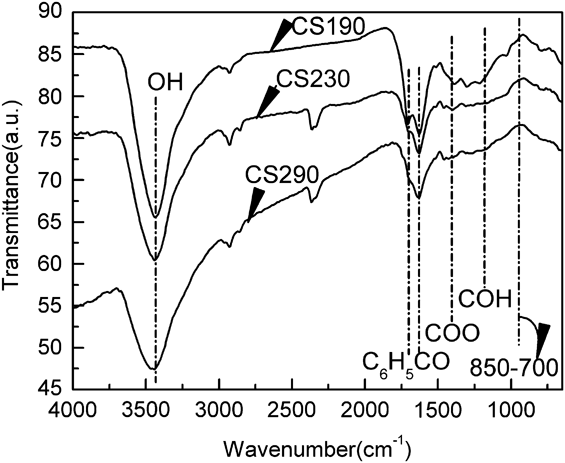
The functional groups on the surfaces of the CSs were characterized by FTIR and XPS. Figure 5 shows the FTIR spectra of CS190, CS230, and CS290. The spectra of the three samples are similar, which suggests that the CSs have similar surface functional groups. Bands observed at 3400 and 1100 cm−1 could be attributed to O–H (hydroxyl or carbonyl groups) and C–O (hydroxyl, ester, or ether) stretching, respectively.Reference Sevilla and Fuertes27 The peak at 1450 cm−1 could be attributed to the C=O stretching vibration,Reference Liu, Sun and Huang32 and the two peaks at 1710 and 1640 cm−1 correspond to C=O stretching of the aromatic carboxylic moiety (C6H5– C=O).Reference Sun and Li33 The bands at 750–875 cm−1 were assigned to the aromatic C–H out-of-plane bending vibration.Reference Sun and Li25 These results indicate that there are many –OH, C=O, and C6H5– C=O groups on the surface of the CSs. These groups could be produced by dehydration, decarbonylation, and aromatization.Reference Sevolilla and Fuertes21, Reference Sun and Li25, Reference Sevilla and Fuertes27 Comparison of the spectra for CS190, CS230, and CS290 showed that the peaks at 1710 and 1640 cm−1(C6H5– C=O) and at 3400 cm−1(–OH) decreased slightly as the temperature increased. The number of oxygen groups on the surface of the CSs was inversely related to temperature, and T ≤ 230 °C were optimal for the preparation of oxygen-rich CSs.
Fourier-transform infrared spectra of CS190, CS230, and CS290.
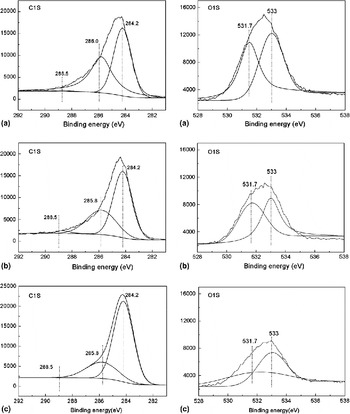
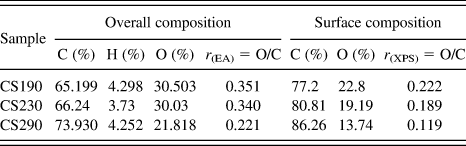
The surfaces of the CSs were further investigated by XPS. Figure 6 shows the C1S and O1S spectra of CS190, CS230, and CS290, and the surface composition results are listed in Table I. In the C1S spectra, peaks for graphitic carbon (C–C, CHx, C–C), phenolic carbonyl groups (C6H5–C=O), and carbonyl or ester groups (C=O, –COOR) were observed at 284.2, 285.8, and 288.5 eV, respectively.Reference Sevolilla and Fuertes21, Reference Liu, Sun and Huang32–Reference Liu, Zhao and Qiu35 These groups could be generated by a series of complicated reactions including dehydration (e.g., aldol condensation, esterification), decarbonylation, and aromatization,Reference Sevolilla and Fuertes21, Reference Sevilla and Fuertes27 which was also suggested by the FTIR results. Comparison of the C1S curves among the three samples showed the intensity of the 285.8 and 288.5 eV peaks decreased as the temperature increased. The O1S spectra exhibited two major peaks at 533.0 eV (C–OH or C6H5–C=O groups) and 531.7 eV (C=O groups). The areas of these peaks decreased as the temperature increased. In combination, the C1S and O1S spectra indicate that the decrease in the number of oxygen groups (–OH, C=O, and C6H5–C=O) might result from carbonization on the surface. From the surface composition data (Table I), as the temperature increased from 190 to 290 °C, the O/C ratio decreased from 0.222 to 0.119. This decrease was induced by the removal of surface oxygen groups and was also observed in the FTIR results.
X-ray photoelectron spectroscopy analysis of (a) CS190, (b) CS230, and (c) CS290.

The overall and surface compositions of CS190, CS230, and CS290.
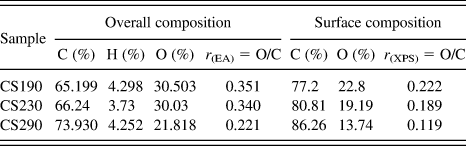
r, atomic ratio.
D. Elemental analysis of the CSs
The elemental analysis results for CS190, CS230, and CS290 are summarized in Table I. The element analysis showed that as the temperature increased, the overall O/C atomic ratio and oxygen content decreased. These results agree with the XPS results and highlight the role of the temperature in determining the number of surface functional groups. The overall oxygen content (30.503–21.818%) and O/C ratio (0.351–0.221) were much higher than those on the surface, which confirms that carbonization occurred on the surface.
E. Possible formation mechanism for the CSs
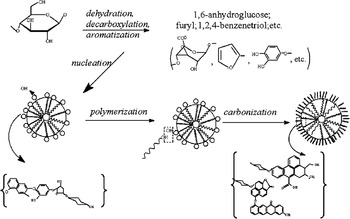
Taking into account previous researchReference Sun and Li25–Reference Sevilla and Fuertes27, Reference Sasaki, Kabyemela, Malaluan, Hirose, Takeda, Adschiri and Arai36–Reference Ogihara, Smith, Inomata and Arai38 and the results of this study, we propose a possible formation mechanism for the CSs. In this mechanism, macromolecules, such as 1,6-anhydroglucose, furyl, and 1,2,4-benzenetriol, are initially formed by a series of chemical reactions of glucose. The FTIR and XPS results indicate that these reactions include dehydration (e.g., aldol condensation, esterification), decarbonylation, and aromatization. When the system reaches critical supersaturation, rapid nucleation induced by cross-linking of the macromolecules with free glucose monomers occurs. The particles formed by this nucleation have hydrophilic surfaces with –OH, C6H5–C=O, and O=C–O– groups. The nuclei then grow outward by polymerization of the reactive oxygen groups both on their surface and the reactive macromolecules, and the resulting particles have many surface oxygen groups. In this mechanism, higher glucose concentrations and temperatures favor polymerization, which increases the diameter of the particles. Higher temperatures and longer reaction times favor polymerization, which produces CSs with irregular shapes. When the free macromolecules are consumed, carbonization occurs among the oxygen groups on the surface, as evidenced by elemental analysis. Higher temperatures and longer reaction times favor carbonization, which produces CSs with irregular shapes and decreases the number of surface oxygen groups. This mechanism is illustrated in Fig. 7.
Formation of CSs by glucose hydrothermal treatment.

IV. CONCLUSION
Oxygen-rich CSs with regular shapes and diameters of 300–1200 nm were produced from glucose by a simple hydrothermal process. The morphologies (shape and size) of the CSs produced under different experimental conditions were studied by SEM. The reaction temperature had an obvious effect on the morphology, the reaction time was a factor in shape control but not related to the diameter of the CSs, and the glucose concentration was directly related to the size of the CSs but not relevant to the spherical shape. The optimal conditions for synthesis of regular CSs (Ø 300–800 nm) with smooth surfaces were temperatures between 180 and 230 °C and reaction times of 3–4 h. XRD results suggested that the chemical properties were largely determined by the temperature, and a phase transformation from amorphous carbon to graphite took place at T > 230 °C. FTIR and XPS results indicated that as the temperature increased, the number of surface oxygen groups (–OH, C=O, and C6H5–C=O) decreased. This decrease was more rapid at 230–290 °C than at 190–230 °C. The temperature plays an important role in determining the number of surface oxygen groups, and T ≤ 230 °C was optimal for the synthesis of oxygen-rich CSs. The oxygen content and O/C ratio results from elemental analysis and XPS indicated that carbonization occurred on the surface and its degree was directly proportion to the temperature. A formation mechanism for the CSs based on the results from the present study and earlier studies was proposed and involves formation of macromolecules, nucleation, polymerization, and carbonization.
ACKNOWLEDGMENTS
The authors gratefully acknowledge the financial support of the Distinguished Young Scientist Foundation of Heilongjiang Province (JC200801), Fundamental Research Funds for the Central Universities (DL09DB01), and Graduate Thesis Fund Project of the Northeast Forestry University (gram09).