INTRODUCTION
In the recent years, pulsed laser induced breakdown in liquid has drawn considerable attention due to its significant implementation in the fields of medical science, micromachining, underwater material processing, liquid immersion lithography, laser induced isotope separation, etc. (Berns et al., Reference Berns, Wright and Steubing1991; Ramanathan & Molian, Reference Ramanathan and Molian2001; Kruusing, Reference Kruusing2004; Rothschild et al., Reference Rothschild, Bloomstein, Kunz, Liberman, Switkes, Palmacci, Sedlacek, Hardy and Grenville2004; Makide et al., Reference Makide, Kato, Tominaga and Takeuchi1983; Schnürer et al., Reference Schnürer, Ter-Avetisyan, Busch, Risse, Kalachnikov, Sandner and Nickles2005). High power laser induced breakdown in solid, liquids, and gases leads to plasma formation with emission of shockwaves (Batani et al., Reference Batani, Stabile, Ravasio, Desai, Lucchini, Strati, Ullschmied, Krousky, Skala, Kralikova, Pfeifer, Kadlec, Mocek, Präg, Nishimura, Ochi, Kilpio, Shashkov, Stuchebrukhov, Vovchenko and Krasuyk2003; Hoffmann et al., Reference Hoffmann, Blazevic, Ni, Rosmej, Roth, Tahir, Tauschwitz, Udrea, Varentsov, Weyrich and Maron2005), and cavitation bubbles in liquids (Nath & Khare, Reference Nath and Khare2008). The irradiation by high power laser inside the liquid medium generates the starting seed electrons via multiphoton ionization. Once a free electron is created, it accelerates in the photon field via inverse bremsstrahlung in course of collision with heavier species. After several bremmstrahlung absorption, the electron achieves sufficient kinetic energy to create another free electron via impact ionization. This eventually causes avalanche ionization, which results in rapid excitation, ionization, and dissociation of liquid medium into transient plasma at the focal volume (Noack & Vogel, Reference Noack and Vogel1999; Vogel et al., Reference Vogel, Nahen, Theisen and Noack1996a; Kennedy, Reference Kennedy1995). When the laser pulse is over, recombination processes begins, and the plasma is replaced by vaporized fluid mass, which constitutes cavitation bubbles within few µs (Petkovšek & Gregorčič, Reference Petkovšek and Gregorčič2007). Depending upon the focusing conditions and laser energy, single or multiple bubble formation may take place (Lim et al., Reference Lim, Quinto-Su, Klaseboer, Khoo, Venugopalan and Ohl2010; Yasuda et al., Reference Yasuda, Takahashi, Baba, Tei and Yamaguchi2008). In order to maintain the static equilibrium pressure with the surrounding liquid, the cavitation bubbles expand, collapse, and forms secondary bubbles. During bubble collapse liquid jets are formed and shockwaves are emitted, which carries away the excess energy into the surrounding liquid (Lauterborn & Hentschel, Reference Lauterborn and Hentschel1985). Laser generated bubbles are of special interest as it assists in tissue cutting, removal of thrombus from obstructed arteries, expulsion of bile duct stones via fragmentation and lithotripsy (Venugopalan et al., Reference Venugopalan, Guerra, Nahen and Vogel2002; Shangguan et al., Reference Shangguan, Casperson and Prahl1996; Carroll et al., Reference Carroll, Chandra, Papaioannou, Daykhovsky, Grundfest and Phillips1993; Zhong et al., Reference Zhong, Cocks, Cioanta and Preminger1997). However, the accompanying shockwaves and jets, induces cavitation erosion that are not always desirable as it results in dilation and collateral damage of adjacent tissues, hence laser assisted microsurgery requires well controlled and optimized experimental conditions (Jansen et al., Reference Jansen, Asshauer, Frenz, Motamedi, Delacrétaz and Welch1998; Vogel et al., Reference Vogel, Schweiger, Frieser, Asiyo and Birngruber1990, Reference Vogel, Engelhardt, Behnle and Parlitz1996b). Nevertheless, cavitation bubbles also has potential impact on purification of water, decomposition of organic compounds, underwater steam cleaning, etc. (Burns et al., Reference Burns, Yiacoumi and Tsouris1997; Yavas et al., Reference Yavas, Schilling, Bischof, Boneberg and Leiderer1997; Kruusing, Reference Kruusing2004; Takahashi et al., Reference Takahashi, Chiba and Li2007). The pressure waves generated during bubble collapse finds application in nuclear reactors, where pressure gradient causes surface erosion, which helps in detecting overheating in nuclear power plant (Ward & Emmony, Reference Ward and Emmony1991). The study of kinetics involved in cavitation bubble also has implication in double pulse laser induced breakdown spectroscopy where the first pulse produces cavitation bubble in liquid and the second pulse excites the plasma, and results in relatively intense and narrow spectral emission due to gaseous species inside the bubble (Giacomo et al., Reference Giacomo, Dell'Agilo, Pascale and Capitelli2007). This gives enhanced sensitivity and higher spectral resolution compared to the conventional laser-induced breakdown spectroscopy technique for detection of trace elements in water, rocks, sediments deep under the ocean, explosives, mine housing materials, and environmental pollutants, etc. (Lazic et al., Reference Lazic, Colao, Fantoni and Spizzicchino2005; Fang & Ahmad, Reference Fang and Ahmad2007; Michel et al., Reference Michel, Farr and Chave2006; Schade et al., Reference Schade, Bohling, Hohmann and Scheel2006; Casini et al., Reference Casini, Harith, Palleschi, Salvetti, Singh and Vaselli1991). The overall cavitation phenomenon has a highly complex, non-equilibrium, and transient character. Hence, most of the studies on cavitation bubble dynamics are restricted to single bubbles. Laser assisted multiple bubbles is poorly understood and are mostly subjected to theoretical work (Rungsiyaphornrat et al., Reference Rungsiyaphornrat, Klaseboer, Khoo and Yeo2003; Chesters & Hofman, Reference Chesters and Hofman1982). There are very few reports on experimentally developed optical and acoustic techniques to study multiple bubble phenomena (Lauterborn & Hentschel, Reference Lauterborn and Hentschel1985; Fong et al., Reference Fong, Adhikari, Klaseboer and Khoo2009; Kudryashov et al., Reference Kudryashov, Lyon and Allen2006). In view of the above mentioned importance of cavitation bubbles in laser processing in liquids, a great deal of research is required to understand the multiple bubble hydrodynamics during laser induced breakdown process. There is a need to study the growth, collapse, and pressure waves generated by laser assisted multiple bubbles. The formation of closely spaced bubbles and their mutual interaction are of special interest. In the present paper, spatial and temporal evolution of multiple bubbles generated via high power laser induced breakdown in water is reported. Optical pump probe based techniques, shadowgraphy, and beam deflection set-up are employed to study the cavitation bubble dynamics (Vogel et al., Reference Vogel, Busch and Parlitz1996c; Philipp & Lauterborn, Reference Philipp and Lauterborn1998; Alti and Khare, Reference Alti and Khare2006a, Reference Alti and Khare2006b; Nath & Khare, Reference Nath and Khare2008). The bubble-bubble interaction within the focal volume is analyzed and its effect onto the cavitation bubble dynamics is reported.
EXPERIMENTAL DETAILS
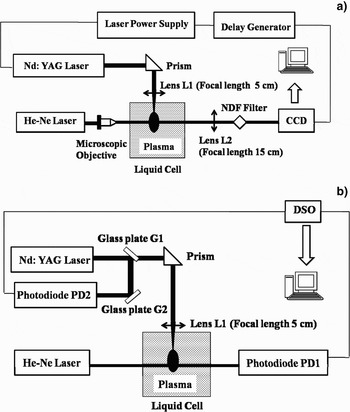
The schematic of the experimental set-up for imaging laser induced cavitation bubbles via shadowgraphy is shown in Figure 1a. A high power Q-switched Nd:YAG laser (Model No. Minilite I, λ = 532 nm, Energy = 10 mJ, pulse duration 10 ns) is focused (from top) inside a liquid cell filled with distilled deionized water (conductivity <1 µΩ−1). The dimension of the liquid cell is 1 × 1 × 4.5 cm3 and the focal spot size is 80 µm. This results in excitation, ionization, and dissociation of water molecules in the focal region, which leads to the formation of high density plasma followed by cavitation bubbles. A probe He-Ne laser (Model No. 05-LHP-927, λ = 632.8 nm, 75 mW) is aligned perpendicular to the direction of the incident beam to record the bubble images via shadowgraphy. Since the water plasma followed by cavitation bubbles extends up to the Rayleigh length of source laser, the probe beam is expanded by the microscopic objective (10×) to illuminate the focal volume and hence the bubbles. The expanded He-Ne beam after passing through the bubbles falls onto the charge-coupled device (CCD) (PCO PixelFly scientific) to record the images. The neutral density filter (optical density (DO) = 2.6) is used to control the intensity to avoid CCD saturation. Lens L2 is kept for 1:1 correspondence for unit magnification. For synchronization of the CCD with the laser pulse, a Q-switched synchronous output from the Nd: YAG laser is fed to trigger a pulse delay generator (Philips PM 5786 B). The delayed output pulse from the delay generator externally triggers the CCD at a desired interval. The minimum exposure time of the CCD is 10 µs. The size of the bubble is measured at a regular interval from the bubble images captured by the CCD.
(a) Schematic of experimental set-up for cavitation bubble imaging via shadowgraphy. (b) Schematic of Beam Deflection set-up.

To record the onset and collapse time of the bubbles, the beam deflection experiment (Fig. 1b) is conducted independently. A cw He-Ne laser is aligned transverse to the direction of Nd:YAG laser. The output of the He-Ne beam is made to pass through the breakdown region and is detected by photodiode (PD1). The photodiode (13 DSI 001) is aligned to detect the maximum signal corresponding to the center of the Gaussian beam from the output of the He-Ne laser. The formation of laser produced plasma followed by cavitation bubbles results in change in refractive index, which in turn deflects the He-Ne beam. The deflection is registered in the form of a dip (modulation) in PD1 signal. As the bubbles are over, the He-Ne beam comes back to its original path, and the photodiode to its initial level. The photodiode signal is displayed via 50Ω terminator on to the one of the channel of DSO (Tektronix TDS 2012) interfaced with computer. The DSO was triggered by 4% of 4% reflection of Nd:YAG laser beam from microscopic glass plates G1 and G2, detected by photodiode (PD2) and is displayed on another channel of DSO as reference point. To measure the deflection at different location with respect to focus, He-Ne laser and PD1 were moved simultaneously along the direction of the source Nd:YAG laser.
RESULTS AND DISCUSSION
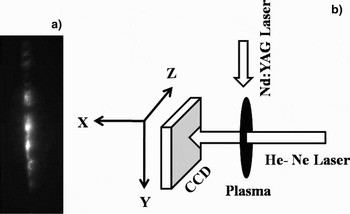
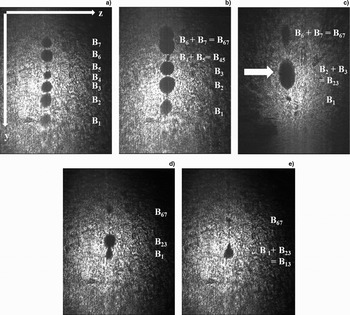
When a pulsed high power laser is focused inside a liquid media optical breakdown occurs at the focal volume. The breakdown region is not only confined at the focal spot but extends upto the Rayleigh length of the source Nd:YAG laser. This originates multiple breakdown sites and favors filamentous growth of plasma in the focal volume. The time integrated image of laser induced water plasma showing multiple breakdowns is shown in Figure 2a. After the laser pulse is over, plasma cooling begins, and multiple bubble starts developing at the multiple breakdown site. The multiple bubbles are recorded by shadowgraphic technique shown in Figure 1a. Figure 2b shows the geometry for capturing the bubble images. The He-Ne laser is illuminated along the x direction and the source Nd:YAG laser is incident along the y direction. The active area of CCD is in y-z plane and hence the cavitation bubble images in the y-z plane are recorded. The scan area of CCD is 8.6 mm × 6.9 mm and the Rayleigh length (R L) of Nd:YAG laser for a 5 cm focal length lens is about 3 mm. The observed bubbles are not only confined at the focal spot but extend up to the Rayleigh length of the laser beam, hence a cluster of closely spaced bubbles along the direction of incident laser are observed as shown in Figure 3. The approximated focus of the source laser is shown by the arrow in Figure 3c at a delay of 50 µs w.r.t. laser pulse. The image in Figure 3a show formation of seven bubbles (B1–B7) numbered sequentially at a delay of 12.5 µs after the laser pulse. When large numbers of closely spaced bubbles are formed, multiple bubble interaction becomes evident. At 30 µs, Figure 3b, the bubble continues to expand and bubbles B4–B5 and B6–B7 coalesce to B45 and B67, respectively. B6–B7 coalesces in-phase which involves merging of similar bubbles. When the two bubble surfaces are very close to each other, the bubbles coalesces or rebound depending upon the acting molecular and surface forces, and flow of the surrounding liquid. The liquid in the interfacial zone of two approaching bubbles flows out radically and gives an upward thrust to the trailing bubble. The remnant liquid at the interface gets trapped and compressed, and Van der Waal's forces become effective (Chesters & Hofman, Reference Chesters and Hofman1982). A hole is formed at the rim of the bubbles and surface tension results in expansion of the hole and hence the two bubbles merges into one. The approaching bubbles may also bounce back if the merging bubbles introduce large distortion and enhance the surface energy during the coalescence period. The images recorded at 50 µs show collapse of B1 and B67 and in-phase coalescence of B2–B3 to B23 at the approximated focus. The expansion at focus is at its maximum and on either side smaller bubbles are observed; therefore the out-of-phase coalesces between dissimilar bubbles becomes more probable. The CCD images taken at 60 µs show the out-of-phase coalescence between B1 and B23. B1 strongly influences the collapse of B23 in addition to the pressure gradient of surrounding liquid that normally initiates the collapse phase. The out-of-phase bubble coalesce is accompanied with jet formation (Lauterborn & Hentschel, Reference Lauterborn and Hentschel1985). The jet pierces bubble at the focus and influences its violent collapse as depicted in Figure 3e at 70 µs. It is apparent from the bubble images that the bubble moves collectively toward the direction of incident laser. When the laser is focused inside water, laser assisted bubble replaces fluid at the vicinity of the focus, and the vapor bubble propagates in the forward as well as backward front from the focus. On a larger time scales the effect of source term vanishes, the fluid mechanical phenomenon overtakes and the displaced fluid exerts an upward thrust to the vapor bubbles and forces it to move towards the incident laser.
(a) Time integrated image of water plasma. (b) Schematic for image plane recorded by CCD.

Cavitation Bubbles Images via shadowgraphy at delay of (a) 12.5 µs, (b) 30 µs, (c) 50 µs, (d) 60 µs, (e) 70 µs w.r.t the laser pulse (arrow mark shows the approximated focal spot).

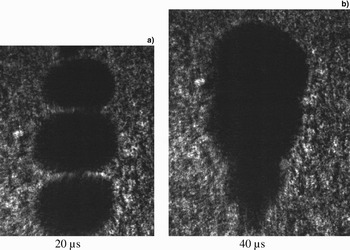
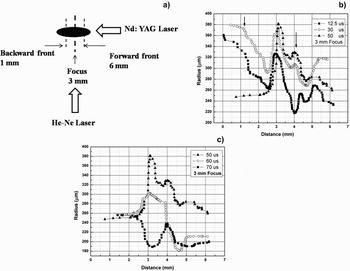
In the laser induced cavitation, fluctuation of multiple bubble coalescences makes the study of cavitation bubble highly asymmetric and complex. In some cases, three bubble coalesce were also observed as shown in Figure 4. The general trend of bubbles expansion and collapse was reproducible but some fluctuations due to shot to shot variation were observed. Hence CCD images for every data point were averaged over 40 shots. The spatial variation of bubble radius across the focal volume at different interval of time is shown in Figure 5. Figure 5a shows the position of forward and backward front of the cavitation bubbles with respect to the focus that is positioned at 3 mm. The distance 3–6 mm is the forward front and 1–3 mm is the backward front for the cavitation bubbles. Figures 5b and 5c shows the growth and collapsing phase of cavitation bubbles across the focal volume.
Multiple Bubble Interaction; Bubble coalescence at a delay of (a) 20 µs and (b) 40 µs.

(a) Schematic showing the forward and backward front of plasma w.r.t focus (3 mm focus, 1–3 mm backward front, 3–6 mm forward front). (b) Radius of cavitation bubbles after (a) 12.5 µs, (b) 30 µs, (c) 50 µs of the laser pulse. (c) Radius of cavitation bubbles across focal volume after (a) 50 µs, (b) 60 µs, (c) 70 µs of the laser pulse.

During the growing phase of bubbles as shown in Figure 5b, the expansion of bubble radius in the focal region continues until 50 µs and persists up to a distance of 2 mm w.r.t. the focus ( 3–5 mm) along the direction of incident laser. The calculated Rayleigh length (R L) is 3 mm so the intensity is high enough for perseverance of maximum bubble expansion up to 2 mm distance from the focus. Beyond these regions, at the backward (positions < 3 mm) and forward front (positions > 5 mm), relatively smaller bubbles are formed that decays after 30 µs. This is due to the energy gradient inducted by the Nd:YAG laser, which decays with distance from the focus. The formation of larger bubbles beyond the focal spot shown by an arrow is due to coalesce of smaller bubbles into larger bubbles.
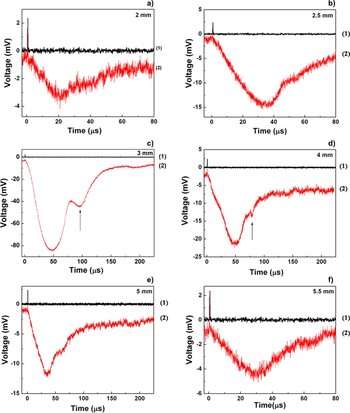
The collapse phase of cavitation bubbles, Figure 5c shows slight increase in radius at 70 µs in the backward front (distance < 2.5 mm) and forward front (4.5 mm), which is probably due to the formation of secondary bubbles. It is apparent from Figure 5 that the spatial evolution of cavitation bubbles across the focal volume shows a damped oscillatory behavior. These results are also complemented by BDS traces at different distance from the focal region as shown in Figure 6. Traces 1 and 2 in Figure 6 corresponds to the Nd:YAG laser trigger signal and beam deflection signal, respectively. Figures 6a and 6b represents the backward front, Figure 6c corresponds to the focal region, and Figures 6d–6f belongs to the forward front from the focus. The maximum dip of 80 mV in photodiode signal is observed at the focus, which decreases gradually on either side of the focus. The first dip in the BDS traces represents the primary bubble and the second dip represents the secondary bubble. The arrow in the traces show bubble rebound after the primary bubble collapse. Since the smaller bubble collapses earlier, onset of secondary bubbles is faster at distances away from the focus. The bubble rebound at focus starts at about 90 µs whereas at defocused condition, the earliest onset is at about 55µs at a distance of 0.5 mm from the focus at the backward front.
(Color online) Beam Deflection Traces across focal volume. Arrow mark shows the onset point for secondary bubbles (Black dash means trigger signal, Red dash means beam deflected signal).

For further confirmation of damped oscillatory behavior of bubble formation across the focal volume, Rayleigh's model for an empty cavity and Khoroshev's model for a gas filled transient cavity is used to analyze the spatial variation in bubble radius in the forward as well as backward front relative to the focal spot (Rayleigh, Reference Rayleigh1917; Khoroshev, Reference Khoroshev1963). Rayleigh's model (1) for empty cavity and Khoroshev's model (2) for gas filled cavity involves estimation of maximum bubble radius from the time of collapse of cavitation bubbles.
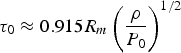

Where, τ0 is the bubble collapse time and R m is the corresponding maximum bubble radius. ρ is the density, and P 0 is the hydrostatic pressure. Q is the pressure at maximum radius R m, and P m is the ambient pressure that is assumed to be constant over the collapse period. P m varies with the distance from focal spot of the laser. For simplicity, the effect of surface tension and viscosity is not considered.
The time of collapse τ0 was measured from the BDS traces of Figure 6. The duration between the maximum deflection of first negative peak of primary bubble (start of collapse) and the onset point of second negative dip (secondary bubble) of the BDS traces is taken as the collapse time. P m and Q are estimated using Neppiras model for gas filled transient cavity.
The motion of a bubble wall undergoing adiabatic compression is given by Neppiras (Reference Neppiras1980):

Ṙ,  is the bubble wall velocity and acceleration, respectively, and γ is the ratio of specific heat for gas (γ is taken as 4/3). The minimum radius R min reached by collapsing cavity and the corresponding maximum collapse speed are given by Eqs. (4) and (5), respectively.
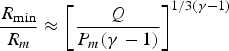

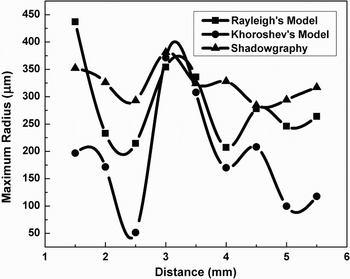
The maximum bubble velocity and minimum and maximum bubble radii are taken from shadowgraphic results. The maximum and minimum bubble radius at the focal spot is found to be 380 µm and 190 µm, respectively. Using Eqs. (4) and (5) the values for P m and Q are estimated. Figure 7 shows the maximum bubble radius variation across the focal volume measured using shadowgraphy and that of estimated from Rayleigh's and Khoroshev's model. It is apparent from Figure 7 that the bubble radius w.r.t. focus undergoes an oscillatory behavior. The radius measured via shadowgraphy is slightly larger in size than that of estimated from Khoroshev's and Rayleigh's model. The incident laser energy is at its maximum at the focus and decays radially on either side of the focus. The increase in bubble radius at focus is obvious due to the maximum deposition of laser energy, however on either side of focus increase in bubble radius is ascribed to bubble coalescences.
Variation of maximum bubblec radius across focal volume.

For laser generated bubbles, the cavity is not empty, it is filled with vaporized and gaseous species of water molecules and the bubbles collapse adiabatically into the surrounding liquid. Neppiras model for adiabatic compression for gas filled cavity is used to estimate maximum pressure inside the gas bubble during its collapse phase.
For adiabatic compression, maximum pressure P max reached by the gas is given by
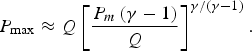
Using this equation, the maximum pressure attained by the gases inside the cavity is estimated. To measure liquid pressure at highest compression approximately, Rayleigh's model for empty single cavity is used (7)

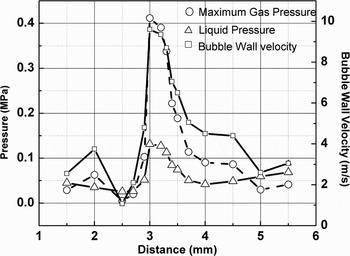
Figure 8 shows the maximum gas pressure, liquid pressure, and bubble wall velocity after 70 µs of the laser pulse as a function of distance form the focus. The calculated maximum gas pressure is 0.4 MPa and the maximum liquid pressure is 0.1 MPa. Pressures and the collapse velocity of bubbles are at its maximum at the focus and fall down on either side of it.
The variation in maximum pressure gained by the gases inside the bubble, liquid compression pressure and bubble wall velocity across the focal volume after 70 µs of the laser pulse.

CONCLUSION
Laser induced plasma in water resulted into formation of multiple bubbles aligned along the direction of incident laser beam. The closely spaced bubbles results in bubble coalesce and introduces a damped oscillatory behavior to an otherwise radially decaying bubbles on the either side of the focus. These phenomena are recorded by shadowgraphy and beam deflection traces. The out-of-phase bubble coalesce between dissimilar bubbles also influences the violent collapse of cavity at the focus. The time resolved cavity dynamics shows the smaller bubbles at the defocused condition collapses after 30 µs as compared to that of focal region that decays after 50 µs. The surrounding liquid also plays a dominant role in bubble coalesce as the thin film of liquid between two approaching bubble flows radially and circulates to give an upward thrust to the trailing bubble. The surrounding liquid also gives an upward force to the collective motion of bubbles along the source laser. Hence, for laser generated bubbles the ultimate profile of bubble radius across the focal volume is influenced by the combined effect of surrounding liquid, which results in growth and collapse of bubbles at different instants, the bubble-bubble interaction, and finally the energy gradient with in the focal volume by the source laser. In addition, laser induced bubble and the surrounding liquid experiences highly localized transient region of extreme pressures.