Implications
Play behaviour is common in young calves and is linked to energy intake. Dairy calves fed milk ad libitum grow considerably faster and display more play than those fed 10–15% BW of milk per day. In current weaning procedures, calves reduce their play. Adjusting weaning age according to an individual’s ability to eat solid feed maintains energy intake and weight gain during weaning. This may have positive implications on the welfare of calves, and play behaviour may be useful as a welfare assessment tool for growing animals.
Introduction
Positive welfare indicators, such as play behaviour, highlight the presence of good welfare (Boissy et al., Reference Boissy, Manteuffel, Jensen, Moe, Spruijt, Keeling, Winckler, Frokman, Dimitrov, Langbein, Bakken, Veissier and Aubert2007; Yeates and Main, Reference Yeates and Main2008). Locomotor play (consisting mainly of running, jumping and bucking) is common in young calves (Reinhardt, Reference Reinhardt1980; Jensen et al., Reference Jensen, Vestergaard and Krohn1998) and is susceptible to many welfare relevant factors such as food availability (Krachun et al., Reference Krachun, Rushen and de Passille2010), space allowance (Jensen and Kyhn, Reference Jensen and Kyhn2000; Mintline et al., Reference Mintline, Wood, de Passillé, Rushen and Tucker2012), social contact (Duve and Jensen, Reference Duve and Jensen2011) and pain (Rushen and de Passillé, Reference Rushen and de Passillé2012; Mintline et al., Reference Mintline, Stewart, Rogers, Cox, Verkerk, Stookey, Webster and Tucker2013). For young and growing animals, play behaviour has been proposed as an indicator of good management practices (Held and Špinka, Reference Held and Špinka2011).
For dairy calves, weaning off milk at the ages typical in dairy production can be stressful (Weary et al., Reference Weary, Jasper and Hotzel2008) and can result in reduced energy intake and poor growth (e.g. Sweeney et al., Reference Sweeney, Rushen, Weary and de Passille2010; Rushen and de Passillé, Reference Rushen and de Passillé2012). Locomotor play is also reduced at weaning but the correlation between energy intake and locomotor play is variable (Krachun et al., Reference Krachun, Rushen and de Passille2010; Sweeney et al., Reference Sweeney, Rushen, Weary and de Passille2010; Rushen and de Passillé, Reference Rushen and de Passillé2012) and the relationship with growth rate is unknown. Adjusting the weaning age of calves according to their individual intakes of solid feed can prevent the drop in energy intake and growth after weaning, but results in greater differences between calves in weight gains (WGs) during and immediately after weaning, and in the age and duration of weaning (Roth et al., Reference Roth, Keil, Gygax and Hillmann2009; de Passillé and Rushen, Reference de Passillé and Rushen2012). However, it is not known how this method of weaning affects locomotor play.
The aim of the study was to examine the effects on locomotor play of weaning calves off milk according to their intakes of solid feed. We examined whether locomotor play was maintained after weaning, and whether locomotor play was related to (a) digestible energy (DE) intake, (b) pre- and post- weaning growth and (c) age and duration of weaning.
Material and methods
The study was carried out in compliance with the Canadian Council on Animal Care Guidelines and approved by the Institutional Animal Care Committee.
Animals, housing and diet
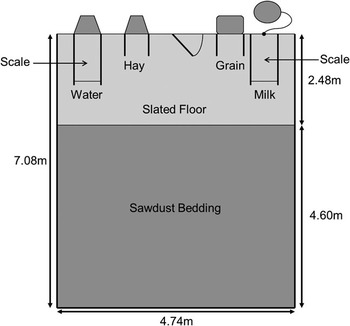
We used 56 Holstein heifer calves (mean birth weight 42.7 kg; range 30.0 to 56.1 kg) that were separated from their dams within 6 h of birth. Each calf was housed in individual pens (1.22×2.44 m) on wood shaving. They were bottle-fed ad libitum with whole milk twice daily and had constant access to water in buckets. At 6±1 days of age, the calves were moved to group pens (7.08×4.74 m) (Figure 1). Pens had slatted metallic floors (2.48×4.60 m) and a sawdust bedded area (4.6×4.74 m). Calves had access to automated feeders (CF 1000 CS Combi, DeLaval Inc., Tumba, Sweden) that provided whole milk (12 l/day at 40°C; herd averages of 3.97% fat, 4.10% protein and 3.30% lactose from bulk tank samples) and grain starter (ad libitum; CP=17.9% on DM basis; main ingredients: 16% wheat, 14% barley, 13% canola meal, 13% oats, 10% soya, 105 corn and 4% molasses, Unifeed Ltd., Chilliwack, BC, Canada). They also had ad libitum access to hay (DM=90.8%, CP=15.1%, NDF=51.1% and ADF=33.6%) and water troughs (Insentec, Marknesse, the Netherlands). Weigh scales (Smart1, Westernscale Inc., Port Coquitlam, BC, Canada) were located at the milk feeder and water trough. Automatic feeders were equipped with sensors that recognized each calf’s ear tag, allowing feeders to record individual’s intake and weight at each visit.
Layout of experimental group pen.

Treatments and experimental design
Once calves were moved to group pens, animals were assigned to one of the four weaning treatments balancing birth weight and age across treatments (de Passillé and Rushen, Reference de Passillé and Rushen2012); resulting in seven experimental pens with eight calves in each (two calves per treatment per pen). Treatment groups were based on starter intake target at the beginning and end of weaning following a 2×2 design (Low-High, Low-Low, High-Low and High-High). For two groups, weaning started when average grain consumption over 3 consecutive days was equal to or greater than 200 g/day (Low start). The remaining two groups started weaning when average grain consumption reached 400 g/day over 3 consecutive days (High start). Milk was reduced accordingly to grain consumption. Weaning was completed when average grain consumption over 3 consecutive days was 800 g/day (low end) or 1600 g/day (High end). If calves had not begun weaning by 74 days of age due to insufficient grain consumption, the milk feeder automatically weaned them over a 7-day period. This new group was named computer weaned.
Measurements
Behavioural observations
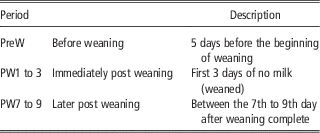
Locomotor play was assessed using continuous observation between 0800 and 2300 h for a total duration of 15 h per day. No observations were made between 2300 and 0800 h as locomotor play rarely occurs during this period (Krachun et al., Reference Krachun, Rushen and de Passille2010). We recorded the start and end time of each bout of running, enabling measurement of total duration and frequency of running bouts. Calves were observed for 2 days from each of three periods related to weaning (as defined in Table 1), totaling 6 days of behavioural observations. Five of the 6 observed days were chosen randomly within each period, the remaining observed day (immediately post weaning period: 1st day of no milk) was fixed for all the calves. We defined locomotor play as running: that is a rapid forward movement that may include jumping, bucking and/or kicking with one or two legs (Jensen et al., Reference Jensen, Vestergaard and Krohn1998; Jensen and Kyhn, Reference Jensen and Kyhn2000), lasting a minimum of 3 s (Krachun et al., Reference Krachun, Rushen and de Passille2010). Bucking and jumping that occurred independently of running were not recorded, since the duration of these behaviours was very short. If a calf did two running bouts that were <3 s apart, they were recorded as part of the same bout.
Observation periods

Three video cameras (Panasonic WV-BP 334; Panasonic, Osaka, Japan) connected to digital video recorders were located 6 m vertically above each group pen to record calves’ behaviour. Two red lamps fitted above the pens enabled recording throughout the night. Two cameras were located over the feeding area and one over the bedding area. We identified the individual calves using pictures of each animal taken from different angles (front, top, back, left and right). Videos from the different cameras were viewed simultaneously using Ommicast software (Genetech Inc., Saint-Laurent, Quebec) and EZViewLog500 software (Geovision Japan Inc., Tokyo, Japan) at 4× normal speed. There were four observers, with each observer watching two group pens and no overlap between the observers.
Reliability
To assess intra- and inter-observer reliability, all observers watched a sample video twice. In addition, we assessed the reliability half way through the observations for each group. Correlations for the intra- and inter-observer reliability ranged between 0.90 to 0.99 (Median=0.98) and 0.90 to 0.99 (Median=0.95), respectively.
Statistical analysis
All statistical analyses were conducted using Stata/SE 12.0. (Stata Corp 2011, Texas, USA). Data from five calves were excluded from the analysis: two calves were weaned too early due to technical problems with the milk feeder, two calves had health problems requiring veterinary treatment and one calf died. Therefore, the analysis included only data from 51 calves; nine calves from the High-High treatment, nine calves from High-Low, 11 calves from Low-High, nine calves from Low-Low and 13 calves from computer weaned group.
Weaning according to grain intake affected duration of weaning and when weaning started and ended (de Passillé and Rushen, Reference de Passillé and Rushen2012). Thus, this paper examines the relationship between DE intake, growth, age at weaning and weaning duration and measures of locomotor play. The total daily duration and the frequency of running bouts were calculated as the average of the values in the 2 days of each of the three observation periods (Table 1). The mean bout duration for each calf on each day was calculated by dividing the total duration by the frequency of bouts, and then averaged across the 2 observed days for each period. In order to study the relationship between energy intake and locomotor play, DE intake was calculated for the present study according to the observed days. Raw data for DE intake, BW and daily WG per day were obtained from de Passillé and Rushen (Reference de Passillé and Rushen2012) and adjusted according to the observation periods of the present paper. The mean daily DE intake for each calf was calculated from their intakes of milk, grain and hay, averaged across the 2 observation days and divided by the calf’s BW (MJ/kg). The DE for milk was considered to be 5.59 Mcal/kg (NRC, 2001); analysis of grain and hay gave DE of 3.48 and 2.40 Mcal/kg, respectively (Bodycote Testing Group Inc. Lethbridge, AB, Canada). BW and daily WG were calculated per day and averaged per observation period. Age of the calves for the before weaning period were based on the age at the beginning of this period (i.e. on the 1st day of the 5 days previous to the first reduction of milk). Data for the duration of weaning, age at which weaning began and at which was completed were used as in de Passillé and Rushen (Reference de Passillé and Rushen2012). Weaning duration was defined as total number of days taken for a calf to complete weaning, from the first decrease in milk intake to ‘0’ milk.
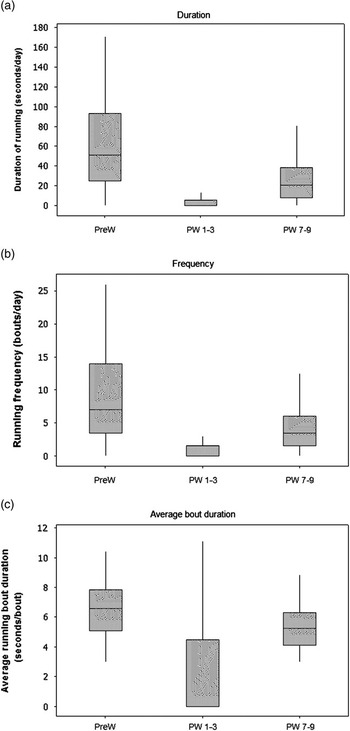
As the distributions of measures of running were highly positively skewed (Figure 2), non-parametric tests were used to analyse all data (Martin and Bateson, Reference Martin and Bateson2010). Kruskal–Wallis test (Petrie and Watson, Reference Petrie and Watson2006) was used to compare locomotor play measurements between weaning treatments per period and to compare age at when weaning started and ended, and the duration of weaning between weaning treatments. Wilcoxon test (Petrie and Watson, Reference Petrie and Watson2006) was used to test for differences between treatments in the age at which weaning started, ended and weaning duration; and to test for differences between consecutive periods of observation in the total running duration, frequency of running bouts, mean bout duration of running, and DE intake. We used Spearman’s correlations (Petrie and Watson, Reference Petrie and Watson2006) to examine the relationship between the three measure of running WG and DE intake in each period. Before weaning, Spearman’s correlations were also calculated between the three measures of running, age of the calves at this period and birth weight of the calves. Correlations were also calculated in the immediately post-weaning period (PW1 to 3) between the three measures of running, duration of weaning and age at which weaning began and was completed. To reduce the effect of differences between groups of calves, we ranked the values for all variables within groups before calculating the correlations. Results are presented as 25th percentile – Median – 75th percentile and a P-value of ⩽0.05 was specified to indicate significant differences.
Duration (a), frequency (b) and average bout duration (c) of running at each observation period: before weaning (PreW), immediately post weaning (PW1 to 3) and later post weaning (PW7 to 9).

Results
Effect of weaning treatment groups
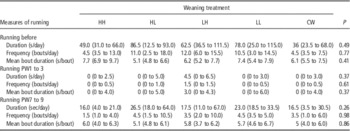
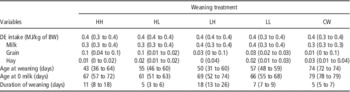
No significant differences between the weaning treatment groups in each period were observed for total duration, frequency and mean bout duration of running (Table 2). Milk, grain and hay DE intake per kilogram of BW before weaning are shown in Table 3. Weaning treatments affected the age when weaning started (P<0.001), ended (milk ‘0’, P<0.001) and the duration of weaning (P<0.001) (Table 3).
Median and inter-quartile range (IQR) for duration, frequency and mean bout duration of running before weaning (PreW), immediately post weaning (PW1 to 3) and late post weaning (PW7 to 9) according to weaning treatment groups

HH=High-High (weaning started at 400 g/day ended at 1600 g/day); HL=High-Low (weaning started at 400 g/day and ended at 800 g/day; LH=Low-High (weaning started at 200 g/day and ended at 1600 g/day); LL=Low-Low (weaning started at 200 g/day and ended at 800 g/day); CW=computer weaned.
Median and inter-quartile range (IQR) of total digestible energy (DE) intake per kilogram of BW and from each feed (milk, hay and grain) before weaning; and the median (IQR) of age (days) at weaning (day of first reduction of milk) and age (days) at ‘0’ milk and duration of weaning (days) according to treatment groups

HH=High-High (weaning started at 400 g/day ended at 1600 g/day); HL=High-Low (weaning started at 400 g/day and ended at 800 g/day; LH=Low-High (weaning started at 200 g/day and ended at 1600 g/day); LL=Low-Low (weaning started at 200 g/day and ended at 800 g/day); CW=computer weaned.
Variability between calves
There were large differences between both individual calves and during the three periods in the amount of running they performed (Figure 2). The total duration of running in the period immediately following weaning was significantly lower than before weaning (W=11379.63; P<0.001) and increased in the subsequent period (W=11376.63; P<0.001) (Figure 2). The daily frequency of running bouts followed a very similar pattern, being higher before weaning than immediately after weaning (W=11373.75; P<0.001), and increasing in the next post-weaning period (W=11362.88; P<0.001) (Figure 2). Changes in the mean bout duration followed a similar pattern: mean bout duration was lower immediately after weaning compared with before (W=11379.75; P<0.001) and increased slightly in the second post-weaning period (W=11367.13; P<0.001) (Figure 2).
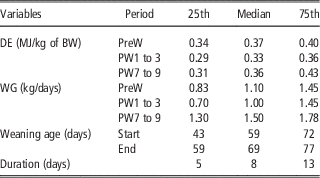
Table 4 shows the variation between calves in DE intake and daily WG for each observation period, as well as the distribution of weaning ages and duration of weaning. DE intake decreased significantly immediately after weaning (PW1 to 3) compared with before weaning (PreW) (W=11364.63; P<0.001), and the variability between calves appeared to increase slightly (Table 4). DE intake increased during the second post-weaning period (PW7 to 9) in comparison to the previous period (PW1 to 3) (W=11367.00; P<0.001).
Medians and 25th and 75th percentile for digestible energy intake (DE) per kilogram of BW and weight gain (WG) before weaning (PreW), immediately post weaning (PW1 to 3) and later post weaning (PW7 to 9) and age at start of weaning (Start), age at end of weaning (End) and duration of weaning in days (Duration)

Relationship between locomotor and other traits
Before weaning, the age of the calves when the observations were taken was negatively correlated with the total duration of running (r=−0.36; P=0.009) and running bout frequency (r=−0.38; P=0.006); but no significant correlation was observed with mean bout duration (P=0.88). The birth weight of the calves was not correlated with the total duration of running (r=0.11; P=0.43) and the running bout frequency (r=0.03; P=0.84); but it was positively correlated with mean bout running duration (r=0.30; P>0.04). During the immediately post-weaning period (PW1 to 3), none of the variables of age related to weaning (age when weaning began and age when it ended) and weaning duration correlated with running duration, running frequency or mean bout duration (P>0.10).
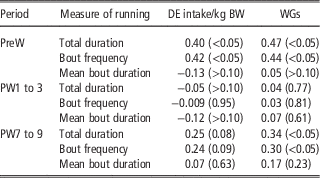
Table 5 shows the correlations between the three measures of running, DE intake and WG of the calves in each period. Before weaning (PreW), DE intake correlated with the total duration of running and the frequency of running bouts, but not with mean bout duration. Similar findings were observed between WGs and all three measures of running (Table 5). Immediately after weaning (PW1 to 3), neither DE intake nor WG correlated with any variable of running. In the subsequent post-weaning period (PW7 to 9), we observed similar findings to the before weaning period (PreW): DE intake correlated with total duration of running and the frequency of running bouts, but not with mean bout duration. WGs positively correlated with both total duration of running and frequency of running bouts, with a non-significant trend for a correlation with mean bout duration (Table 5).
Spearman’s correlations (and probability ‘P’ in parentheses) between the total duration of running, frequency of running bouts and mean bout duration of running bouts digestible energy intake (DE) per kilogram of BW and weight gain (WG) before weaning (PreW), immediately post weaning (PW1 to 3) and later post weaning (PW7 to 9)

Discussion
Our results demonstrate that the amount of locomotor play showed before and after weaning reflect both the energy intake and growth rates in dairy calves. Locomotor play was markedly reduced in the period immediately following weaning, confirming previous findings (Krachun et al., Reference Krachun, Rushen and de Passille2010). This decrease in total duration of running was associated with a reduction in both frequency of bouts and mean bout duration. The reduction in frequency of bouts may reflect that the calf is less likely to start a running event. Additionally, the reduction of mean bout duration may indicate that the calf did not continue running or switch to an alternative behaviour. The decrease after weaning occurred despite the fact that the weaning method prevented the large drop in energy intake that often occurs during weaning (de Passillé and Rushen, Reference de Passillé and Rushen2012). This suggests that the decrease in locomotor play following weaning is not solely due to a decrease in energy intake, as no correlation was observed immediately after weaning and may reflect the emotional responses of calves to weaning (Budzynska and Weary, Reference Budzynska and Weary2008). Alternatively, it could be a specific response to the loss of milk, because the improved energy intake after weaning can only result from an increase in the amount of solid feed ingested.
We found a relationship between locomotor play and both energy intake and WG before and after weaning. Before weaning, calves that ran more had better WGs and tended to have higher energy intake. Previously, Krachun et al. (Reference Krachun, Rushen and de Passille2010) found a positive correlation between energy intake and locomotor play after weaning, with variable correlations before weaning, but the correlation with WG was not examined. Low levels of energy intake have been found to reduce play in other animals such as deer fawn and foals (Müller-Schwarze et al., Reference Müller-Schwarze, Stagge and Müller-Schwarze1982; Pollard and Littlejohn, Reference Pollard and Littlejohn2000; Nicol et al., Reference Nicol, Badnell-Waters, Nice, Kelland, Wilson and Harris2005). Immediately after weaning we did not find similar relationships. The relationships between locomotor play, WG and energy intake were also observed 7 to 9 days after weaning was completed. The previously unreported link between running and WG and energy intake provides further support for the suggestion that locomotor play may be a sign of good welfare for growing animals (Held and Špinka, Reference Held and Špinka2011), especially at a time when their growth potential is high.
These results add to the growing body of research that has observed a link between individual animals behaviour and both energy intake and growth rates (e.g. Stanton, Reference Stanton2012). Dairy calves differ greatly in their growth responses to weaning: low energy intake and WGs have been found to be associated with reduced locomotor play (Krachun et al., Reference Krachun, Rushen and de Passille2010), and increased cross-sucking but not vocalizations (de Passillé et al., Reference de Passillé, Sweeney and Rushen2010). However, the moderate size of the correlations reported in this study suggests a large individual variation in the amount of locomotor play calves showed that were not related to energy intake or WG. The source of these individual differences deserves to be further investigated before measures of play behaviour can be used to assess the effects of management practices on animal welfare.
Although the amount of running did recover somewhat 7 to 9 days after weaning, it remained lower than before weaning. This was despite the fact that DE intake was higher during this time compared with before weaning. The decrease in running may reflect the fact that as calves age, they tend to carry out less locomotor play (Jensen and Kyhn, Reference Jensen and Kyhn2000; Krachun et al., Reference Krachun, Rushen and de Passille2010), as we observed in the before weaning period. This change has been found for other species such as gazelles and cheetahs (Gomendio, Reference Gomendio1988; Caro, Reference Caro1995). Locomotor play in cattle and other animals has been reported to decline at the same time as other types of play increase, that is social play (Vitale et al., Reference Vitale, Tenucci, Papini and Lovari1986; Jensen and Kyhn, Reference Jensen and Kyhn2000; Burghardt, Reference Burghardt2005), suggesting that the reduction in locomotor play observed may reflect a real developmental trend in the types of play that calves show at older ages.
Conclusion
After weaning, the amount of locomotor play shown by a calf is correlated with energy intake and WG. Adjusting the weaning of calves according to intake of solid feed does improve energy intake and WG during and after weaning but does not prevent the marked reduction in locomotor play that occurs immediately after weaning. This suggests that reduction in energy intake is not the sole reason why locomotor play decreases at weaning. The occurrence of locomotor play during and immediately after weaning off milk may be a behavioural indicator that a calf is adapting to weaning and is able to maintain its energy intake and WG. These results support suggestions that measures of locomotor play in young calves can be used to assess farm management practices associated with weaning, but more research is needed to understand the effect of other factors on the amount of locomotor play that calves show.
Acknowledgements
The authors thank J. P. Parent, Ruby Wong, Jason and Gosia Zdanowicz. They also thank the staff at the Ethology Lab (Agriculture and Agri Food Canada, Agassiz, BC, Canada) and the dairy staff (University of British Columbia, Agassiz, BC) for their invaluable help. Funding was provided by Agriculture and Agri-Food Canada and the Natural Sciences and Engineering Research Council of Canada (both Ottawa, ON, Canada).