Introduction
In recent years, research projects dedicated to the examination of gene expression levels in oocytes have been actively developed (Zhang et al., Reference Zhang, Gu, Zhang, Sun, Qian, Zhou, Wan, Jia, Wang and Wang2013; Zare et al., Reference Zare, Abouhamzeh, Masteri Farahani, Salehi and Mohammadi2017; Gumus et al., Reference Gumus, Sari, Yilmaz and Cetin2018). Determination of gene expression levels may be important for the quantification of oocyte quality, therefore making possible the evaluation of the assisted reproductive technology (ART) protocol applied, such as oocyte in vitro maturation (IVM) or ovarian follicle in vitro culture followed by oocyte retrieval for further fertilization. Quantitative real-time PCR is a standard method for gene expression analysis. Nevertheless, investigation of gene expression requires careful selection of reference genes (which are also often called housekeeping genes) for normalization (Kozera and Rapacz, Reference Kozera and Rapacz2013; Chapman and Waldenström, Reference Chapman and Waldenström2015). Despite the large number of studies in the field of reference gene selection, there is evidence that the expression of genes ordinarily used as reliable internal controls often depends on the specific experimental conditions and samples (Zhong and Simons, Reference Zhong and Simons1999; Selvey et al., Reference Selvey, Thompson, Matthaei, Lea, Irving and Griffiths2001). Therefore, it is very important to select appropriate genes that display a stable expression pattern in the experimental probes (Nikishin et al., Reference Nikishin, Filatov, Kiseleva, Bagaeva, Konduktorova, Khramova, Malinova, Komarova and Semenova2018).
Nowadays, there are only a few research works dedicated to reference gene selection for gene expression analysis in mammalian oocytes (Kuijk et al., Reference Kuijk, du Puy, van Tol, Haagsman, Colenbrander and Roelen2007; Mamo et al., Reference Mamo, Gal, Bodo and Dinnyes2007, Reference Mamo, Gal, Polgar and Dinnyes2008; Kumar et al., Reference Kumar, Yadav, Verma, Singh, De and Datta2012; O’Connor et al., Reference O’Connor, Wilmut and Taylor2013; Macabelli et al., Reference Macabelli, Ferreira, Gimenes, de Carvalho, Soares, Ayres, Ferraz, Watanabe, Watanabe, Sangalli, Smith, Baruselli, Meirelles and Chiaratti2014; Wang et al., Reference Wang, Li, Song and Yang2017). The mouse is the most commonly used animal model for research studies. Therefore, the selection of appropriate reference genes for mouse oocytes is one of the most important tasks, it is the first step required to enable further investigation of target gene expression in mouse oocytes. The studies of Macabelli et al. (Reference Macabelli, Ferreira, Gimenes, de Carvalho, Soares, Ayres, Ferraz, Watanabe, Watanabe, Sangalli, Smith, Baruselli, Meirelles and Chiaratti2014), O’Connor et al. (Reference O’Connor, Wilmut and Taylor2013) and Kumar et al. (Reference Kumar, Yadav, Verma, Singh, De and Datta2012) were performed on bovine and ovine oocytes and the studies of Wang et al. (Reference Wang, Li, Song and Yang2017), Kuijk et al. (Reference Kuijk, du Puy, van Tol, Haagsman, Colenbrander and Roelen2007) and Mamo et al. (Reference Mamo, Gal, Polgar and Dinnyes2008) were performed on swine and rabbit oocytes, respectively. Although, the general regulation of meiosis in oocytes of different mammalian species is the same, there are some distinctions in the processes of meiosis. Therefore, the works of Macabelli et al. (Reference Macabelli, Ferreira, Gimenes, de Carvalho, Soares, Ayres, Ferraz, Watanabe, Watanabe, Sangalli, Smith, Baruselli, Meirelles and Chiaratti2014), O’Connor et al. (Reference O’Connor, Wilmut and Taylor2013), Kumar et al. (Reference Kumar, Yadav, Verma, Singh, De and Datta2012) Wang et al. (Reference Wang, Li, Song and Yang2017), Kuijk et al. (Reference Kuijk, du Puy, van Tol, Haagsman, Colenbrander and Roelen2007) and Mamo et al. (Reference Mamo, Gal, Polgar and Dinnyes2008) can be a starting point for identifying the most consistently expressed reference genes in mouse oocytes. The survey of Mamo et al. (Reference Mamo, Gal, Bodo and Dinnyes2007) was carried out on mouse oocytes. However, more than 10 years have passed since the publication of this work. Only one mathematical approach called geNorm (Vandesompele et al., Reference Vandesompele, De Preter, Pattyn, Poppe, Van Roy, De Paepe and Speleman2002) for the selection of reference genes was used in that study. New and more accurate mathematical algorithms that allow evaluation of the stability of reference gene expression have appeared. Furthermore, Mamo et al. (Reference Mamo, Gal, Bodo and Dinnyes2007) performed analysis to evaluate the stability of reference gene expression levels in oocytes that resumed first meiotic division in comparison with the further stages of mouse embryo development (zygote, 2-cell embryo, morula and blastocyst). In the current study we used oocytes from the earlier germinal vesicle (GV) stage, when the nuclear envelope of the oocyte is intact.
In the current study, evaluation of reference gene stability was performed on oocytes retrieved from mature and immature mice. Seven most commonly used reference genes from different functional classes were selected to minimize the risk of their co-regulation: β-actin (Actb), eukaryotic translation elongation factor 1 epsilon 1 (Eef1e1), glyceraldehyde-3-phosphate dehydrogenase (Gapdh), H2A histone family, member Z (H2afz), peptidylprolyl isomerase A (Ppia), ribosomal protein L4 (Rpl4) and ubiquitin C (Ubc).
Materials and Methods
Animals
C57BL/6J mice were purchased from the animal house of the Federal Medical Biological Agency, Branch ‘Andreevka’. Animals were maintained under controlled room conditions (22–24°C and a 14 h light:10 h dark photoperiod). Mice were given ad libitum access to food and water. All manipulations with animals were performed accordingly to the Moscow State University Bioethical Committee recommendations.
Oocyte collection
In the current work we used oocytes retrieved from two groups of animals. The first group contained oocytes obtained from immature mice (21–24 days old) and oocytes from the second group were retrieved from the adult mice (3 months old) at the proestrus stage of the estrous cycle. The estrous cycle stages were evaluated by vaginal smears as described previously (Zenclussen et al., Reference Zenclussen, Casalis, Jensen, Woidacki and Zenclussen2014).
Mice were sacrificed by cervical dislocation and ovaries were removed and placed into pre-equilibrated HEPES-containing medium (Human Tubal Fluid Medium, Irvine Scientific). in a CO2/air incubator. Then, ovaries were dissected using insulin needles and oocytes were collected and measured. Only denuded oocytes with no attached cumulus cells or oocytes with small numbers of cumulus cells were used in this study. Cumulus cells were removed from the oocytes by gentle pipetting of oocytes three times. Oocytes were divided into groups, 10 oocytes in each group, for further qRT-PCR analysis. For the analysis, eight samples (each sample contained 10 oocytes) were obtained from each group.
cDNA synthesis
Synthesis of cDNA libraries was carried out using the commercial kit SuperScript III cDNA Synthesis CellDirect (ThermoFisher, USA) following the manufacturer’s instructions. All obtained cDNA samples were stored at −20°C until qRT-PCR analysis.
Primer design for selected candidate reference genes
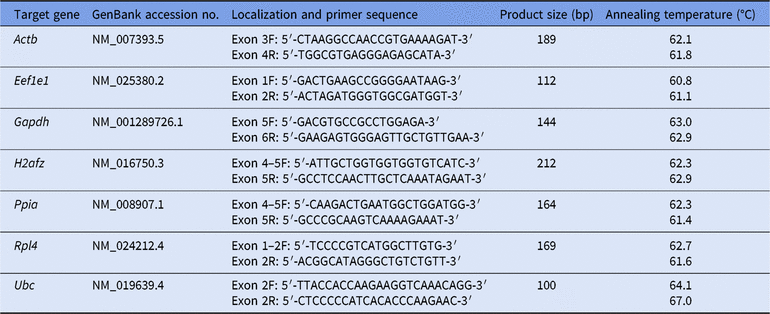
Primer design (Table 1) was performed using Lasergene PrimerSelect (DNASTAR) software and the online utility Blast (https://www.ncbi.nlm.nih.gov/tools/primer-blast/) using sequences from the NCBI GenBank database.
Reference genes for gene expression normalization

Quantitative real-time PCR
Quantitative RT-PCR was carried out on a StepOnePlus real-time PCR system (Applied BioSystems, USA) using SYBR® green I with ROX™ as an internal loading standard. The qPCRmix-HS SYBR+ROX kit (Evrogen, Russia) was utilized for all reference gene qRT-PCR assays, according to the manufacturer’s protocol. Each reaction contained: 0.5 µl of solution containing forward primers (0.5 µM), 0.5 µl of solution containing reverse primers (0.5 µM), 5 µl of 5× qPCRmix-HS SYBR+LowROX, 0.5 µl of solution containing template cDNA obtained using the commercial kit SuperScript III cDNA Synthesis CellDirect in accordance with the manufacturer’s recommendations, and 18.5 µl of diethylpyrocarbonate (DEPC)-treated and autoclaved water. Lyophilized primers were previously diluted with DEPC-treated and autoclaved water.
PCR cycles were run as follows: 2 min at 50°C, then denaturation for 10 min at 95°C followed by 40 cycles of 15 s at 95°C, and 1 min at 60°C. Fluorescence was measured following each annealing and extension phase. A melt curve was produced to confirm a single gene-specific peak and to detect primer/dimer formation by heating the samples from 70 to 95°C in 0.5°C increments with a dwell time of 10 s at each temperature, while continuously monitoring the fluorescence. The reactions were set up in a 96-well PCR plate (Applied BioSystems, USA) in three technical replicates.
Controls included non-RT controls (total RNA without reverse transcription was used to monitor genomic DNA contamination) and non-template controls (water template). For total RNA isolation the same protocol as for cDNA synthesis was used, but water was added to the samples instead of the reverse transcriptase from the kit.
Data analysis
Statistical significance of oocyte diameters differences between samples from different groups was calculated using the Mann–Whitney U-test. Also the Mann–Whitney U-test was used to find the differences in the Ct levels of the examined reference genes between samples from mature and immature oocytes. To test the hypothesis of normal distribution the Kolmogorov–Smirnov and Lilliefors normality test was used. The Kolmogorov–Smirnov and Lilliefors normality test, Mann–Whitney U-test and calculation of standard error of the mean (SEM) were performed using Statistica 7.0 software (Dell, Inc., USA). Differences were considered statistically significant if the P-value was < 0.05. The expression stability of seven selected internal control genes was evaluated using three commonly used freeware software tools: geNorm v.3.5 (Vandesompele et al., Reference Vandesompele, De Preter, Pattyn, Poppe, Van Roy, De Paepe and Speleman2002), BestKeeper (Pfaffl et al., Reference Pfaffl, Tichopad, Prgomet and Neuvians2004) and NormFinder (Andersen et al., Reference Andersen, Jensen and Ørntoft2004).
The inner diameter of the oocyte excluding the zona pellucida was calculated using freely available ImageJ software (NIH, USA).
Results
We measured oocytes diameters and analyzed the retrieved data. The median value of oocyte diameter in the group of oocytes retrieved from immature mice was approximately 68 μm, and the median value of oocyte diameter in the group of oocytes retrieved from mature mice was approximately 76 μm. Analysis of the data showed that there is a statistically significant difference in oocyte diameters between these two groups (Mann–Whitney U-test, P < 0.05). These results correlated well with previously obtained data (Otoi et al., Reference Otoi, Fujii, Tanaka, Ooka and Suzuki2000). Therefore, based on measurements of diameters we could conclude that oocytes obtained from mature and immature mice belong to different groups. This conclusion is essential for adequate mathematical analysis because the above-mentioned software tool required data on gene expression levels obtained from two different groups of samples (Andersen et al., Reference Andersen, Jensen and Ørntoft2004). Data obtained from both mature and immature mouse oocytes were used for the analysis.
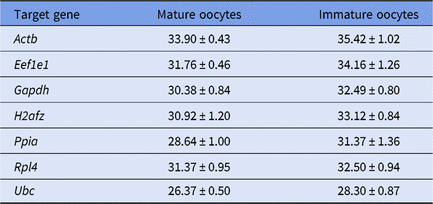
The Ct levels in oocytes from two groups (mature and immature ones) were measured. The Ct value for each gene in sample was calculated as the arithmetic mean of three technical replicates. The Ct values are given in Table 2. Interestingly, the mean Ct levels of all seven examined candidate reference genes were higher in immature oocytes in comparison with mature oocytes, indicating that the number of initial cDNA matrices in immature oocytes may be lower. There are two possible reasons of such differences in expression levels. The first one is potential difference in RNA extraction or cDNA synthesis between two groups of oocytes, however this hypothesis seems to be rather weak as the same protocol was applied for both groups of samples. Another reason of such discrepancies may lie in the different status of retrieved oocytes. The mean volume of mature oocyte was approximately 1.4-fold larger in comparison with immature oocyte volume. Furthermore, it is well known that during prophase I meiotic arrest, mammalian oocytes grow and accumulate various molecules and organelles that will be necessary for early embryo development, thereby oocytes acquire the ability to resume meiosis, i.e. oocyte maturation (Filatov et al., Reference Filatov, Khramova and Semenova2018). Therefore, accumulation of key housekeeping gene mRNAs followed by an increase in oocyte volume seems to be logical. However, there are no statistically significant differences (P > 0.05) in the Ct levels for all the examined genes across the two groups of oocytes. Therefore, the Ct levels data from mature and immature oocytes can be considered as one population.
The mean of Ct values ± standard error of the mean (SEM) of investigated reference genes in mice oocytes (samples n = 8 for both groups)

The Ct values of seven reference genes were analyzed using three different software tools (geNorm, BestKeeper, and NormFinder) to identify the reference genes with stable expression. The Ct values of stably expressed reference genes that may be used in further research work dedicated to the examination of target genes expression levels were sought.
As there was no statistically significant differences in the Ct values between the groups of mature and immature oocytes, the Ct levels data from both groups of oocytes were considered as one population for analysis using geNorm and BestKeeper programs.
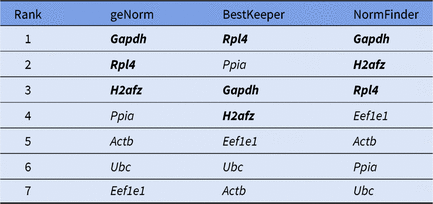
geNorm is software program that is commonly used to identify the most stably expressed reference genes (Vandesompele et al., Reference Vandesompele, De Preter, Pattyn, Poppe, Van Roy, De Paepe and Speleman2002). In this software, a complex approach is used to analyze gene expression stability. As a result, the M value (the parameter of gene expression stability) of each gene is calculated. The gene with the lowest M value may be accepted as the most stably expressed gene. In mouse GV oocytes, geNorm ranked Gapdh and Rpl4 as the most stable reference genes (M value = 1.238 and 1.259, respectively), followed by H2afz (M value = 1.533) and Ppia (M value = 1.539). The other genes were ranked from most to least stable as follows: Actb > Ubc > Eef1e1.
BestKeeper is also a software tool applied to identify the most suitable reference genes (Pfaffl et al., Reference Pfaffl, Tichopad, Prgomet and Neuvians2004). Analysis of gene expression stability is based on calculation and comparison of the correlation coefficients for all possible pairs of candidate reference genes. In mouse GV oocytes the BestKeeper software tool classified Rpl4 and Ppia as the most stable reference genes. The other genes were ranked from most to least stable as follows: Gapdh > H2afz > Eef1el > Ubc > Actb.
NormFinder is another software tool that allows selection of the most stable reference genes. NormFinder measures intragroup and intergroup variations in gene expression stability. Then, the examined reference genes are ranked according to their expression stability (Andersen et al., Reference Andersen, Jensen and Ørntoft2004). Immature and mature oocytes were selected as two different groups as mature and immature oocytes have different diameters. In mouse GV oocytes the NormFinder tool determined Gapdh and H2afz as the most stable pair of genes, followed by Rpl4 and Eef1e1. The other genes were ranked from most to least stable as follows: Actb > Ppia > Ubc.
The summary list of genes ranked by three software tools (geNorm, BestKeeper and NormFinder) is given in the Table 3. It should be noticed that according to the data obtained in the current study, Actb is unsuitable as a reference gene in mouse oocytes even though it is one of the most commonly used reference genes mentioned in many research studies. All software applications (geNorm, BestKeeper and NormFinder) classified Actb as a gene with unstable expression. Furthermore, Ubc, which shows the highest expression levels among all the examined candidate reference genes, also has been classified as one of least stable expressed genes by three software tools: geNorm, BestKeeper and NormFinder.
Reference genes ranked by their expression stability in mice mature and immature GV oocytes by three most commonly used software tools: geNorm, BestKeeper, NormFinder. The genes considered by the authors as the most stable reference genes are marked by bold letters

Discussion
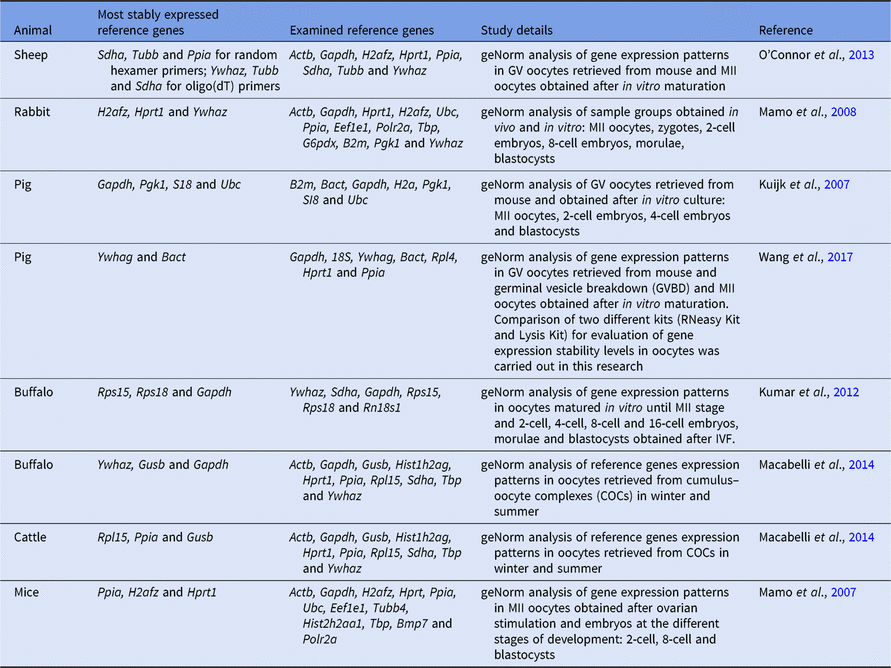
Several research studies dedicated to the evaluation of reference gene expression level stability in mammalian oocytes have been performed previously (Mamo et al., Reference Mamo, Gal, Bodo and Dinnyes2007, Reference Mamo, Gal, Polgar and Dinnyes2008; Kuijk et al., Reference Kuijk, du Puy, van Tol, Haagsman, Colenbrander and Roelen2007; Kumar et al., Reference Kumar, Yadav, Verma, Singh, De and Datta2012; O’Connor et al., Reference O’Connor, Wilmut and Taylor2013; Macabelli et al., Reference Macabelli, Ferreira, Gimenes, de Carvalho, Soares, Ayres, Ferraz, Watanabe, Watanabe, Sangalli, Smith, Baruselli, Meirelles and Chiaratti2014; Wang et al., Reference Wang, Li, Song and Yang2017). Key data obtained in these research studies are listed in the Table 4. Interestingly, genes with the most stable expression patterns differ across different mammalian species. It should be mentioned that selection of the most stable reference genes depends on many factors such as primers used for PCR, protocol of cDNA synthesis, methods of mathematical analysis, and type of probes. In works of Kuijk et al. (Reference Kuijk, du Puy, van Tol, Haagsman, Colenbrander and Roelen2007) and Wang et al. (Reference Wang, Li, Song and Yang2017) different genes were selected as the most stable reference genes for porcine oocytes. The same situation was observed in works of Kumar et al. (Reference Kumar, Yadav, Verma, Singh, De and Datta2012) and Macabelli et al. (Reference Macabelli, Ferreira, Gimenes, de Carvalho, Soares, Ayres, Ferraz, Watanabe, Watanabe, Sangalli, Smith, Baruselli, Meirelles and Chiaratti2014) performed on bovine oocytes. Such differences in results may be explained by using the different sets of candidate reference genes and primer pairs in the above-mentioned works. Furthermore, in the research of Wang et al. (Reference Wang, Li, Song and Yang2017) it has been shown that the results of gene expression stability depend on the type of protocol applied for cDNA synthesis. Intriguingly, the final results of gene expression stability also depend on the primers used for cDNA synthesis. Therefore, in the work of O’Connor et al. (Reference O’Connor, Wilmut and Taylor2013) it was been shown that in ovine oocytes the most stable reference genes may alter depending on primers used for cDNA synthesis: Sdha, Tubb and Ppia in the case of random hexamer primers and Ywhaz, Tubb and Sdha in the case of oligo(dT) primers.
Researches dedicated to the examination of stable expressed reference genes in mammalian oocytes

In the current study we used oocytes at the GV stage because, in GV oocytes, maternal mRNAs are bound by MSY2 protein, which prevents their destruction. Once oocyte meiotic resumption is induced, phosphorylation of MSY2 occurs, resulting in maternal mRNAs degradation (Mehlmann, Reference Mehlmann2013). Therefore, determination of stable reference genes in GV oocytes is needed for further research works that require evaluation of total maternal mRNA transcript levels in oocytes; the data obtained in the current study will allow the performance of this kind of analysis.
The results of the current work differ from that described previously in the work of Mamo et al. (Reference Mamo, Gal, Bodo and Dinnyes2007) except for one gene (H2afz). We have also shown stable expression of H2afz in mouse oocytes. Based on this, we concluded that this gene can be used as the reference gene that corresponds with results of Mamo et al. (Reference Mamo, Gal, Bodo and Dinnyes2007). The reason for discrepancies in these two studies may be as follows: different sets of genes selected for analysis were used; different primer pairs and cDNA synthesis protocols were applied; oocytes at different stages of meiotic resumption were used (MII in the work from Mamo et al. (Reference Mamo, Gal, Bodo and Dinnyes2007) versus GV oocytes in the current work). Moreover, in this research, the three most commonly used software tools were applied to analyze gene expression stability: geNorm (Vandesompele et al., Reference Vandesompele, De Preter, Pattyn, Poppe, Van Roy, De Paepe and Speleman2002), BestKeeper (Pfaffl et al., Reference Pfaffl, Tichopad, Prgomet and Neuvians2004) and NormFinder (Andersen et al., Reference Andersen, Jensen and Ørntoft2004), whereas in other studies dedicated to identifying the most suitable reference genes in mammalian oocytes only geNorm software was used (Kuijk et al., Reference Kuijk, du Puy, van Tol, Haagsman, Colenbrander and Roelen2007; Mamo et al., Reference Mamo, Gal, Bodo and Dinnyes2007, Reference Mamo, Gal, Polgar and Dinnyes2008; Kumar et al., Reference Kumar, Yadav, Verma, Singh, De and Datta2012; O’Connor et al., Reference O’Connor, Wilmut and Taylor2013; Macabelli et al., Reference Macabelli, Ferreira, Gimenes, de Carvalho, Soares, Ayres, Ferraz, Watanabe, Watanabe, Sangalli, Smith, Baruselli, Meirelles and Chiaratti2014; Wang et al., Reference Wang, Li, Song and Yang2017). Unexpectedly, these tools (geNorm, BestKeeper and NormFinder) found that different reference genes were the most suitable for mouse oocytes because three different mathematical approaches were used in these programs to analyze gene expression levels.
According to the values of reference genes expression stability calculated using three different mathematical approaches (geNorm (Vandesompele et al., Reference Vandesompele, De Preter, Pattyn, Poppe, Van Roy, De Paepe and Speleman2002), BestKeeper (Pfaffl et al., Reference Pfaffl, Tichopad, Prgomet and Neuvians2004) and NormFinder (Andersen et al., Reference Andersen, Jensen and Ørntoft2004)) Gapdh, Rpl4 and H2afz seem to be suitable candidate reference genes for mouse GV oocytes.
The selection of the most appropriate software for gene expression and reference gene stability analysis is widely discussed in the scientific community, and there is no current consensus. Previously, it has been shown that the geNorm analysis is more affected by fluctuations in PCR efficiencies compared with NormFinder analysis (De Spiegelaere et al., Reference De Spiegelaere, Dern-Wieloch, Weigel, Schumacher, Schorle, Nettersheim, Bergmann, Brehm, Kliesch, Vandekerckhove and Fink2015). Another drawback of the geNorm algorithm is the impossibility to conduct target gene analysis (Vandesompele et al., Reference Vandesompele, De Preter, Pattyn, Poppe, Van Roy, De Paepe and Speleman2002). Also it has been shown that the NormFinder algorithm is less robust for small sample sizes compared with geNorm (Neuvians et al., Reference Neuvians, Gashaw, Sauer, von Ostau, Kliesch, Bergmann, Häcker and Grobholz2005). Nevertheless, the important advantage of NormFinder is that it can differentiate intragroup variation from intergroup variation and, therefore, is a suitable tool for reference gene evaluation when different sample groups are used (De Spiegelaere et al., Reference De Spiegelaere, Dern-Wieloch, Weigel, Schumacher, Schorle, Nettersheim, Bergmann, Brehm, Kliesch, Vandekerckhove and Fink2015).
In the current work, three statistical software tools (NormFinder, BestKeeper and geNorm) were applied to find the most stably expressed reference genes for mouse oocytes. These programs use different calculation algorithms and gave different results (Mallona et al., Reference Mallona, Lischewski, Weiss, Hause and Egea-Cortines2010; Mafra et al., Reference Mafra, Kubo, Alves-Ferreira, Ribeiro-Alves, Stuart, Boava, Rodrigues and Machado2012). NormFinder and geNorm use relative quantities calculated from Ct values, while BestKeeper uses Ct values directly (Ali et al., Reference Ali, Du, Li, Yang, Zhang, Wu, Li and Zhang2015). Therefore, the better approach to select the most stable reference genes is to use several software tools with different mathematical algorithms for analysis, and then compare the data obtained by these programs for the selection. This approach was used in the current work.
It is very important to select the appropriate reference genes that will show a stable level of expression in the specific samples. The use of inappropriate reference genes may distort the results of a study. Moreover, it should be taken into account that the use of only one reference gene for analysis can lead to distortion in research findings, as fluctuations in gene expression levels always occur. A possible way to avoid such problems is to calculate a specific index based on information on expression levels of several reference genes for further assessment of target gene expression changes. This method of analysis would minimize the effect of fluctuations in the expression level of each individual gene.
The novel data obtained in the current work will allow adequate analysis of target gene expression levels in mouse oocytes to be performed in further studies. Therefore, new publications dedicated to this subject can be expected in the near future.
Acknowledgements
We thank Filatova Polina for language editing and proofreading.
Financial support
This study was funded by the Russian Science Foundation (project no. 14-50-00029).
Statement of interest
None.
Ethical standards
The authors assert that all procedures contributing to this work comply with the ethical standards of the relevant national and institutional committees on human experimentation and with the Helsinki Declaration of 1975, as revised in 2008. The authors assert that all procedures contributing to this work comply with the ethical standards of the relevant national and institutional guides on the care and use of laboratory animals.