I. INTRODUCTION
Polymer-derived ceramics (PDCs) are ceramic materials produced from the conversion of a polymeric precursor. In the last decades, this class of materials has attracted the attention of the scientific and industrial community due to a combination of outstanding material and processing properties.
PDCs can be produced in a wide range of compositions depending on the precursor used. The most known are Si-based ceramics such as SiCN, SiC, SiOC or more complex quaternary systems like SiOCN or SiBCN. Some of these compositions, e.g., SiOC, are unique because they cannot be produced by any other way but the molecular route. Other systems, such as SiC, are very interesting because it is possible to produce components at much lower processing temperatures (1100–1300 °C) compared to traditional powder-based ceramic technology.
The most noteworthy properties of PDCs are excellent oxidation resistance and good thermo-mechanical properties up to very high temperatures, even 1500 °C or higher, besides special functional properties such as piezoresistivity or luminescence.Reference Colombo, Mera, Riedel and Sorarù1,Reference Colombo, Sorarù, Riedel and Kleebe2
The other evident advantage of using a polymeric precursor is that the material can be shaped using a wide range of polymer-forming technologies, which allows avoiding the general drawbacks and shaping limitations of the traditional ceramic processing. Forming techniques that have been applied to preceramic polymers are extrusion, injection molding, foaming, joining, infiltration, pressing, coating, spinning, and many others.Reference Colombo, Mera, Riedel and Sorarù1 Surprisingly, until now only a very limited amount of research has been reported concerning the application of additive manufacturing (AM) technologies to preceramic polymers.
AM defines a group of different technologies characterized by the fact that an object is built by successive additions of a material (usually layer-upon-layer) to replicate a three-dimensional model data.3
Selective laser curing was applied to mixtures of preceramic polymer, and SiC was used as an inert filler.Reference Friedel, Travitzky, Niebling, Scheffler and Greil4 The feasibility of complex products was proved, even though the final parts were very porous (50 vol%) and were therefore infiltrated with liquid silicon. In a different study, a polycarbosilane resin was dissolved in organic solvents to produce inks for the inkjet printing of silicon carbide components. The resin was printed as a single phase or as a binder for a suspension of silicon carbide particles.Reference Mott and Evans5 A formulation suitable for inkjet printing and based on a preceramic polymer has also been reported in the literature.Reference Scheffler, Bordia, Travitzky and Greil6
Ceramic components have also been produced by hot-pressing lamination and sintering of paper sheets infiltrated with a suspension of preceramic polymer and active/passive fillers (silicon and SiC, respectively).Reference Sieber, Friedrich, Zeschky and Greil7 A preceramic paper was also produced from compositions containing wood pulp fibers, ceramic particles (Al2O3 and SiC in particular), and additives. This material was used to produce complex parts by laminated object manufacturing; in this process, the part is built layer-by-layer, laminating the paper sheets and cutting for each layer the contour of the cross-section of the object by means of a CO2 laser. A polysiloxane polymer may also be used as an adhesive bonding agent for lamination and joining.Reference Travitzky, Windsheimer, Fey and Greil8 Si and SiC filler loaded silane/polysiloxane slurries were also developed for the fabrication of PDC tapes.Reference Cromme, Scheffler and Greil9
The so-called “powder-based three-dimensional printing” is one of the most used AM technologies, and it is based on the concept that the powder in each layer is selectively bonded by means of a printing head according to the corresponding slice of the CAD model.
The process is a layer-by-layer repetition of the following steps, until the height of the sample is reached:
(i) Deposition of a flat layer of powder on the building platform, by means of a roller or a blade.
(ii) The cross-section of the object for the corresponding layer is replicated by selectively binding the particles of the powder bed. Selective binding is achieved by ejecting small droplets of the printing liquid on the powder layer by means of the printing head.
(iii) The printing platform is lowered by one layer thickness.
After completion of the printing process, the unbound powder can be cleaned off using compressed air to obtain the shaped part which, depending on the material, may then undergo a heat treatment.
Various strategies have been developed to use 3D-printing with distinct polymeric,Reference Branham, Tran-Son-Tay, Schoonover, Davis, Allen and Shyy10,Reference Seyednejad, Gawlitta, Kuiper, de Bruin, van Nostrum, Vermonden, Wouter and Hennink11 metallic,Reference Williams, Cochran and Rosen12,Reference Verlee, Dormal and Lecomte-Beckers13 and even ceramic powders.Reference Zocca, Gomes, Bernardo, Müller, Günster and Colombo14,Reference Gildenhaar, Knabe, Gomes, Linow, Houshmand and Berger15
In the case of ceramic powders, the part is first shaped in a green state by three-dimensional printing and finally postsintered in an oven. Local hardening of the powder can be achieved for example by using gypsum and a water-based binder or, in the case of calcium phosphates, an acid–base reaction with phosphoric acid can be used.Reference Gbureck, Hölzel, Klammert, Würzel, Mueller and Barralet16 Especially for the processing of ceramic powders, two main approaches have been followed. The first approach is to mix the powder with a binder that reacts with the solvent and then to glue the particles together.Reference Melcher17 The second is to solubilize a sticky binder directly inside the printing liquid and to use a powder without any additional binder, so that after evaporation of the liquid the remaining sticky component glues the particles.
Despite the great improvements in recent years for both approaches, some major issues still remain. In the former case, the binder mixed with the powder reduces the density of the powder bed and also the contacts between the particles, therefore greatly limiting the green strength and the achievability of a good densification after sintering. Moreover the binder burnout may be problematic and induce stresses that can compromise the mechanical stability of the parts during sintering. The latter case has a further drawback because the addition of a sticky component to the binder makes the cleaning of the printer more complex, especially if the binder dries out in the jets of the printer head.
In the current work, we present the three-dimensional printing of a preceramic polymer powder not containing any inert or active fillers. With this approach, we take advantage of the polymeric nature of the material, so that a solvent can be used to locally dissolve and glue the particles together without the need of additional binders. Manufacturing of complex three-dimensional parts can then be carried out, and the component is subsequently converted to a ceramic upon heat treatment in an inert atmosphere.
The main advantages of our development are therefore two:
(i) A novel, easy way to process preceramic polymers in complex shapes.
(ii) Three-dimensional printing of ceramic parts using a solvent without the need for an additional binder, thus limiting the drawbacks of the standard approaches.
We produced highly porous parts possessing an ordered porosity of circa 80% based on the Kagome lattice, as a proof of the versatility of the technique in printing highly porous parts containing small features and details. Moreover, the main characteristic of this porous lattice is that it is stretch-dominated rather than bending-dominated, based on the Maxwell stability criterion.Reference Maxwell18 These kinds of lattices are theoretically exceptionally stiff and strong for a given mass. Pyramidal and in particular Kagome lattices are very efficient offering the lowest mass-to-stiffness ratio.Reference Ashby19
The main focus of the present work was the optimization of the printing conditions and the 3D-printing of ordered porous parts; the measure of the mechanical properties of the printed porous components and a comparison between the properties of structures possessing different geometries will be the subject of future investigations.
II. EXPERIMENTAL
A commercial powder of a polymethylsilsesquioxane (PMS) preceramic polymer was used (Silres MK polymer, Wacker Chemie, Burghausen, Germany). This polymer was chosen because it is cheap, easily available, and provided as a fine powder. The MK polymer has a softening temperature of 45–60 °C, but it can be cross-linked by catalyzed polycondensation of hydroxyl and ethoxyl groups (which are present approximately in a 2 mol%).Reference Harsche, Balan and Riedel20
Two different approaches were followed in order to introduce the cross-linking catalyst into the powder. In the first case, the MK powder was dissolved in isopropanol (ApplChem, Darmstadt, Germany) together with the catalyst zirconium acetylacetonate (ZrAcAc) (Sigma Aldrich, Hannover, Germany) while stirring. The ratio used was ZrAcAc/MK = 1 wt%.
The solution was dried under vacuum at moderate temperature, and the clear solid obtained was ball milled and sieved in the range of 45–90 µm. This powder was 3D-printed using isopropanol as the printing liquid.
In the second approach, tin-octoate (TinOc) (Sigma Aldrich, Hannover, Germany), which is a liquid, was mixed directly with the printing liquid. This strategy allowed us to introduce the catalyst directly during the printing job, avoiding the time consuming procedure of dissolving the polymer and the catalyst together, evaporating the solvent and then milling the mixture to obtain again a powder.
The TinOc could not be added to isopropanol because it shows a specific reactivity toward the isopropanol forming an insoluble precipitate. A different solvent was therefore chosen, that is a mixture of 1-hexanol and hexylacetate (Voxeljet, Augsburg, Germany) (the mixture will be called “hexanol mixture” from here on), to which the liquid catalyst was added. After preliminary printing tests, a ratio of catalyst/(catalyst + solvent) = 7.6 wt% was chosen. This mixture enabled the introduction into the printed powder of 0.9–1 wt% of catalyst. In this case, the as-received PMS powder was sieved in order to remove the smaller and the bigger fractions, to respectively improve the flowability and make it fit for the layer-by-layer deposition. The main properties of the resulting powder are presented in Table I.
Particle size distribution, bulk density, and Hausner ratio of the PMS powder after sieving.

a HR < 1.11: excellent flow; 1.12–1.18: good flow; 1.19–1.25: fair flow; 1.26–1.34: passable flow; 1.35–1.45: poor flow; 1.46–1.59: very poor flow; >1.60: no flow.
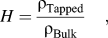
The flowability of the powder was evaluated by the Hausner ratio (H), measured according to Eq. (1) (Ref. Reference Hausner21):
 $$H = {{{\rm{\rho }}_{{\rm{Tapped}}} } \over {{\rm{\rho }}_{{\rm{Bulk}}} }}\quad,$$
where ρBulk is the freely settled bulk density of the powder, and ρTapped is the density of the tapped powder after a certain number of standardized tapping cycles.
The printer used was a Voxeljet Teststand VTS 16 (Voxeljet Technology Gmbh, Friedberg, Germany) mounting a printing head with 128 jets (Spectra SL128-AA, Dimatix Fujifilm USA, Santa Clara, CA) and using a blade recoating system.
The main parameter investigated was the ratio (R) between the mass of solvent and the mass of powder in a printed part. Since a printed object can be considered to be a repetition of a single voxel (the three-dimensional equivalent of a pixel) and that the printing head spits one drop of solvent for each voxel, R is then equivalent to the mass of a single drop divided by the mass of powder in one voxel, according to Eq. (2):
 $$R = {{{\rm{drop \,\,mass}}} \over {{\rm{d}}x \times {\rm{d}}y \times {\rm{d}}z\,\,({\rm{\rho }}_{{\rm{Bulk}}} )}}\quad,$$
where dx × dy is the lateral pixel area on the substrate where one droplet is spit and dz is the layer thickness; the value dx × dy × dz is therefore the volume of one voxel.
To ensure a precise control of the concentration of the catalyst and solvent in the printed samples, the drop mass was measured prior to each printing job by measuring the mass of 30,000 drops spit for each of the 128 jets and dividing the obtained value by the total amount of drops (30,000 × 128); the measurement was repeated three times and averaged (0.01 g resolution). When necessary, the value of R was adjusted by modifying the value of dx (µm), which is related to the printing head velocity [v (µm/s)] and to the spitting frequency [f (Hz)] by Eq. (3):
 $${\rm{d}}x = {v \over f}\quad.$$
The value of dy was fixed to 83 µm, determined by the geometrical configuration of the printer, while dz (layer thickness) was chosen as 100 µm, in a series of preliminary experiments conducted in order to optimize the spreading of the layers.
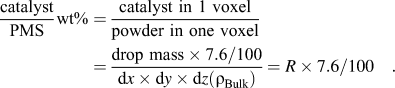
The mass ratio between catalyst and PMS powder in a printed part can be calculated from the following Eq. (4):
 $${{{\rm{catalyst}}} \over {{\rm{PMS}}}}{\rm{wt\% }} = {{{\rm{catalyst \,\,in\,\,1\,\,voxel}}} \over {{\rm{powder \,\,in\,\,one\,\,voxel}}}} = {{{\rm{drop\,\,mass}} \times {\rm{7}}{\rm{.6/100}}} \over {{\rm{d}}x \times {\rm{d}}y \times {\rm{d}}z({\rm{\rho }}_{{\rm{Bulk}}} )}} = R \times 7.6/100\quad.$$
The printed parts were left immersed in the support powder bed overnight to evaporate the excess solvent, and were finally cleaned by means of a brush and a compressed air gun.
The green parts were cross-linked by slowly (30 °C/h) heating them up to 100 °C or 150 °C (100 °C where not differently stated) in a muffle furnace in air, and were then ceramized by heating at 1000 or 1200 °C in nitrogen atmosphere with a heating ramp of 1 °C/min and a dwell time of 1 h at the maximum temperature.
The skeleton density was measured with a helium pycnometer (Accupyc 1330, Micrometric Instrument Corporation, Norcross, GA), while the bulk density and porosity of the printed parts were obtained by Archimede’s method measuring the dry, saturated, and suspended mass in water. For the characterization of samples printed with isopropanol, four tablets of 16 mm diameter and 3 mm thickness (green dimensions) were produced. The samples printed with the hexanol mixture were instead eight cubes of 12 × 12 × 12 mm3. Each sample was measured three times, before and after pyrolysis. All the measured values are presented as mean ± standard deviation.
The Kagome lattices were drawn with a commercial CAD software (Solid Edge ST3, Siemens PLM Software, Köln, Germany). Ten prismatic samples of base 4 × 10 mm2 and height 10 mm (geometry according to ISO 604 for polymeric materials) were printed and tested under compression (Z005, Zwick/Roell, Ulf, Germany; cross-head speed of 0.5 mm/min) to evaluate the compressive strength of the green parts. The same procedure was repeated for 10 samples after cross-linking at 150 °C.
The ceramized material was investigated by means of XRD (x-ray diffractometer, PW 1710-Basis, Panalytical GmbH, Kassel, Germany). One of the produced Kagome structures was scanned by micro-CT and analyzed both in the green and in the ceramic state. Measurements were performed on the BAM 225 kV-microCT-device. This device was assembled out of single parts. It features a micro-focus x-ray tube with 225 kV acceleration voltage and a focal spot size of approximately 7 µm (X-RAY WorX GmbH, Garbsen, Germany). The detector was a flat-panel with 2048 × 2048 pixels at a pitch of 0.2 mm (PerkinElmer Inc., Waltham, MA).
The morphology of the printed parts was investigated using an optical microscope (VHX-100 digital microscope, Keyence Corporation, Osaka, Japan) and a scanning electron microscope [SEM; JEOL JSM-6490, Jeol Italia, Pieve Emanuele (MI), Italy].
III. RESULTS AND DISCUSSION
A. Influence of the printing parameters
The concentration of the printing liquid spit in a layer is the most important parameter to consider, and it can be evaluated by the parameter R introduced in Eq. (2).
A preliminary test allowed the definition of a maximum value of R, above which a layer does not remain flat and therefore a new layer cannot be deposited. When a higher amount of the material is introduced, it tends to warp due to stresses introduced by the gradient in solvent concentration, which is mainly generated, because the evaporation rate is higher from the top of the layer than from the bottom. This limit value for the hexanol mixture used as the printing liquid was determined to be R = 15.2% in a series of preliminary experiments.
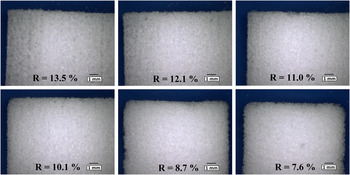
The influence of R on the morphology of three-dimensional samples was afterward studied in a wide range between 7.6 and 13.5%, as shown in Fig. 1.
Optical microscope micrographs showing the morphology of square-section samples printed using different R values (R = solvent/powder mass ratio; solvent: hexanol mixture). Solvent concentration increases from bottom to top and from right to left: (a) R = 13.5%, (b) R = 12.1%, (c) R = 11.0%, (d) R = 10.1%, (e) R = 8.7%, and (f) R = 7.6%.

It can be noted how the squares printed with R = 7.6% and R = 8.7% have round corners and were damaged during cleaning, so it was impossible to use these parameters to produce geometrically precise components. In contrast, a value of R = 13.5% generated sharp corners and sharp sides, but some shape distortion was present due to the high amount of solvent. This value may however be considered suitable for printing very fine structures, where it is desired to maximize the mechanical strength of the produced part. Values of R = 11.0% and R = 12.1% can be considered to be optimal, as they enabled producing samples possessing sharp corners and well-defined sides. A slightly lower value R = 10.1% might lead to sharp sides but smoothed corners after cleaning, so it could be considered optimal for printing large parts, where it is preferred to save some solvent and prevent macroscopic distortions.
As discussed before, when the catalyst is mixed with the printing liquid, its concentration is related to R by Eq. (4). A value of R = 12.1% (used for the printed 3D-parts) corresponds to a catalyst concentration of 0.92 wt%, while R = 13.5% corresponds to 1.0 wt%.
Similar studies were performed with isopropanol used as a printing liquid, but in this case, distortion of the parts occurs at lower R values. A value of R = 6.0% was used to print the samples described in Sec. III. B.
B. Optimization of printing and ceramization conditions
To investigate the effect of different printing parameters and to optimize them, bulk samples with simple geometry (tablets, T-samples, or cubes, C-samples) were firstly produced. The compressive strength of as-printed prism samples was 3 ± 1 MPa, which allowed cleaning and handling the parts easily. The rather high strength of the green samples can be attributed to the printing of a preceramic polymer, without the need for an additional binder.
Completion of the cross-linking process at 150 °C led to an increased compressive strength of 20 ± 2 MPa and a brittle behavior, typical of thermo-setting resins.
The main processing parameters and the density and porosity of the green samples are reported in Table II, while characterization data for the ceramized samples are summarized in Table III.
Printing conditions, green density, and green porosity of the different printed samples.

Ceramization mass loss, ceramization shrinkage, ceramic density, and porosity of the ceramized samples.

The mass loss during the polymer to ceramic transformation is reduced by the addition of a catalystReference Harsche, Balan and Riedel20 and it was approximately 16 wt% for all samples (at 1200 °C, measured by weighing the samples before and after pyrolysis; the same samples used for density measurements were used), indicating that the use of different catalysts or of different methods to introduce them (in the powder or in the printing liquid) did not have a relevant effect on this parameter.
The mass loss of the MK polymer reported in literature after pyrolysis at 1100 °C in an inert atmosphere is approximately 23 wt% without catalyst and approximately 14 wt% with 1 wt% ZrAcAc.Reference Harsche, Balan and Riedel20,Reference Ionescu, Linck, Fasel, Müller, Kleebe and Riedel22,Reference Akkaş and Öveçoğlu23 As expected, the addition of a catalyst reduces the mass loss, both in the cited works and in our study, even though a slightly higher value was found in our study, possibly related to the different processing of the material.
Akkaş et al.Reference Akkaş and Öveçoğlu23 found a mass loss of 15 wt% at 1100 °C for samples containing 1.5 wt% ZrAcAc as catalyst, compared to other works where 1 wt% ZrAcAc lead to lower or comparable mass loss.Reference Harsche, Balan and Riedel20 It seems plausible that the mass loss is not much influenced if the catalyst amount or its efficiency is increased above a certain critical value.
The density of the parts printed with the hexanol mixture was quite high (approximately 80%) and considering a low density of the powder bed (45%, taking into account a density of 1.2 g/cm3 for the dense polymer), this indicates that a considerable densification occurred due to the surface dissolution of the polymeric particles.
The parts printed with isopropanol (TZ1200) had a much lower green density (49%), which was due to both a lower concentration of the solvent in the part and to its much higher vapor pressure (4.3 kPa for isopropanol and 0.12 kPa for the hexanol mixture, at 20 °C).
Wu and CimaReference Wu and Cima24 described the solvent–particle interaction during three-dimensional printing, correlating the microstructure formation with the timescales for dissolution and evaporation.
In our case, the use of a solvent with high vapor pressure implies a short evaporation time and a much limited timescale for dissolution, creating a highly porous printed part.
During heat treatment in an inert atmosphere, the preceramic first cross-links, with a loss of water, ethanol, and methanol caused by polycondensation, then at temperatures between 400 and 800 °C, the polymer to ceramic transformation completes with further release of hydrogen and methane. The final result of the ceramization process of a polysiloxane polymer in inert atmosphere is a black amorphous material of general composition SixOyCz.Reference Colombo, Mera, Riedel and Sorarù1,Reference Harsche, Balan and Riedel20
All the samples heat treated at 1000–1200 °C in N2 atmosphere were black, and the amorphous nature was confirmed by XRD analysis, not reported here for the sake of brevity.
The porosity in the ceramized parts was lower for samples TZ1200 (ZrAcAc added as catalyst) than for samples CT1200 (TinOc as catalyst). In the latter case, the negligible reduction of porosity from the green bodies to the ceramic bodies indicates that viscous flow during pyrolysis was almost negligible, both in the polymeric stage (because of the action of the catalyst) and in the ceramic stage (because the glass transition temperature of amorphous SiOC is >1400 °C). In the case of samples TZ1200, instead, the higher densification (approximately 87% relative density) could be explained with a lower crosslinking efficiency of the ZrAcAc at low temperature, resulting in some degree of viscous flow during heating from the polymeric state.
It should be also considered that our process involves a different cross-linking approach compared to other studies where the samples are prepared by warm pressing at 150–200 °C. In our approach, we proved that the cross-linking can be initiated even at room temperature, avoiding the softening of the polymer when T g is reached (approximately 50 °C).
The ceramization of samples TZ1200 occurred with a very large axial linear shrinkage of 32%. Despite the large value, no evident shape distortion was observed, at least for these parts with a simple geometry. The measured shrinkage in z (thickness) direction was 38%, which is higher than the shrinkage in x–y direction. This higher value may be due to a gravitational effect causing an anisotropic viscous flow during heating in the polymeric stage. This observation agrees with the negligible densification occurring in the samples printed with TinOc as catalyst. In these samples, in fact, an isotropic shrinkage was measured, which is compatible with the hypothesis of a negligible viscous flow and opposite to what observed in the samples containing ZrAcAc.
A comparison between samples heated at 1000 °C (CT1000) and 1200 °C (CT1200), see Table III, shows an increase in density from 1.67 to 1.84 g/cm3 and increase in shrinkage from 19 to 22% with increasing temperature.
The difference in linear shrinkage between samples TZ1200 and CT1200 (32% and 22%, respectively) can be related to the much lower green density of the TZ1200 samples compared to the CT1200 samples (0.59 and 0.96 g/cm3, respectively).
Shrinkage was isotropic in all the samples, and this factor contributes to the possibility of producing undistorted parts.
The residual porosity present in the samples was due to limited viscous flow of the preceramic particles during pyrolysis. This characteristic depends on a complex interplay between various factors, such as the heating rate, the amount and type of catalyst introduced, the molecular weight distribution of the preceramic polymer (which can change with the time of storage), and the particle packing after printing. In any case, the open porosity in the green samples, which was partially retained in the ceramized parts after heating to high temperature, allowed the release of decomposition gases with no obvious cracking or distortion even for thick components (up to 5 mm), instead this being usually a major issue in the conversion of dense preceramic polymer bodies that do not contain any active or inert fillers. Severe cracking was observed only in a cube sample with a thickness larger than 10 mm.
Both strategies to introduce the catalyst in the polymer were successful for the printing and ceramization steps. A few samples were printed and converted using the strategy of mixing the catalyst ZrAcAc in the preceramic powder. Despite the promising results, for printing of larger three-dimensional structures, the preparation of the powder was inconveniently time consuming, so that only the route with the catalyst in the printing liquid was followed.
C. Printing of ordered porous structures
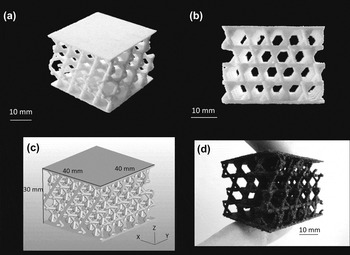
In Fig. 2 are reported images of the Kagome lattice, comparing the three-dimensional STL-object and the printed part (before and after ceramization). The complete CAD structure [Fig. 2(c)] had dimensions 40 × 40 × 30 mm, a porosity of 79.9% including top and bottom plates and a strut thickness of 1.5 mm. Figure 2 shows that the porous Kagome could be successfully printed, preserving the features of the fine structure both in the polymeric [Figs. 2(a) and 2(b)] and in the ceramic state [Fig. 2(d), after ceramization at 1200 °C].
(a) lateral view of the polymeric printed Kagome structure, (b) front view of the polymeric printed Kagome structure, (c) CAD-model of the Kagome structure, and (d) SiOC ceramic structure ceramized at 1200 °C.

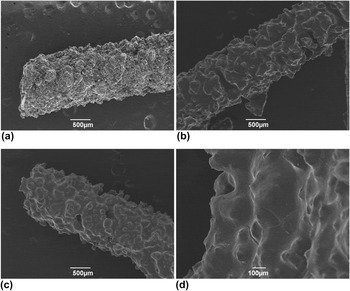
Single struts from the structure were investigated by means of SEM analysis at the different stages of the process (after printing, after cross-linking, after ceramization), and the relative micrographs are presented in Fig. 3.
SEM micrographs of the struts of the Kagome structure: (a) polymeric (as printed), (b) polymeric (after cross-linking at 150 °C), (c) ceramized at 1200 °C, and (d) details of a ceramized strut, showing the presence of some cracks.

The struts just after printing [Fig. 3(a)] are very rough because the surface is covered with particles, coming from the powder bed, that adhere either electrostatically or because they are only partially dissolved. After cross-linking [Fig. 3(b)], the strut appears much smoother because during heating to the cross-linking temperature melting of the preceramic polymer particles occurs. When the catalyst is introduced through the printing solvent, the particles that are not directly beneath the printed area do not contain any catalyst, so they simply melt during heating.
The surface of the struts is still very irregular, and this can be attributed to the limited resolution of the printer in replicating thin structures (1.5 mm diameter). Strategies to optimize the shape and the surface of the struts, for instance by tailoring the rheological properties of the preceramic polymer through the amount and type of the catalyst added, are currently under evaluation.
After ceramization [Fig. 3(c)] the morphology is basically unchanged in comparison with the cross-linked structure. In this case, however, the formation of some surface cracks with a length of few hundreds of micrometers could be noted [Fig. 3(d)]. These cracks were not present in the cross-linked structures, and therefore they developed during the ceramization process because the release of gases and the high shrinkage are associated with the polymer-to-ceramic transformation.Reference Colombo, Mera, Riedel and Sorarù1
This issue could be partially or completely solved by mixing the preceramic polymer with an active or passive filler, in order to reduce the shrinkage and facilitate the gas release. There could also be the possibility of producing the same SiOC composition by printing a mixture of the MK polymer and the SiOC powder (obtained by previously pyrolizing part of the MK powder). Also, a more elaborate heat treatment, with slower heating rates in the critical temperature interval (polymer-to-ceramic transition), might enable the fabrication of crack-free components.
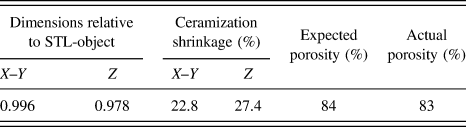
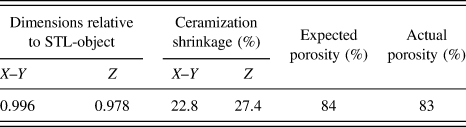
To evaluate the precision of the geometrical replication of the CAD file by printing of the preceramic polymer, a sample of the Kagome structure was scanned by micro-CT after printing and after ceramization, and the corresponding three-dimensional model was reconstructed. All data obtained from the micro-CT scans are collected in Table IV. The acceleration voltage during measurement was 80 keV, no prefilter was used. The volume was reconstructed using the standard FDK filtered back-projection algorithm with a resulting voxel size of 31 µm.
Dimensions relative to the STL-object, ceramization shrinkage, expected porosity (STL-object), and actual porosity of a printed Kagome structure. Data are obtained from micro-CT scan, and analysis of the model of the part before and after pyrolisis.
For comparison of the original STL file obtained from CAD drawings with the reconstructed CT volume, the data were analyzed with VGStudio Max 2.1 (VolumeGraphics GmbH, Heidelberg, Germany). The object surface was determined as the Iso50-surface between air and the lowest material peak in the gray-value histogram. Then a scale correction was applied to fit the dimensions of the CT-model to the exact dimensions of the STL-object.
From the determined scale factors, it could be evinced that the printed part was smaller by a factor 0.996 in the x–y and 0.978 in the z direction (height). Since the x (or y) dimension of the STL part is 40 mm, a factor of 0.996 corresponds to an actual size of 39.8 mm, which means that the difference is within the minimum resolution range of the printer. The typical dimension of a printed pixel in the x–y direction is 0.1 × 0.1 mm, so a difference of 0.2 mm corresponds to only two pixels.
The scale factor along z was instead equal to 0.978 for a dimension of 30 mm, which corresponds to an actual dimension of 29.3 mm. This 0.7 mm difference could be explained by some little distortion due to gravity, because the part was cleaned when the solvent had not yet completely evaporated.
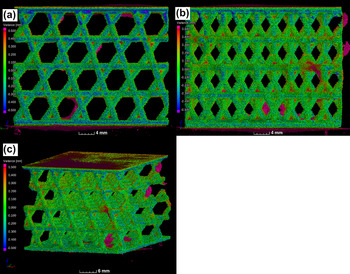
After scale correction, the CT-model was registered on the STL-object to calculate the deviation of the CT-model surface to the STL-object surface. The result is shown in Fig. 4, where the deviation varies from −0.5 mm (blue color) to +0.5 mm (red color), and the points with an absolute deviation lower than 0.1 mm are in green. Note that the color scale should be interpreted using the same scale corrections used for the dimensional comparison, but for qualitative considerations, this is not relevant.
Screen shots of the three comparisons between the CT-scanned “as printed” part (before cross-linking and ceramization) and the STL-object used as the printing model. Colors represent the point-by-point variance between the two volumes, ranging from −0.5 mm variance (blue) to +0.5 mm (red). (a) Front view, (b) bottom view, and (c) lateral view.

Most part of the surface of the structure is colored green, which means that it was printed with a precision close to the resolution of the printer (concerning the voxel size).
The dimensions of a printed voxel, which is defined as the volume where a single drop of the solvent is spit, are of the order of 100 µm for each side, the value that can be considered as the theoretical resolution of the process. Our CT-analysis demonstrated that most part of the structure has a deviation <100–200 µm from the original CAD file, so the printing can be as precise as the dimension of 1–2 voxel.
It should however be noted that the minimum strut diameter was higher because the strut must be strong enough to withstand the cleaning procedure without breaking. At this stage of the investigation, the minimum strut size that was possible to print is about 1 mm.
Blue deviations appear in particular along the x-direction of the structure, meaning that some material is missing compared to the STL-object, or that the object is slightly distorted. This is most likely due to a too aggressive cleaning of the part that also removed some material from the struts. There are also some areas colored red (excess material) inside the structure close to the top and bottom plates, meaning that the non-printed powder was not perfectly cleaned. Some areas colored red can be also noted inside the octahedral cells because the cells were too small to completely remove the loose powder trapped inside. Finally, two partially broken struts can be noted on the top right side of Fig. 4(c), protruding out of the structure. These are a result of the cleaning procedure.
The total porosity of the CT-model was also calculated using VGStudio Max 2.1. The volume occupied by the printed material in the Kagome lattice was calculated after surface determination following the same procedure previously described. The total volume occupied by the structure was determined as the volume of the smallest prism that completely encloses the object (including top and bottom plates). A value of 83 vol% of total porosity was obtained for the complete part. This value cannot be directly compared to the total porosity of the STL-object (approximately 80 vol%) because the porosity in the struts should be also considered.
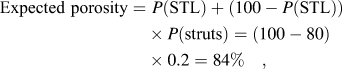
A reasonably approximate value can then be calculated supposing that the green struts have the same porosity of the bulk green parts, which is 20% (see Table II).
The “expected theoretical” total porosity can then be estimated according to Eq. (5):
 $${\rm{Expected \,\,porosity}} = \,\,P({\rm{STL)}} + (100 - P({\rm{STL}})) \times P({\rm{struts)}} = \left( {100 - 80} \right) \times 0.2 = 84\%\quad ,$$
where P(STL) is the percent porosity of the STL-object and P(struts) the porosity of the green struts. The value obtained is very close to the one measured for the printed part, so we can conclude that the total porosity of the model could be very precisely replicated by the printing procedure.
Micro-CT was also used to scan the Kagome structure after ceramization, using the data to measure precisely the shrinkage. The analysis steps applied to the CT-data were the same as described before. The CT measurement parameters were identical to those for the object “as printed,” apart from the voxel size of the reconstructed data, which was 24 µm.
The shrinkage measured in the x–y direction was 22.8%, very similar to the value obtained for the bulk parts (see Table III). The shrinkage measured in the z direction was instead higher, 27.4%. This is most probably due to the effect of gravity during cross-linking, in a range of temperatures between 50 and 100 °C when the structure is not cross-linked enough to be completely stabilized.
It was noted that some of the complex printed parts that contained some defects (such as damaged struts) on one side tended to bend on that side during heat treatment. The problem was solved by decreasing the cross-linking heating rate from 30 to 1.5 °C/h (up to 100 °C). This proves that the catalyst is active enough to sufficiently stabilize the structure even at low temperatures; the precise role of the amount of catalyst and of the heating rate on the strut density and shape retention of the Kagome structure will be the subject of further investigations. In future works, we will also extend this approach to include powders based on a mixture of a preceramic polymer with ceramic or metallic powder fillers, in order to greatly extend the range of compositions and properties achievable.Reference Colombo, Bernardo and Parcianello25
IV. CONCLUSIONS
Powder-based 3D-printing of a preceramic polymer has been for the first time here reported. Two different printing liquids were used, depending on the strategy adopted for introducing the cross-linking catalyst (mixing with the preceramic polymer or with the printing liquid solvent). Both routes proved successful, but adding the catalyst directly to the printing liquid is the most convenient way of applying 3D-printing to a preceramic polymer powder because it greatly simplifies the process.
Furthermore, it is important to densify the structure during printing because a significant viscous flow prior to the thermally activated cross-linking would distort the parts. This limits the possibility of achieving a further densification by viscous flow during the heat treatment. To improve the densification during printing, the use of hexanol mixture as printing liquid is to be preferred to isopropanol. In addition, the use of tin-octoate as a catalyst was proved to be suitable to stabilize the parts even at low temperatures, when added to the powder with a concentration of 1 wt%.
Residual porosity in the printed parts was present after cross-linking and ceramization, due to the limited viscous flow of the polymer during heating, controlled by the processing parameters.
Complex ceramic parts possessing an ordered, designed porosity according to the corresponding three-dimensional model were successfully produced. Micro-CT analysis of the printed components demonstrated that the local features, overall structure, and total porosity could be very well replicated with respect to the starting CAD model because of the precision of the printing procedure and the optimization of the processing conditions.
Thanks to the versatility of the proposed development, new possibilities could be pursued to directly produce complex ceramic components by 3D printing of preceramic polymers, or to use a preceramic polymer as a non-sacrificial (reactive) binder for the printing of different ceramic powders.