Introduction
The genetic structure of a population is largely determined by its degree of endogamy, with isolation by distance being one of the most widely studied factors (Lasker, Reference Lasker1985; Jorde & Morgan, Reference Jorde and Morgan1987). The effect of geographic distance from neighbouring populations on genetic kinship is intensified by the existence of geographical environmental boundaries such as mountains or rivers, as well as cultural barriers including linguistic, ethnic or religious differences (Smith et al., Reference Smith, Smith and Williams1984; Koertvelyessy et al., Reference Koertvelyessy, Crawford, Huntsman, Collins, Keeping and Uttley1988; Zei et al., Reference Zei, Barbujani, Lisa, Fiorani, Menozzi, Siri and Cavalli-Sforza1993; Vienna & Biondi, Reference Vienna and Biondi2001; Tasso et al., Reference Tasso, Lucchetti, Pizzetti, Vidovic and Caravello2005; Biondi et al., Reference Biondi, Vienna, Peña García and Mascie-Taylor2005; Tagarelli et al., Reference Tagarelli, Fiorini, Piro, Luiselli, Tagarelli and Pettener2007).
Less attention has been given to political barriers such as national borders. Using molecular markers, genetic differences in Europe have been related to nationality (Novembre et al., Reference Novembre, Johnson, Bryc, Kutalik, Boyko and Auton2008), thus confirming what had been previously observed at the regional level (Bolsen & Lasker, Reference Boldsen and Lasker1996; Scapoli et al., Reference Scapoli, Mamolini, Carrieri, Rodriguez-Larralde and Barrai2007) and at the level of the Iberian Peninsula (Pallarés, Reference Pallarés1990; Abade, Reference Abade1992; Eizaguirre, Reference Eizaguirre1994; Macbeth et al., Reference Macbeth, Salvat, Vigo and Bertranpetit1996; González-Martín & Toja, Reference González-Martín and Toja2002). Whatever the other environmental variables, studying the degree to which the political barriers limit the movement of individuals and of genes may contribute to explaining the genetic differentiation observed among geographically close populations.
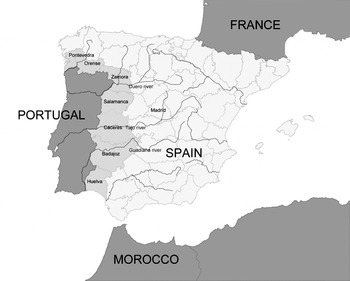
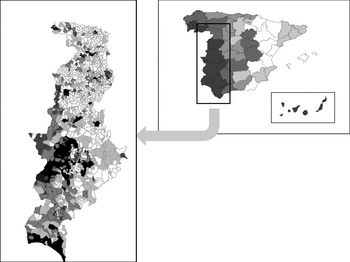
The border between Spain and Portugal is one of the longest and oldest existing in Europe, and one that has experienced the fewest alterations over time (Kavanagh, Reference Kavanagh1997; Medina García, Reference Medina García2006). Along most of its length it is an open border with an absence of major geographic obstacles, with the exception of the northern area (Gaspar, Reference Gaspar1985), corresponding to the Spanish province of Zamora (Fig. 1). This border runs from the Spanish region of Galicia in the north to Andalusia in the south, and crosses the three most important hydrographic basins on the western Iberian Peninsula, namely the Duero, Tagus and Guadiana Rivers, which are separated by the Sistema Central and Sierra Morena mountain ranges (Fig. 1).
Present border between Spain and Portugal. The Spanish provinces considered in this paper and the three main hydrographic basins are shown.

Regarding the process of formation of this border, it should be recalled that following the invasion of the Iberian Peninsula by the Muslims (in the 8th century) the Christian re-conquest advanced from north to south over a period of many centuries. For this reason very similar languages are spoken in Portugal and Galicia, and surnames are often the same. Historically the frontier goes back to the Treaty of Alcañices in 1297, when the County of Portugal gained independence from the kingdom of Castile. Since then, the frontier has remained largely unchanged. As a consequence, two different national and cultural realities arose on each side of the border, which for long periods of time remained semi-depopulated for security reasons (Medina García, Reference Medina García2006).
Migration across the border, although limited due to administrative difficulties (Medina García, Reference Medina García2006), always existed mainly from Portugal to Spain (Gaspar, Reference Gaspar1985). Data on marriages confirms the permeability of this frontier (Abade, Reference Abade1992; Fuster, et al., Reference Fuster, Román, Guardado, Zuluaga, Blanco, Colantonio, Bodzsár and Zsákai2007; Román-Busto et al., Reference Román-Busto, Fuster, Colantonio, Zuluaga, Blanco and Guardado-Moreira2010). Today, the long-term flux of people and genes can be seen in the significant presence of surnames of Portuguese origin in Spanish regions close to the border (Román-Busto et al., Reference Román, Fuster, Zuluaga, Colantonio, Blanco and Guardado2008).
The study of the frequency and distribution patterns of Portuguese surnames allows their route of entry into Spain to be tracked by means of spatial autocorrelation analysis. The resulting gene flux may also have been conditioned by other factors such as roads (Caravello & Tasso, Reference Caravello and Tasso2007) or remote migrations. This is the case of an important north/south itinerary in western Spain that runs parallel to the border at a distance of 50–100 km, known as the ‘Vía de la Plata’, or Silver Route, and which has been active since the time of the Roman Empire. Close to this itinerary there are other traditional paths used for seasonal cattle migration (Mangas Navas, Reference Mangas Navas1992) from the northern (León and Zamora) to the southern provinces (Badajoz and Cáceres), which also contributed to the marital exchange among the municipalities they crossed (Gómez, Reference Gómez2001).
The objective of the present paper is to study the frequency and distribution of Portuguese surnames in the western Spanish regions close to the border with Portugal, as well as their pattern of dispersion, considering separately contemporary samples of Portuguese and Spanish surnames. In order to provide a characterization of the genetic structure, the analysis is conducted at two territorial levels: the first, parallel to the border following a north/south direction; and the second analysing separately the five Spanish provinces adjoining the frontier.
Methods
A database of surnames corresponding to the 2006 list of inhabitants was provided by the Spanish National Institute of Statistics (INE). From this database, in addition to surnames, the age, place of birth and residence in the seven provinces bordering with Portugal were used for the study.
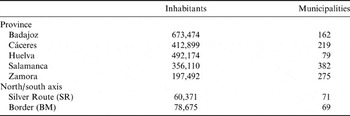
The two Galician provinces (Pontevedra and Orense) were discarded due to their cultural and linguistic proximity to Portugal (as already indicated, this country originated after the spread of Galician peoples towards the south in medieval times). Therefore five provinces were retained: Zamora, Salamanca, Badajoz, Cáceres and Huelva. Only municipalities with fewer than 10,000 inhabitants were studied (Table 1).
Number of inhabitants and municipalities studied (<10,000 inhabitants) by province and north/south migratory axis

Individuals born outside Spain and those born of immigrants and younger than 15 years of age were also discarded due to the fact that the first process of regularization (granting of Spanish nationality after a brief period of residence) in 1991 considerably increased the number of nationalized immigrants (López, Reference López2006). The consideration of their surnames would have distorted the study of past migrations by introducing an important bias in the analysis. The resulting final database consisted of 1,749,684 individuals.
In order to obtain a sample of surnames with proven origin in Portugal and in the Spanish provinces – and which are also present throughout the whole of the territory studied – 60 Spanish surnames (twelve per province) were selected and classified into three categories according to their respective frequencies: four very frequent (>1500), four intermediate (900–1500) and four with low frequency (<900). In addition, 20 Portuguese surnames were also selected. The origin of each surname was verified by means of several dictionaries of surnames (Platero, Reference Platero1992; Faure, et al., Reference Faure, Ribes and Garcia2001; Sousa, Reference Sousa2001).
The distribution of surnames was analysed on three levels: (a) considering a north/south axis (BM), which included the 69 Spanish municipalities next to the Portuguese border. The cities of Badajoz and Ayamonte (Huelva) were discarded due to their large census size; (b) a second north/south axis, parallel to the first, included 78 municipalities located along the Silver Route (SR); (c) a west/east axis, from the Portuguese border eastwards, which comprised the municipalities belonging to the five provinces studied (Fig. 1).
In order to establish kinship relationships among municipalities, genetic distance matrices were calculated following Lasker (Reference Lasker1977, Reference Lasker1985) using the total surnames in each locality of the two defined axes. The resulting matrices were represented by means of multidimensional scaling graphs (Davidson, Reference Davidson1983), considering the absolute frequency of surnames in every locality. For the same axes, the geographic altitude and census size of municipalities were correlated (Pearson) with the relative frequency of Portuguese surnames.
The application of spatial autocorrelation analysis to quantitative data summarizes the genetic similarity between populations as a function of the geographical distance separating them. This analysis highlights the similarity in the values of a variable: in the present case, the frequency of a surname, considering pairs of municipalities within arbitrary classes of distance (0–48; 49–95; 96–193; 154–241; 242–346; 347–525 km). Because distances as the crow flies are considered reasonably representative of spatial distances for population genetic studies (Barbujani, Reference Barbujani1987), kilometric limits of distance as the crow flies were chosen to make the number of comparisons within them as uniform as possible. The distance classes were established according to the latitude and the longitude of each municipality. The graphic representation of the coefficients of autocorrelation with respect to distance classes is a correlogram (Barbujani & Sokal, Reference Barbujani and Sokal1991; Barbujani, Reference Barbujani2000), for which overall significance is assessed through a Bonferroni test (Oden, Reference Oden1984). The procedure for this method was developed by Moran (Reference Moran1950), and later by Cliff & Ord (Reference Cliff and Ord1973), who provided a monograph on the subject. The method was subsequently refined by Ripley (Reference Ripley1981) and Cliff & Ord (Reference Cliff and Ord1981). The first application to biological studies was made by Sokal & Oden (Reference Sokal and Oden1978 a, Reference Sokal and Odenb).
The coefficient of autocorrelation (Moran's I) is calculated as:

where pi and pj are the frequency of surnames in the ith and jth municipality, p is the mean over the n municipalities, wij is equal to 1 for all the pairs of municipalities belonging to the studied distance class, and is equal to 0 for all other pairs; W is the sum of all wij values in that distance class. According to Caravello & Tasso (Reference Caravello and Tasso1999, Reference Caravello and Tasso2007) and Tasso & Caravello (Reference Tasso and Caravello2010), in the analyses of surname distributions, the I coefficient generally varies between −1 (negative autocorrelation) and +1 (positive autocorrelation). In the absence of spatial autocorrelation, the expected value is −1/(n−1), where n is the size of the sample (Sokal & Oden, Reference Sokal and Oden1978a). A significant negative autocorrelation implies that the frequencies of a variable (in the present study a surname) in a determined distance are dissimilar. Contrarily, a significant positive autocorrelation implies that at a certain distance surname frequencies are similar. A non-significant value means no relationship between pairs of frequencies of a surname at a certain distance (Sokal & Oden, Reference Sokal and Oden1978a).
Seven patterns of isolation by distance were considered following Sokal & Oden, (Reference Sokal and Oden1978a, Reference Sokal and Odenb): C (Cline), D (Depression), DD (Double Depression), DF (Different), I (Intrusion), IBD+D (Isolation by Distance and Depression) and LDD (Long-Distance Differentiation). To interpret the results, a monotonically decreasing trend from positive to negative values of autocorrelation as distance increases is defined as a cline: it suggests the existence of a gradient of genetic frequencies, i.e. migratory processes (Sokal et al., Reference Sokal, Jacquez and Wooten1989). These diffusive phenomena are associated with individuals carrying the same surname, who have moved away from localities with a high frequency of that surname into adjoining localities of low frequency (Sokal et al., Reference Sokal, Harding, Lasker and Mascie-Taylor1992). In contrast, isolation by distance shows a positive and decreasing autocorrelation in the first distance classes, although attaining small negative values of autocorrelation in the last distance class. This is verified when the genetic drift is balanced by individual dispersal (Barbujani, Reference Barbujani1987). A pattern of isolation by distance would be produced by the movement of people over short distances: that is, the dispersal by local movements of people sharing the same surname in a determined area (Sokal et al., Reference Sokal, Harding, Lasker and Mascie-Taylor1992). However, other patterns are possible (Barbujani & Sokal, Reference Barbujani and Sokal1991), such as Depression (D) with a negative peak of autocorrelation in the intermediate distance classes.
Other different patterns suggest that the movement of individuals has a non-linear, more complex development; they do not stem from simple individual diffusion processes, as in the case of clines. For instance, long-distance differentiation indicates a moderate positive autocorrelation over short distances and a strong negative autocorrelation over long distances, but it is difficult to draw any conclusions from this pattern and any explanation is uncertain (Barbujani & Sokal, Reference Barbujani and Sokal1991). Spatial autocorrelation analysis was performed using the SAAP software, and the remaining analyses were supported by SPSS 17.0
The results of isolation by distance corresponding to Spanish and Portuguese surnames were compared for each province and for the two north/south axes (BM and SR) in order to contrast the differences in the percentages of surnames whose distribution patterns are, or are not, significant. For each area, the Spanish and Portuguese surnames were compared by means of the χ2 test of homogeneity of proportions and Fisher's exact test. Finally, the observed frequency of Portuguese and Spanish surnames corresponding to each of the seven categories of isolation by distance (C, D, DD, DF, I, IBD+D and LDD) were compared with their expected frequency in the case of them having a homogeneous distribution. Once these seven classifications were grouped into a single category, a test for comparing proportions was performed on Spanish and Portuguese surnames.
Results
Analysis of north/south axes
For the first axis (BM), which comprises 69 municipalities bordering Portugal, an average Rij=0.00424 was obtained. This coefficient is lower than that of the 71 municipalities (Rij=0.00716) belonging to the Silver Route axis (SR).
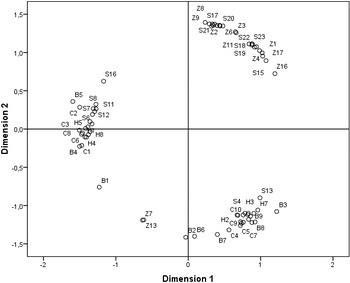
The application of multidimensional scaling on the matrix of similarity of surnames (Rij) revealed noticeable differences between the two axes regarding the topological distribution of localities. For BM, three groupings can be identified (Fig. 2). Nucleus 2, which includes municipalities in Salamanca and Zamora Provinces, is clearly distinguished. These two provinces correspond to the Duero hydrographic basin. The other two nuclei (1 and 3) are composed of localities from all the provinces, but not from Zamora. However, in nucleus 1 there is a predominance of localities in Cáceres and Salamanca, mainly belonging to the Tajo hydrographic basin, while nucleus 3 most commonly includes villages in Badajoz and Huelva Provinces, which include the course of the Guadalquivir River. In the present study, the nucleus grouping described is indicative of a certain relationship between the hydrographic basin and the distribution of surnames.
Multidimensional scaling for the border axis (BM) municipalities (designated by alphanumeric codes). Z indicates municipalities belonging to the province of Zamora; S: Salamanca; C: Cáceres; B: Badajoz; H: Huelva.

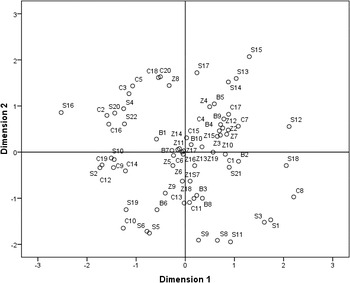
Comparing these results with those provided by the multidimensional scaling concerning the SR north/south axis, no differential groupings can be observed (Fig. 3). However, it should be noted that SR does not include localities in Huelva Province.
Multidimensional scaling for the Silver Route axis (SR) municipalities (designated by alphanumeric codes). Z indicates municipalities belonging to the province of Zamora; S: Salamanca; C: Cáceres; B: Badajoz; H: Huelva.

To compare the patterns of dispersion of Spanish and Portuguese surnames, spatial autocorrelation analysis was performed for the 80 surnames regarding both north/south axes (Table 2). Significant differences were found for the Silver Route (SR Spanish, p=0.0066, SR Portuguese, p=0.0090) but not for the axis including the border municipalities (BM). It is worth noting that 55% of the patterns obtained for Spanish surnames were statistically significant along the Silver Route, while only 20% of Portuguese surnames were significant.
Patterns of distribution of observed frequencies of Spanish and Portuguese surnames

C (Cline), D (Depression), IBD+D (Isolation by Distance and Depression). Others: DD (Double Depression), DF (Different), I (Intrusion), LDD (Long-Distance Differentiation) along the two north/south axes. BM, border axis; SR, Silver Route axis.
For the two axes BM and SR, the relative frequencies of Portuguese surnames were correlated (Pearson) with the altitude and census of each municipality (Table 3). A negative coefficient was obtained for the altitude (indicative of isolation) and positive with the census. Differences between BM and SR are appreciable: for the first axis R is lower in both correlations.
Pearson's correlation coefficients for each municipality for relative frequency of Portuguese surnames with its census size and altitude

Top, border municipalities (BM); bottom, Silver Route municipalities (SR).
**p<0.01 (bilateral); *p<0.05 (bilateral).
Analysis by province
The relative frequencies of the selected Portuguese surnames with regard to the total are shown in Fig. 4 for the municipalities belonging to the border provinces, as well as for Spain as a whole. In both cases a west–east cline can be seen, with the greatest frequencies corresponding to the west. The municipalities with the highest frequencies of Portuguese surnames are concentrated in the provinces of Huelva and Badajoz.
Relative frequency of Portuguese surnames in the Spanish municipalities in the Spanish provinces adjoining the Portuguese border (left) and in all Spanish provinces (right).

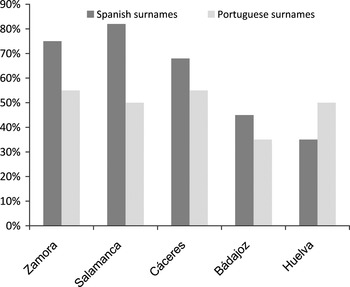
The percentages of significant patterns for Portuguese surnames are similar in the five provinces studied. However, this uniformity is not the case for Spanish surnames, which reveal a north–south cline with maximum frequencies in the province of Salamanca and minimum frequencies in Huelva (Fig. 5).
Percentage of surnames with significant patterns in the five Spanish provinces analysed.

Differences are observed between surnames with and without significant patterns of dispersion in Zamora, Salamanca, Cáceres and Huelva (where the percentage with is lower than in the other provinces) only for Spanish, but not for Portuguese, surnames. In a comparison of Spanish and Portuguese surnames with and without distribution patterns by means of the test of homogeneity, significant differences were observed only in Salamanca (p=0.0053) and Badajoz (p=0.0001). The outstanding patterns are: D, DD and IBD+D for Spanish surnames and C for the Portuguese.
Discussion
The comparison of the two north/south axes (SR and BM) based on topological representations of the multidimensional scaling shows a greater homogeneity among the localities belonging to the Silver Route, a fact that was confirmed by the observed differences for Rij, which are greater for SR than for BM. A communications corridor as important as the Silver Route would have facilitated migratory and genetic exchange among the localities interconnected by it. Due to this, the geographic effect of the hydrographic basin vanishes for the SR, but can still be observed for the BM axis.
The existence of the cattle migration routes, which run alongside the SR and continue in use today, may also have contributed to the homogeneous distribution of surnames. Migratory movement related to stockbreeding, even if it has not resulted in long-distance migration, may have been important in the provinces of Zamora, Salamanca and Cáceres, owing to its uninterrupted existence since the 12th century to the present day.
Although a homogeneous pattern of dispersion is not observed either for the whole of the territory studied or for Spanish and Portuguese surnames, a gradual cline (C) without any major discontinuities was found for Spanish surnames in BM, as well as a depression pattern (D), suggesting a cline of dispersion but only for neighbouring localities. There is therefore evidence of isolation by distance involving the movement of individuals over short distances, which does not contradict the relative homogeneity of surnames in BM populations. Nuclei that are geographically close tend to exchange mostly immigrants (Sokal et al., Reference Sokal, Harding, Lasker and Mascie-Taylor1992; Barbujani, Reference Barbujani2000), but a constant exchange generates uniformity over a wider area.
For the same axis (BM), Portuguese surnames fit a double depression pattern (DD). This reveals a median distance relationship that can be explained by isolation by distance. These could be individuals residing in neighbouring localities sharing the same surname and originating in an equidistant area beyond the border, who had migrated to be close to economically attractive localities. There were displacements from some localities to others, with directionally selective patterns equivalent to those identified by Abade (Reference Abade1992) between villages in northern Portugal and Galicia.
Regarding SR, significant patterns are found only for the Spanish surnames, with C being the most notable. Surnames would have been transmitted along communications pathways, generating a constant migratory and genetic flow that has homogenized the frequencies of these surnames along this axis. No significant patterns exist for Portuguese surnames, contrary to the findings for the BM axis. This fact proves that native Portuguese dwellers would have moved initially to Spanish localities near the border, and that their surnames would have spread to other specific municipalities in subsequent generations, but without any ulterior dispersion in the territory, as shown in Fig. 4 and Table 3.
The spatial autocorrelation analysis by province shows the existence of a high percentage of surnames with significant patterns. These results are similar to those reported by Caravello et al. (Reference Caravello, Tasso and Lucchetti1999) for the Dolomites (Italy), where municipalities are very close together. However, our percentages are higher than the values obtained by Caravello et al. (Reference Caravello, Tasso and Lucchetti2002) for the Cimbro-Mòcheno communities in Italy, where widely spaced villages belonging to different geographic contexts limited movement. In the five Spanish provinces, the high percentage of significant clines is indicative of an elevated dispersion of individuals, always under the effects of isolation by distance.
Regarding the clines of dispersion in the five provinces bordering Portugal, a high percentage of significant clines without a clear pattern (DF) was found. This could be explained by internal migration combined with a high degree of isolation in various localities, resulting in undifferentiated clines. The patterns C and D (clines for intermediate and short distance), followed by DD, also predominate – mainly for the most frequent surnames – which may conceal a polyphyletic origin for some of them. These patterns were observed in the provinces of Zamora, Salamanca and Cáceres. A certain degree of substructure was reported in rural areas in the first province, conditioned by historical settlements and occasional migrations, as well as by a high degree of isolation and inbreeding (Alvarez et al., Reference Alvarez, Mendoza, Nogués, Aluja and Santos2010). Badajoz and Huelva show the isolation by distance pattern IBD+D was associated with depression (D). The closer the municipalities, the more similar were the distribution of surnames. Since there are no major geographic barriers between the nuclei in these two provinces, their economic activities would make them more sedentary, thereby explaining the above patterns. In the municipalities belonging to these provinces, the phenomenon of seasonal cattle migration was negligible compared with all the others. The pattern LDD is significant for Portuguese surnames in Huelva, which is indicative of moderate autocorrelation for short distances and strongly negative for long distances (following Caravello & Tasso, Reference Caravello and Tasso1999). Although the presence of this pattern is difficult to explain (Barbujani & Sokal, Reference Barbujani and Sokal1991), it may be related to the higher frequency of Portuguese surnames in this province as a consequence of major displacements of immigrants of that nationality towards western Huelva motivated by labour interests (mining, harvesting, fishing) during the 19th and 20th centuries (López-Martínez, Reference López Martínez2004).
Other estimators of the degree of isolation in human populations, such as endogamy and inbreeding (see Colantonio et al., Reference Colantonio, Lasker, Kaplan and Fuster2003), have reported high values for Spain in comparison with other European countries. However, there were considerable territorial variations, urban/rural differences and temporal changes (Fuster & Colantonio, Reference Fuster and Colantonio2002). In an analysis of the whole country, Rodriguez Larralde et al. (Reference Rodriguez-Larralde, Gonzales-Martin, Scapoli and Barrai2003) indicated a high isolation for Andalusia and Castile-Leon – the regions to which the provinces of Huelva, Cáceres and Salamanca belong – with the latter provinces displaying greater uniformity in the distribution of surnames. The economic activities in a region, or even in a specific locality, determine its degree of isolation or genetic openness. Thus Caravello et al. (Reference Caravello, Tasso and Rigobello2009) have shown that on the Padana plain (northern Italy), the town of Battaglia Terme saw a breakdown in its genetic isolation as a consequence of its intense commercial activity during a certain period of its history.
Conclusions
The comparison of surnames of Spanish or Portuguese origin reveals different patterns that vary among provinces depending on their demographic and economic history. Seasonal cattle migration – which was more common in the provinces of Zamora, Salamanca and Cáceres – could, in addition to other factors, explain the higher degree of dispersion of Spanish surnames; while in Huelva and Badajoz, the predominance of sedentary activities would have limited their diffusion. Portuguese surnames, in contrast, have a greater presence in these two last provinces, which could be explained by migration processes generated by the demand for labour. Although in the area under study the border between Spain and Portugal does not represent an important geographic obstacle, it has acted as an effective barrier against the diffusion of surnames (and therefore of individuals). This barrier effect may also have been the result of political regulations that hindered the exchange of goods and people, or due to psychological reasons. The intra-provincial migratory flow has followed the road networks, but in a differentiated manner for municipalities near the border. In conclusion, the above factors, together with the historical and economic characteristics of the Spanish region bordering Portugal, have contributed to shape its genetic and demographic structure.
Acknowledgments
This paper was supported by the Spanish Ministry of Science and Technology (projects CGL2004-00928 and CGL2008-03737).