Introduction
There is strong evidence that measures of psychosis proneness in non-clinical populations are associated with a family history of psychotic disorder (Linscott & van Os, Reference Linscott and Van Os2013; Jeppesen et al. Reference Jeppesen, Larsen, Clemmensen, Munkholm, Rimvall, Rask, Van Os, Petersen and Skovgaard2015). However, early reports on associations between measures of psychosis proneness in the general population and genome-wide association study (GWAS)-based polygenic risk scores (PRS) for schizophrenia (International Schizophrenia et al. Reference Purcell, Wray, Stone, Visscher, O'Donovan, Sullivan and Sklar2009; Iyegbe et al. Reference Iyegbe, Campbell, Butler, Ajnakina and Sham2014) are inconclusive (Sieradzka et al. Reference Sieradzka, Power, Freeman, Cardno, McGuire, Plomin, Meaburn, Dudbridge and Ronald2014; Zammit et al. Reference Zammit, Hamshere, Dwyer, Georgiva, Timpson, Moskvina, Richards, Evans, Lewis, Jones, Owen and O'Donovan2014; Jones et al. Reference Jones, Stergiakouli, Tansey, Hubbard, Heron, Cannon, Holmans, Lewis, Linden, Jones, Davey Smith, O'Donovan, Owen, Walters and Zammit2016; van Os, Reference Van Os2016). Any association between psychosis proneness and PRS may be stronger in relatives of patients, compared with the general population, given that expression of psychosis-related phenotypes likely is attributable to genes shared with the patient relative (Kendler et al. Reference Kendler, McGuire, Gruenberg, O'Hare, Spellman and Walsh1993; Cardno et al. Reference Cardno, Marshall, Coid, Macdonald, Ribchester, Davies, Venturi, Jones, Lewis, Sham, Gottesman, Farmer, McGuffin, Reveley and Murray1999), whereas expression of psychosis-related phenotypes in general population samples may be associated more with environmental effects (Van Os et al. Reference Van Os, Kenis and Rutten2010; Linscott & van Os, Reference Linscott and Van Os2013; Svrakic et al. Reference Svrakic, Zorumski, Svrakic, Zwir and Cloninger2013). We therefore hypothesized that the link between PRS and expression of psychosis phenotypes would be stronger in relatives of patients, who share liability genes with their ill relative, as compared with the general population, whose level of genetic liability is much lower.
Data pertained to patients with psychotic disorder (n = 1119), their parents (n = 920) and siblings (n = 1059) and healthy comparison subjects (n = 586) participating in the baseline, 3-year and 6-year follow-up assessments of the Genetic Risk and Outcome of Psychosis (GROUP) study. Repeated measures of two psychosis phenotypes, indexed with the Community Assessment of Psychic Experiences (CAPE; self-report) and the Structured Interview for Schizotypy – Revised (SIS-R; clinical interview), were examined for association with PRS. Given strong associations between psychosis phenotypes and measures of affective dysregulation (Verdoux et al. Reference Verdoux, Van Os, Maurice-Tison, Gay, Salamon and Bourgeois1999; Hanssen et al. Reference Hanssen, Peeters, Krabbendam, Radstake, Verdoux and Van Os2003; Van Rossum et al. Reference Van Rossum, Dominguez, Lieb, Wittchen and Van Os2011; Varghese et al. Reference Varghese, Scott, Welham, Bor, Najman, O'Callaghan, Williams and McGrath2011; Wigman et al. Reference Wigman, Van Nierop, Vollebergh, Lieb, Beesdo-Baum, Wittchen and Van Os2012; Stochl et al. Reference Stochl, Khandaker, Lewis, Perez, Goodyer, Zammit, Sullivan, Croudace and Jones2015), affective outcomes were also included in the analyses. Given the commonly hypothesized notion that genetic effects in schizophrenia are mediated through altered neurodevelopment (Hubbard et al. Reference Hubbard, Tansey, Rai, Jones, Ripke, Chambert, Moran, McCarroll, Linden, Owen, O'Donovan, Walters and Zammit2016), neurocognition was also examined in relation to PRS.
Methods
GROUP study
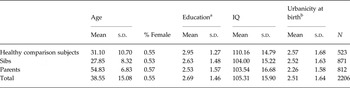
Full details of the GROUP study have been presented elsewhere (Steinberg et al. Reference Steinberg, De Jong, Andreassen, Werge, Borglum, Mors, Mortensen, Gustafsson, Costas, Pietilainen, Demontis, Papiol, Huttenlocher, Mattheisen, Breuer, Vassos, Giegling, Fraser, Walker, Tuulio-Henriksson, Suvisaari, Lonnqvist, Paunio, Agartz, Melle, Djurovic, Strengman, Jurgens, Glenthoj, Terenius, Hougaard, Orntoft, Wiuf, Didriksen, Hollegaard, Nordentoft, Van Winkel, Kenis, Abramova, Kaleda, Arrojo, Sanjuan, Arango, Sperling, Rossner, Ribolsi, Magni, Siracusano, Christiansen, Kiemeney, Veldink, Van Den Berg, Ingason, Muglia, Murray, Nothen, Sigurdsson, Petursson, Thorsteinsdottir, Kong, Rubino, De Hert, Rethelyi, Bitter, Jonsson, Golimbet, Carracedo, Ehrenreich, Craddock, Owen, O'Donovan, Ruggeri, Tosato, Peltonen, Ophoff, Collier, St Clair, Rietschel, Cichon, Stefansson, Rujescu and Stefansson2011; Korver et al. Reference Korver, Quee, Boos, Simons and De Haan2012). In representative geographical areas in the Netherlands and Belgium, patients were identified through clinicians working in regional psychotic disorder services, whose caseload was screened for inclusion criteria. Subsequently, a group of patients presenting at these services either as out-patients or in-patients were recruited for the study. Healthy comparison subjects were selected through random mailings to addresses in the catchment areas of the cases. The GROUP study was not conducted in a geographically well-defined small area, as it in fact included the majority of mental health services in the Netherlands, and a substantial part of mental health services in Dutch-speaking Belgium. Healthy comparison subjects could not be representative in all aspects, as an exclusion criterion was absence of a family history of psychotic disorder. The goal was to collect a group of healthy comparison subjects that (i) was collected from the same geographical area as the case in the relevant mental health service, (ii) was sufficiently large to allow for chance variation and (iii) was frequency-matched in age- and sex distribution to the siblings and (iv) had absence of family history of psychotic disorder. Table 1 shows that healthy comparison subjects, siblings and parents had similar sex distributions whilst healthy comparison subjects and siblings did not have large differences in age.
Baseline demographics of GROUP participants in current analysis

a Education (Verhage): range 0 (no education), 3–5 (school diploma) to 8 (university degree).
b Urbanicity: 1 = <500/km2; 2 = 500–1000/km2; 3 = 1000–1500/km2; 4 = 1500–2500/km2; 5 = 2500+/km2.
Sample
The full GROUP sample at baseline consisted of 1119 patients with non-affective psychotic disorder, 1059 siblings of these patients, 920 parents of the patients and 586 unrelated healthy comparison subjects. Inclusion criteria were: (i) age range 16–50 years and (ii) good command of Dutch language. For patients, an additional inclusion criterion was the presence of a clinical diagnosis of non-affective psychotic disorder. Healthy comparison subjects status was confirmed by using the Family Interview for Genetic studies (NIMH.Genetics.Initiative, 1992) with the healthy comparison subject as informant, to establish absence of first degree relatives with a psychotic disorder. Diagnosis was based on the Diagnostic and Statistical Manual of Mental Disorder-IV (DSM-IV) criteria (American Psychiatric Association, 2000), assessed with the Comprehensive Assessment of Symptoms and History (CASH) interview (Andreasen et al. Reference Andreasen, Flaum and Arndt1992) or Schedules for Clinical Assessment for Neuropsychiatry (SCAN 2.1) (Wing et al. Reference Wing, Babor, Brugha, Burke, Cooper, Giel, Jablenski, Regier and Sartorius1990). The majority of patients had a DSM-IV diagnosis of schizophrenia (DSM-IV 295.x; n = 940, 84%). In the sibling and healthy comparison subject groups, there were respectively, 154 (14%) and 59 participants (10%) with a history of a common mental disorder at baseline, the majority of whom had a mood disorder (DSM-IV 296.x).
The study was approved by the standing ethics committee, and all the subjects gave written informed consent in accordance with the committee's guidelines.
Sample for analysis
For the purpose of the current analyses, siblings, parents and healthy comparison subjects groups were included. Analyses were restricted to the European white ethnic group (n = 2218, or 87% out of a total of 2565 siblings, parents and healthy comparison subjects groups at baseline) given the fact that prevalence of risk alleles varies widely across ethnic groups, as may the risk associated with individual alleles, and evidence exists of differential effects of PRS across ethnic groups (Marden et al. Reference Marden, Walter, Tchetgen Tchetgen, Kawachi and Glymour2014). Observations of siblings and healthy comparison subjects who made a possible (n = 2, of whom 1 of European white ethnic group) or definite (n = 16, of whom 11 of European white ethnic group) transition to a psychotic disorder over the follow-up period, and thus were re-classified as patients, were excluded from analysis. Applying ethnicity and transition criteria thus resulted in a baseline sample of 523 healthy comparison subjects, 871 siblings and 812 parents of siblings (total sample: n = 2206). Of the 2206, the number of individuals with data permitting calculation of the PRS was 1578 (72%) with approximately equal proportions across healthy comparison subjects (73%), siblings (67%) and parents (75%).
SIS-R
The SIS-R was administered to healthy comparison subjects, parents and siblings. The SIS-R is a semi-structured interview containing 20 schizotypal symptoms and 11 schizotypal signs rated on a 4-point scale (Kendler et al. Reference Kendler, Lieberman and Walsh1989; Vollema & Ormel, Reference Vollema and Ormel2000). Symptoms are defined as verbal responses to standardized questions concerning, for example, magical ideation, illusions and referential thinking. Signs refer to behaviours that are rated by the interviewer such as goal directedness of thinking and flatness of affect. Questions and rating procedures are standardized. Guided by previous research, 33 item scores were reduced a priori to two-dimensional scores, representing the means of seven positive schizotypy items (covering the areas of referential thinking, psychotic phenomena, derealisation, magical ideation, illusions and suspiciousness) and eight negative-disorganized schizotypy items (covering the areas of social isolation, sensitivity, introversion, restricted affect, disturbances in associative and goal-directed thinking, poverty of speech and eccentric behaviour).
CAPE
The CAPE (www.cape42.homestead.com) was developed in order to rate self-reports of lifetime psychotic experiences (Konings et al. Reference Konings, Bak, Hanssen, Van Os and Krabbendam2006). Items are modelled on patient experiences as contained in the Present State Examination, 9th version (Wing et al. Reference Wing, Cooper and Sartorius1974), schedules assessing negative symptoms such as the Scale for the Assessment of Negative Symptoms (SANS) (Andreasen, Reference Andreasen1982) and the Subjective Experience of Negative Symptoms (SENS) (Selten et al. Reference Selten, Sijben, Van Den Bosch, Omloo Visser and Warmerdam1993) and scales assessing depressive symptoms such as the Calgary Depression Scale (Addington et al. Reference Addington, Addington and Maticka-Tyndale1993). Items are scored on a 4-point scale. In the current analyses, CAPE dimensions of frequency of positive experiences (20 items), negative experiences (14 items) and depressive experiences (eight items) were included (measured at baseline and 3- and 6-year follow-up), representing the person's perceived psychosis load over the lifetime (at baseline) or in the past 3 years (follow-up). A total score representing the mean of all items was calculated for each dimension.
Manic and depressive episodes
Lifetime rate of depressive and manic episodes were derived from the CASH interview (data available for 3 of the 4 centres).
Intelligence quotient (IQ)
At baseline and 3-year follow- = up, IQ was estimated based on the four-subtest version (Information, Block Design, Digit Symbol Coding and Arithmetic) (Blyler et al. Reference Blyler, Gold, Iannone and Buchanan2000) of the Wechsler Adult Intelligence Scale (WAIS-III) (Wechsler, Reference Wechsler1997). At 6-year follow-up, IQ was estimated based on a short version of the WAIS-III short form: the Digit Symbol Coding subtest, uneven items of the Arithmetic subtest, uneven items of the Block Design subtest, every third item of the Information subtest (Velthorst et al. Reference Velthorst, Levine, Henquet, De Haan, Van Os, Myin-Germeys and Reichenberg2013).
Follow-up
Healthy comparison subjects and siblings were eligible for follow-up; parents were only assessed at baseline. Of the 523 healthy comparison subjects and 871 siblings at baseline, 80% (n = 1115) were assessed at 3-year follow-up (healthy comparison subjects: 79%, n = 415; siblings: 80%, n = 700) and 69% (n = 973) at 6-year follow-up (healthy comparison subjects: 68%, n = 357; siblings: 71%, n = 616). Ratings of CASH, SCAN, SIS-R and CAPE at follow-up reflected the period between baseline and first follow-up, and between first and second follow-up, respectively. Mean time to first follow-up was 3.3 years (s.d. = 0.5) and mean between first and second follow-up was 3.1 years (s.d. = 0.4).
Genotyping, imputation and PRS
Genotyping was performed using two platforms. A total of 1434 participants (758 patients, 676 healthy comparison subjects) were genotyped on the Illumina platform for 547 383 SNPs on the Illumina HumanHap 550k v3.0 beadchip. A second group of 1968 participants (393 patients, 154 controls and 1421 healthy relatives) were genotyped for 929 556 SNPs using the Affymetrix genome-wide Human SNP Array version 6.0.
A binary data set of the Illumina platform was generated including 547 383 genotyped variants in 1434 subjects. We excluded 36 samples showing a sex mismatch between recorded and the genetically determined gender type, leaving 1,398 people for further analysis. We excluded SNPs that were haploid or had missing rates per SNP of >0.10, or a MAF of <0.01 or a HWE p value<0. 00001 (in healthy comparison subjects) and excluded individuals, with a missing rate >10%, altogether yielding 515 286 variants and 1393 individuals (737 patients and 656 healthy comparison subjects) for further analysis. Next, a binary data set of Affymetrix platform was generated including 929 556 SNPs genotyped in 1968 subjects (393 patients and 1575 relatives), of which 729 597 SNPs and 1968 individuals passed the standard quality processing checks. We successfully converted genetic coordination of all variants (except for 57 from Illumina and 86 from Affymetrix) from Human NCBI36/hg18 to GRCh37/hg19 using Liftover (online tools) for all samples. Next, we imputed both platform samples on the backbone of 1000 G Phase-3 reference haploblocks, as implemented in the Haplotype Reference Consortium (HRC) (McCarthy et al. Reference McCarthy, Das, Kretzschmar, Delaneau, Wood, Teumer, Kang, Fuchsberger, Danecek, Sharp, Luo, Sidore, Kwong, Timpson, Koskinen, Vrieze, Scott, Zhang, Mahajan, Veldink, Peters, Pato, Van Duijn, Gillies, Gandin, Mezzavilla, Gilly, Cocca, Traglia, Angius, Barrett, Boomsma, Branham, Breen, Brummett, Busonero, Campbell, Chan, Chen, Chew, Collins, Corbin, Smith, Dedoussis, Dorr, Farmaki, Ferrucci, Forer, Fraser, Gabriel, Levy, Groop, Harrison, Hattersley, Holmen, Hveem, Kretzler, Lee, McGue, Meitinger, Melzer, Min, Mohlke, Vincent, Nauck, Nickerson, Palotie, Pato, Pirastu, McInnis, Richards, Sala, Salomaa, Schlessinger, Schoenherr, Slagboom, Small, Spector, Stambolian, Tuke, Tuomilehto, Van Den Berg, Van Rheenen, Volker, Wijmenga, Toniolo, Zeggini, Gasparini, Sampson, Wilson, Frayling, De Bakker, Swertz, McCarroll, Kooperberg, Dekker, Altshuler, Willer, Iacono, Ripatti, Soranzo, Walter, Swaroop, Cucca, Anderson, Myers, Boehnke, McCarthy and Durbin2016), using the Michigan Imputation Server and the SHAPEIT option for phasing. This yielded 46 178 415 imputed variants, which was reduced to 16 353 433 SNPs after selecting SNPs with a quality score (info score) threshold of >0.30, of which 9 067 392 variants and 1393 subjects passed the post-imputation QC. As for Affymetrix genotypes, 1kG-based imputation yielded 46 178 419 imputed SNPs, which were reduced to 9 122 501 SNPs after implementing post-imputation quality controls in 1968 subjects. These were included in the next step.
In order to calculate PRS, we obtained summary statistics of the genome-wide association study from the Psychiatric Genomic Consortium-2 (PGC2) (Schizophrenia Working Group of the Psychiatric Genomics, 2014), which included the GROUP subjects. We performed meta-analysis again while excluding GROUP samples as well as other Dutch samples, including a total of 17 104 566 SNPs, of which 8 242 976 SNPs were common with imputed GROUP genotypes from Illumina-based variants and 8 290 712 variant from Affymetrix-based variants. Following the approach taken by the international psychiatric GWAS consortium, we calculated a PRS at the metagwas p-threshold of <0.1 for association with Schizophrenia by PGC2. This included 2 302 038 SNPs of which 1 481 064 SNPs were common with the Illumina genotype dataset, and 1 483 770 SNPs were common with the Affymetrix genotype data set (1 455 047 SNPs are common across both platforms). Furthermore, we repeated our association analysis at p-threshold of <0.01, which constituted 449 794 SNPs (364 121common with the Illumina platform, 363 305common with the Affymetrix platform and 360 150 SNPs common across both platforms). We used PRSice (Euesden et al. Reference Euesden, Lewis and O'Reilly2015) software to calculate PRS; by LD clumping of r2 value < 0.2, at distance threshold of 250 kb, while adjusting for 10 eigenvectors calculated by Eigenstrat (Price et al. Reference Price, Patterson, Plenge, Weinblatt, Shadick and Reich2006). This led to inclusion of 119 653 SNPs from the Illumina platform and 119 271 SNPs from Affymetrix for estimating PRS at p-metagwas<0.1; and 25 250 SNPs from the Illumina and 25 152 SNPs from the Affymetrix platform to estimate PRS at p-metagwas<0.01. We calculated different PRS using different p value thresholds, from 0 to 0.50, and checked the explained variances at the different threshold of PRS on schizophrenia using Nagelkerke's R-square. The analyses are based on the p-threshold of 0.01 with sensitivity analyses for the p-threshold of 0.1. For ease of interpretation, a constant was added to the two PRS scores, so that the minimum value was 0.
Analyses
GROUP database version 5.0 was used for all analyses. Random intercept multilevel regression models (given clustering of individuals within families as well as clustering of repeated measures within subjects) with SIS-R and CAPE measures as dependent variables were fitted using the MIXED routine in the Stata program, version 14 (StataCorp, 2015). Independent variables were PRS, a priori corrected for age and sex. In addition, binary outcomes of CASH lifetime depressive and manic episode were modelled using the Stata MEQRLOGIT multilevel random intercept logistic regression routine, similarly adjusted for age and sex.
In order to examine robustness of findings with regard to assumptions of normality, log-transformed outcomes were additionally examined, using the Stata LNSKEW0 routine. LNSKEW0 creates newvar = ln(+/−exp − k), choosing k and the sign of exp so that the skewness of newvar is zero.
In order to assess to what degree associations between PRS and measures of psychosis proneness were independent, regression analyses were conducted for one measure of psychosis proneness, corrected for all the others. In order to examine to what degree any association between PRS and measures of psychosis proneness were mediated by IQ, IQ was added to the analyses as a covariate.
Results
Descriptive results and interaction by group
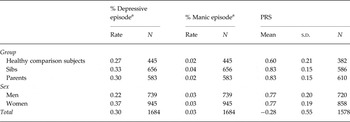
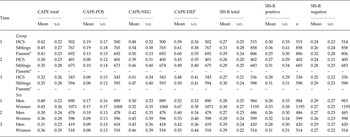
Sample characteristics are displayed in Table 1. Values of the CAPE and SIS-R total score, lifetime depressive and manic episodes and PRS are shown in Table 2, by group and sex. CAPE and SIS-R subscale scores, by group and sex, are shown in Table 3.
Depression and mania outcomes, and polygenic risk scores by group and by sex

PRS, polygenic risk score.
a Lifetime rate, calculated with baseline sample as denominator and including episodes occurring over the 6-year post-baseline follow-up period in the numerator.
Cape and SIS-R subscale scores by group and by sex

CAPE, Community Assessment of Psychic Experiences (subscales of positive, negative and depressive symptoms); SIS-R, Structured Interview for Schizotypy – Revised (subscales of positive and negative schizotypy).
a Parents baseline measures only.
The PRS of the healthy comparison subjects (0.60, s.d. = 0.21) was significantly lower than the PRS in the combined group of parents and siblings (0.83, s.d. = 0.15; p < 0.001). The PRS in the group of parents and siblings was significantly correlated with the PRS in the patient group (r = 0.30, p < 0.0001).
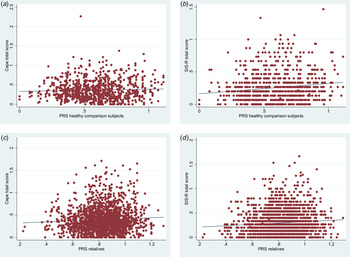
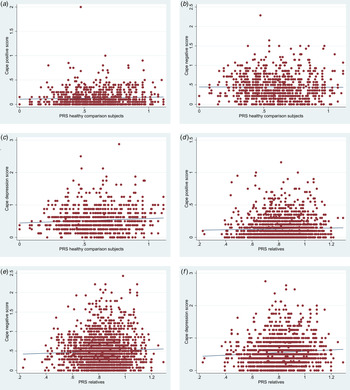
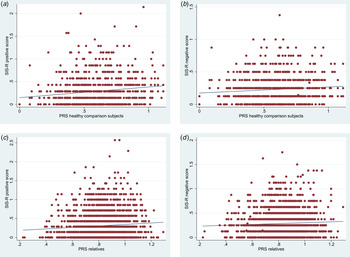
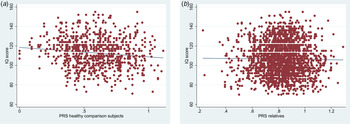
Graphical examination of the scatterplots of PRS on the one hand and CAPE / SIS-R total scores (Fig. 1a–d ), CAPE subscale scores (Fig. 2a–f ), SIS-R subscales scores (Fig. 3a–d ) and IQ (Fig. 4a, b ) on the other suggests association between PRS and various aspects of psychopathology and cognition in both groups.
(a–d) Scatterplots with linear regression line of polygenic risk score (PRS) on the one hand, and, on the other, Community Assessment of Psychic Experiences (CAPE) total score in healthy comparison subjects (Fig. 1a) Structured Interview for Schizotypy – Revised (SIS-R) total score in healthy comparison subjects (Fig. 1b), CAPE total score in relatives (Fig. 1c) and SIS-R total score in relatives (Fig. 1d).

(a–f) Scatterplots with linear regression line of polygenic risk score (PRS) on the one hand, and, on the other, Community Assessment of Psychic Experiences (CAPE) positive score in healthy comparison subjects (Fig. 2a), CAPE negative score in healthy comparison subjects (Fig. 2b), CAPE depression score in healthy comparison subjects (Fig. 2c), CAPE positive score in relatives (Fig. 2d), CAPE negative score in relatives (Fig. 2e), CAPE depression score in relatives (Fig. 2f).

(a–d) Scatterplots with linear regression line of polygenic risk score (PRS) on the one hand, and, on the other, Structured Interview for Schizotypy – Revised (SIS-R) positive score in healthy comparison subjects (Fig. 3a), SIS-R negative score in healthy comparison subjects (Fig. 3b), SIS-R positive score in relatives (Fig. 3c), SIS-R negative score in relatives (Fig. 3d).


Associations in relatives and healthy comparison subjects
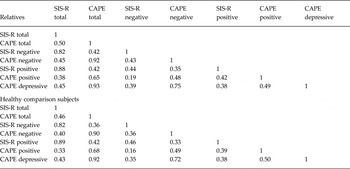
Given the graphical suggestion of differences in the pattern of associations, analyses were conducted separately for relatives and the healthy comparison group. The pattern of correlation between the CAPE and SIS-R total and subscale scores were similar for relative and healthy comparison subjects, in that within-instrument scale correlations were high, whereas between-scale correlations were only moderate (Table 4).
Pattern of Pearson's correlation coefficients between psychopathology measures in relatives (top) and controls (bottom)

CAPE, Community Assessment of Psychic Experiences (subscales of positive, negative and depressive symptoms); SIS-R, Structured Interview for Schizotypy – Revised (subscales of positive and negative schizotypy).
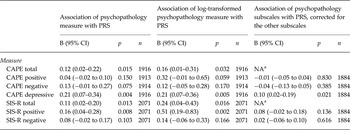
Results of the multilevel random regression analyses are shown in Tables 5–7. In the relatives (Table 6), PRS was associated with CAPE total score (B = 0.12, 95% CI 0.02–0.22, p = 0.015), SIS-R total score (B = 0.11, 95% CI 0.02–0.20, p = 0.013) as well as with CAPE depression (B = 0.21, 95% CI 0.07–0.34, p = 0.004) and the SIS-R positive subscale (B = 0.16, 95% CI 0.04–0.28, p = 0.008). Analyses with log-transformed scales showed similar results (Table 5). Analyses of the CAPE the SIS-R subscales, in which subscales were controlled for each other, showed that associations were reducible to the association with CAPE depression, which continued to be associated with PRS (B = 0.10, 95% CI 0.02–0.19, p = 0.021) whereas the association with the SIS-R positive subscale was rendered non-significant (Table 5).
Results of regression analyses in relatives of patients (B, regression coefficient, 95% CI, 95% confidence interval; p, p value; n, number of observations)

a NA: analyses were conducted with the five subscales: CAPE positive, CAPE negative, CAPE depressive, SIS-R positive, SIS-R negative.
PRS, polygenic risk score; CAPE, Community Assessment of Psychic Experiences (subscales of positive, negative and depressive symptoms); SIS-R, Structured Interview for Schizotypy – Revised (subscales of positive and negative schizotypy).
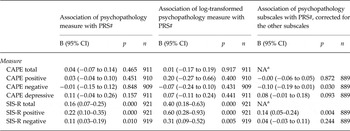
Results of regression analyses in healthy comparison subjects (B, regression coefficient, 95% CI, 95% confidence interval; p, p value; n, number of observations)

a NA: analyses were conducted with the five subscales: CAPE positive, CAPE negative, CAPE depressive, SIS-R positive, SIS-R negative.
#PRS, polygenic risk score; CAPE, Community Assessment of Psychic Experiences (subscales of positive, negative and depressive symptoms); SIS-R = Structured Interview for Schizotypy – Revised (subscales of positive and negative schizotypy).
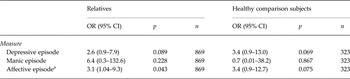
Results of regression analyses in baseline sample for lifetime manic and depressive episodes (including episodes over 6-year follow-up) in relatives and healthy comparison subjects. Odds ratio reflects association between polygenic risk score on the one hand, and depressive/manic episode on the other (OR, odds ratio; 95% CI, 95% confidence interval; p, p value; n, number of observations)

a Any depressive or manic episode.
The association between CAPE depression and PRS was not affected by IQ, as the association with CAPE depression remained similar when IQ was added in addition to age and sex (B = 0.20, 95% CI 0.06–0.34, p = 0.005).
In the healthy comparison subjects (Table 6), PRS was associated with the SIS-R total score (B = 0.16, 95% CI 0.07–0.25, p = 0.000) and both the SIS-R positive subscale (B = 0.22, 95% CI 0.10–0.35, p = 0.000) and the SIS-R negative subscale (B = 0.11, 95% CI 0.03–0.19, p = 0.10) (Table 6). Analyses with log-transformed scales were similar (Table 6). In the analysis in which all subscales were controlled for each other, only the association with the SIS-R positive subscale remained significant (B = 0.14, 95% CI 0.05–0.24, p = 0.004; Table 6).
Analyses of association between PRS and CASH-based lifetime depressive and manic episodes revealed evidence for association in both the relatives (OR any affective episode = 5.2, 95% CI 1.6–16.7, p = 0.006) and the healthy comparison subjects (OR any affective episode = 4.0, 95% CI 1.2–13.1, p = 0.021) (Table 7).
In the relatives, no large or significant association was apparent between PRS and IQ in a separate model of IQ, corrected for age and sex (B = −1.8, 95% CI −8.0 to 4.4; p = 0.566). In the healthy comparison subjects, there was evidence for an association between IQ and PRS, adjusted for age and sex (B = −8.5, 95% CI −15.5 to −1.6; p = 0.017). The association between PRS and IQ in the healthy comparison subjects remained after controlling for SIS-R total score (B = −7.5, 95% CI −14.5 to −0.4; p = 0.038). Similarly, the association between PRS and SIS-R total score in the healthy comparison subjects remained after controlling for IQ (B = 0.16, 95% CI 0.07–0.25; p = 0.001).
Sensitivity analyses at PRS p-threshold of 0.1
Results for the sensitivity analyses were at the PRS p-threshold of 0.1 were very similar to the analyses at the P-threshold of 0.01. The association between PRS and IQ was slightly weaker in the healthy comparison group (B = −7.1, 95% CI −15.1 to 0.9, p = 0.081). In the relatives group, associations between PRS and the CAPE positive and negative subscale were also significant and associations were not reducible to CAPE depression but to the SIS-R positive subscale.
Discussion
The main findings were that (i) PRS was pleiotropically associated with measures of affective dysregulation, aberrant salience and neurocognition; (ii) The association between neurocognition and PRS was present in the healthy comparison subjects but not in the relatives, and was independent of CAPE/SIS-R measures; (iii) Interview-based SIS-R measures appeared to be more sensitive than CAPE-based self-reports in detecting genetic association in the healthy comparison group.
According to the liability-threshold model, a person with a number of risk variants lower than or equal to the critical threshold would not develop schizophrenia, whereas a person with more risk variants would (McGue et al. Reference McGue, Gottesman and Rao1983). As individuals at higher than average genetic risk, such as the first-degree relatives of patients, have higher levels of psychometric and neurocognitive endophenotypes associated with psychotic disorder (Kendler et al. Reference Kendler, McGuire, Gruenberg, O'Hare, Spellman and Walsh1993; Toulopoulou et al. Reference Toulopoulou, Picchioni, Rijsdijk, Hua-Hall, Ettinger, Sham and Murray2007), associations between PRS and such endophenotypes may be more apparent in this group. However, in the current analysis, there was no evidence that associations between PRS and measures of psychopathology and cognition were stronger in the relatives of patients as compared with a group of healthy comparison subjects. Indeed, given stronger evidence for association between PRS and cognition in the healthy control group, the results suggest it may be more, not less difficult to demonstrate associations in the relatives.
A previous investigation in this sample, focussing on the association between childhood trauma and IQ, reported a similar finding in that the association between IQ and childhood trauma was large in the healthy comparison group, intermediate in the relatives and not apparent in the patient group (Van Os et al. Reference Van Os, Marsman, Van Dam, Simons and Investigators2017). Thus, in subjects at higher than average (environmental or genetic) risk, emerging expression of phenotypic alterations may create floor effects, obscuring associations. The results of this study again suggest that particularly measures in the neurodevelopmental domain may be sensitive to such a floor effect, as associations between PRS and subthreshold measures of psychopathology were apparent in both the relative and the healthy comparison groups.
Affective dysregulation, aberrant salience and genetic liability to psychosis
There is a well-established link between affective dysregulation and psychosis, both at the level of clinical illness (Tsuang & Dempsey, Reference Tsuang and Dempsey1979; McMillan et al. Reference McMillan, Enns, Cox and Sareen2009), subthreshold psychotic experiences (Verdoux et al. Reference Verdoux, Van Os, Maurice-Tison, Gay, Salamon and Bourgeois1999; Hanssen et al. Reference Hanssen, Peeters, Krabbendam, Radstake, Verdoux and Van Os2003; Van Rossum et al. Reference Van Rossum, Dominguez, Lieb, Wittchen and Van Os2011; Varghese et al. Reference Varghese, Scott, Welham, Bor, Najman, O'Callaghan, Williams and McGrath2011; Wigman et al. Reference Wigman, Van Nierop, Vollebergh, Lieb, Beesdo-Baum, Wittchen and Van Os2012; Stochl et al. Reference Stochl, Khandaker, Lewis, Perez, Goodyer, Zammit, Sullivan, Croudace and Jones2015), so-called clinical high-risk states (Fusar-Poli et al. Reference Fusar-Poli, Nelson, Valmaggia, Yung and McGuire2014) and in the early prodromal stages (Hafner et al. Reference Hafner, Loffler, Maurer, Hambrecht and An Der Heiden1999). In addition, many studies have suggested an important role of affective dysregulation in the formation of psychotic symptoms (Freeman & Garety, Reference Freeman and Garety1999; Garety et al. Reference Garety, Kuipers, Fowler, Freeman and Bebbington2001; Freeman & Garety, Reference Freeman and Garety2003; Myin-Germeys & van Os, Reference Myin-Germeys and Van Os2007; Fowler et al. Reference Fowler, Hodgekins, Garety, Freeman, Kuipers, Dunn, Smith and Bebbington2012), and molecular genetic studies suggest an overlap between schizophrenia and affective illness (Cross-Disorder Group of the Psychiatric Genomics and Genetic Risk Outcome of Psychosis, 2013; Cross-Disorder Group of the Psychiatric Genomics et al. Reference Lee, Ripke, Neale, Faraone, Purcell, Perlis, Mowry, Thapar, Goddard, Witte, Absher, Agartz, Akil, Amin, Andreassen, Anjorin, Anney, Anttila, Arking, Asherson, Azevedo, Backlund, Badner, Bailey, Banaschewski, Barchas, Barnes, Barrett, Bass, Battaglia, Bauer, Bayes, Bellivier, Bergen, Berrettini, Betancur, Bettecken, Biederman, Binder, Black, Blackwood, Bloss, Boehnke, Boomsma, Breen, Breuer, Bruggeman, Cormican, Buccola, Buitelaar, Bunney, Buxbaum, Byerley, Byrne, Caesar, Cahn, Cantor, Casas, Chakravarti, Chambert, Choudhury, Cichon, Cloninger, Collier, Cook, Coon, Cormand, Corvin, Coryell, Craig, Craig, Crosbie, Cuccaro, Curtis, Czamara, Datta, Dawson, Day, De Geus, Degenhardt, Djurovic, Donohoe, Doyle, Duan, Dudbridge, Duketis, Ebstein, Edenberg, Elia, Ennis, Etain, Fanous, Farmer, Ferrier, Flickinger, Fombonne, Foroud, Frank, Franke, Fraser, Freedman, Freimer, Freitag, Friedl, Frisen, Gallagher, Gejman, Georgieva, Gershon, Geschwind, Giegling, Gill, Gordon, Gordon-Smith, Green, Greenwood, Grice, Gross, Grozeva, Guan, Gurling, De Haan, Haines, Hakonarson, Hallmayer, Hamilton, Hamshere, Hansen, Hartmann, Hautzinger, Heath, Henders, Herms, Hickie, Hipolito, Hoefels, Holmans, Holsboer, Hoogendijk, Hottenga, Hultman, Hus, Ingason, Ising, Jamain, Jones, Jones, Jones, Tzeng, Kahler, Kahn, Kandaswamy, Keller, Kennedy, Kenny, Kent, Kim, Kirov, Klauck, Klei, Knowles, Kohli, Koller, Konte, Korszun, Krabbendam, Krasucki, Kuntsi, Kwan, Landen, Langstrom, Lathrop, Lawrence, Lawson, Leboyer, Ledbetter, Lee, Lencz, Lesch, Levinson, Lewis, Li, Lichtenstein, Lieberman, Lin, Linszen, Liu, Lohoff, Loo, Lord, Lowe, Lucae, Macintyre, Madden, Maestrini, Magnusson, Mahon, Maier, Malhotra, Mane, Martin, Martin, Mattheisen, Matthews, Mattingsdal, McCarroll, McGhee, McGough, McGrath, McGuffin, McInnis, McIntosh, McKinney, McLean, McMahon, McMahon, McQuillin, Medeiros, Medland, Meier, Melle, Meng, Meyer, Middeldorp, Middleton, Milanova, Miranda, Monaco, Montgomery, Moran, Moreno-De-Luca, Morken, Morris, Morrow, Moskvina, Muglia, Muhleisen, Muir, Muller-Myhsok, Murtha, Myers, Myin-Germeys, Neale, Nelson, Nievergelt, Nikolov, Nimgaonkar, Nolen, Nothen, Nurnberger, Nwulia, Nyholt, O'Dushlaine, Oades, Olincy, Oliveira, Olsen, Ophoff, Osby, Owen, Palotie, Parr, Paterson, Pato, Pato, Penninx, Pergadia, Pericak-Vance, Pickard, Pimm, Piven, Posthuma, Potash, Poustka, Propping, Puri, Quested, Quinn, Ramos-Quiroga, Rasmussen, Raychaudhuri, Rehnstrom, Reif, Ribases, Rice, Rietschel, Roeder, Roeyers, Rossin, Rothenberger, Rouleau, Ruderfer, Rujescu, Sanders, Sanders, Santangelo, Sergeant, Schachar, Schalling, Schatzberg, Scheftner, Schellenberg, Scherer, Schork, Schulze, Schumacher, Schwarz, Scolnick, Scott, Shi, Shilling, Shyn, Silverman, Slager, Smalley, Smit, Smith, Sonuga-Barke, St Clair, State, Steffens, Steinhausen, Strauss, Strohmaier, Stroup, Sutcliffe, Szatmari, Szelinger, Thirumalai, Thompson, Todorov, Tozzi, Treutlein, Uhr, Van Den Oord, Van Grootheest, Van Os, Vicente, Vieland, Vincent, Visscher, Walsh, Wassink, Watson, Weissman, Werge, Wienker, Wijsman, Willemsen, Williams, Willsey, Witt, Xu, Young, Yu, Zammit, Zandi, Zhang, Zitman, Zollner, Devlin, Kelsoe, Sklar, Daly, O'Donovan, Craddock, Sullivan, Smoller, Kendler and Wray2013).
There is evidence that psychosis represents a severity dimension of an initial state of affective dysregulation (Kelleher et al. Reference Kelleher, Keeley, Corcoran, Lynch, Fitzpatrick, Devlin, Molloy, Roddy, Clarke, Harley, Arseneault, Wasserman, Carli, Sarchiapone, Hoven, Wasserman and Cannon2012; Wigman et al. Reference Wigman, Van Nierop, Vollebergh, Lieb, Beesdo-Baum, Wittchen and Van Os2012) and that clinical high risk samples with high risk of conversion to psychotic disorder mainly consist of individuals with affective dysregulation (Addington et al. Reference Addington, Cadenhead, Cannon, Cornblatt, McGlashan, Perkins, Seidman, Tsuang, Walker, Woods and Heinssen2007). Therefore, early states of affective dysregulation may give rise to more severe states in which psychotic symptoms arise (Van Os & Reininghaus, Reference Van Os and Reininghaus2016). Additional exposure may be required for psychotic symptom formation, research showing higher risks of psychotic symptom formation with progressively greater level of exposure to environmental risk factors (Cougnard et al. Reference Cougnard, Marcelis, Myin-Germeys, De Graaf, Vollebergh, Krabbendam, Lieb, Wittchen, Henquet, Spauwen and Van Os2007; Guloksuz et al. Reference Guloksuz, Van Nierop, Lieb, Van Winkel, Wittchen and Van Os2015; Van Nierop et al. Reference Van Nierop, Viechtbauer, Gunther, Van Zelst, De Graaf, Ten Have, Van Dorsselaer, Bak, Genetic and Van Winkel2015).
The findings agree with the literature, suggesting that the association between genetic risk and psychosis proneness is not only mediated by psychoticism and neurodevelopmental alterations, but also by measures of affective dysregulation. The effects of polygenic risk thus may be examined further in network models, focussing particularly on the strength of the connection between affective dysregulation, cognition and psychotic symptoms. Similarly, gene–environment interactions may converge at the level of the connection between affective dysregulation, cognition and psychotic symptoms.
Cognitive alterations and neurodevelopmental hypothesis
The premorbid cognitive alterations in schizophrenia are one of the core findings supporting the neurodevelopmental hypothesis (Jones et al. Reference Jones, Rodgers, Murray and Marmot1994). There was evidence for an association between IQ and PRS, however it may be hypothesized that environmental exposures such as childhood trauma, that have been shown to also impact cognitive development (Majer et al. Reference Majer, Nater, Lin, Capuron and Reeves2010; Gould et al. Reference Gould, Clarke, Heim, Harvey, Majer and Nemeroff2012; Maguire et al. Reference Maguire, Williams, Naughton, Cowley, Tempest, Mann, Teague and Kemp2015; Philip et al. Reference Philip, Sweet, Tyrka, Carpenter, Albright, Price and Carpenter2016) may also play a causal role in the development of cognitive alterations in psychosis (Lysaker et al. Reference Lysaker, Meyer, Evans, Clements and Marks2001; Aas et al. Reference Aas, Steen, Agartz, Aminoff, Lorentzen, Sundet, Andreassen and Melle2012; Sahu et al. Reference Sahu, Malavade and Jacob2016; Van Os et al. Reference Van Os, Marsman, Van Dam, Simons and Investigators2017). In addition, genetic variation and epistasis not included in the PRS may contribute to cognitive alterations as well. It has been reported that less than a fifth of the effect of family history on the occurrence of psychotic disorder is mediated by PRS (Agerbo et al. Reference Agerbo, Sullivan, Vilhjalmsson, Pedersen, Mors, Borglum, Hougaard, Hollegaard, Meier, Mattheisen, Ripke, Wray and Mortensen2015), leaving room for the impact of other genetic factors, assuming not all of the remainder of the effect of family history is ‘environmental’.
Given evidence that most of the overall effect of a schizophrenia diagnosis on cognitive performance is mediated through a single common factor, indicating that a generalized cognitive deficit is a core underlying feature (Dickinson et al. Reference Dickinson, Iannone, Wilk and Gold2004), a general measure like IQ arguably is the most useful to examine in the context of associations with PRS. There have been conflicting reports on associations between measures of cognition and schizophrenia polygenic scores in patient and control samples using a variety of different cognitive measures (Hatzimanolis et al. Reference Hatzimanolis, Bhatnagar, Moes, Wang, Roussos, Bitsios, Stefanis, Pulver, Arking, Smyrnis, Stefanis and Avramopoulos2015; Hubbard et al. Reference Hubbard, Tansey, Rai, Jones, Ripke, Chambert, Moran, McCarroll, Linden, Owen, O'Donovan, Walters and Zammit2016; Mark & Toulopoulou, Reference Mark and Toulopoulou2016), however no previous report has examined the association in a large sample of non-ill individuals at higher than average genetic risk with repeated measures of IQ over time. Given evidence for an association between PRS and IQ in healthy control group, it may be hypothesized that PRS for schizophrenia is expressed, at least in part, as a cognitive measure that correlates with IQ.
Methodological issues
The results should be interpreted in the light of several methodological considerations. First, although the sample size was substantial, it was still relatively small for a molecular genetic study. Nevertheless, effect sizes were detectable. A previous general population study with a larger sample suggested a weak association with CAPE negative scores however in that study (Jones et al. Reference Jones, Stergiakouli, Tansey, Hubbard, Heron, Cannon, Holmans, Lewis, Linden, Jones, Davey Smith, O'Donovan, Owen, Walters and Zammit2016), CAPE positive and CAPE depression scores were not included. Given that CAPE negative scores are strongly associated with CAPE depression scores (0.7 in the current study), the reported association with CAPE negative scores may be considered compatible with the current findings (van Os, Reference Van Os2016), given that CAPE depression in the healthy comparison group directionally showed the same type of association as in the relatives, albeit weaker. In any case, the results of this study show that self-reports of psychosis-proneness in the general population may not be sensitive in detecting genetic associations. Second, it could be argued that lack of association between IQ and PRS in the relatives cannot be interpreted fully without examination of the association between IQ and PRS in their patient relatives; if the association is present in the patient group but not in their relatives, this may indicate that PRS can contribute to IQ in interaction with other genetic or non-genetic factors that patients may have been differentially exposed to. However, analysis of the association between repeated measure of IQ and PRS in the patient group (1304 observations in 596 patients) similarly yielded no evidence of association (B = 1.7, 95% CI −4.5 to 7.9; p = 0.597). Third, it could be argued that the association between PRS and measures of affective dysregulation in the relatives is confounded by PRS-associated poor illness outcome in the patients, negatively impacting mental health of the relatives. However, the absence of an association between PRS and cognitive alterations, which are associated with poor outcome, makes it unlikely that PRS is associated with poor outcome. Although PRS was associated with positive symptoms of psychosis, positive symptoms are not associated with poor outcome. In order to verify this issue analytically, we re-examined the association between PRS and CAPE depression, additionally adjusting the analysis for the following outcome measures in the patient relative: number of unmet needs, measures with the Camberwell Assessment of Needs (Slade et al. Reference Slade, Phelan, Thornicroft and Parkman1996), GAF-symptoms and GAF-disability (World Health Organisation, 1992). This adjustment did not reduce the association (B = 0.22, 95% CI 0.08–0.36, p = 0.003). Finally, although two different genotyping platforms were used, one for controls and another for relatives, the use of imputation across platforms can be considered an effective way to control for this. In addition, analyses in the relatives were entirely within-platform, and analyses in the healthy comparison subjects was also largely within platform.
Acknowledgements
The infrastructure for the GROUP study is funded through the Geestkracht programme of the Dutch Health Research Council (ZON-MW, grant number 10-000-1001), and matching funds from participating industry (Lundbeck, AstraZeneca, Eli Lilly, Janssen Cilag), universities and mental health care organizations (Amsterdam: Academic Psychiatric Centre of the Academic Medical Center and the mental health institutions: GGZ Ingeest, Arkin, Dijk en Duin, GGZ Rivierduinen, Erasmus Medical Centre, GGZ Noord Holland Noord. Maastricht: Maastricht University Medical Centre and the mental health institutions: GGZ Eindhoven en De Kempen, GGZ Breburg, GGZ Oost-Brabant, Vincent van Gogh voor Geestelijke Gezondheid, Mondriaan, Zuyderland, MetGGZ, Riagg-Virenze Maastricht, Universitair Centrum Sint-Jozef Kortenberg, CAPRI University of Antwerp, PC Ziekeren Sint-Truiden, PZ Sancta Maria Sint-Truiden, GGZ Overpelt, OPZ Rekem. Groningen: University Medical Center Groningen and the mental health institutions: Lentis, GGZ Friesland, GGZ Drenthe, Dimence, Mediant, GGNet Warnsveld, Yulius Dordrecht and Parnassia psycho-medical center The Hague. Utrecht: University Medical Center Utrecht and the mental health institutions Altrecht, GGZ Centraal, Riagg Amersfoort and Delta). Funded in part by the European Community's Seventh Framework Program under grant agreement No. HEALTH-F2-2009-241909 (Project EU-GEI). We are grateful for the generosity, in terms of time and effort, shown by the patients, their families and the healthy comparison subjects and for the continuing collaboration with all the researchers who made the GROUP project possible. Furthermore, we would like to thank all research personnel involved in the GROUP project, in particular: Joyce van Baaren, Erwin Veermans, Ger Driessen, Truda Driesen, Karin Pos, Erna van ‘t Hag, Jessica de Nijs, Wendy Beuken and Debora Op ‘t Eijnde.
Appendix
GROUP Investigators
GROUP investigators are: Berhooz Z. Alizadeha, Agna A. Bartels-Velthuisa, Nico J. van Beverenb,c,d, Richard Bruggemana, Wiepke Cahne, Lieuwe de Haanf, Philippe Delespaulg, Carin J. Meijerf, Inez Myin-Germeysh, Rene S. Kahne, Frederike Schirmbeckf, Claudia J.P. Simonsg,i, Neeltje E. van Harene, Jim van Osg,j, Ruud van Winkelg,h
aUniversity of Groningen, University Medical Center Groningen, University Center for Psychiatry, Groningen, The Netherlands; bAntes Center for Mental Health Care, Rotterdam, The Netherlands; cErasmus MC, Department of Psychiatry, Rotterdam, The Netherlands; dErasmus MC, Department of Neuroscience, Rotterdam, The Netherlands; eUniversity Medical Center Utrecht, Department of Psychiatry, Brain Center Rudolf Magnus, Utrecht, The Netherlands; fAcademic Medical Center, University of Amsterdam, Department of Psychiatry, Amsterdam, The Netherlands; gMaastricht University Medical Center, Department of Psychiatry and Psychology, School for Mental Health and Neuroscience, Maastricht, The Netherlands; hKU Leuven, Department of Neuroscience, Research Group Psychiatry, Center for Contextual Psychiatry, Leuven, Belgium; iGGzE, Institute for Mental Health Care Eindhoven and De Kempen, Eindhoven, The Netherlands; jKing's College London, King's Health Partners, Department of Psychosis Studies, Institute of Psychiatry, London, UK