INTRODUCTION
Sponge taxonomy is based primarily on the characteristic features of the skeleton, particularly the shape and size of its constitutive elements (Boury-Esnault, Reference Boury-Esnault2006), whose levels of inter- and intra-specific variation are often hard to discriminate, making them prone to large subjective interpretations by taxonomists (Hooper et al., Reference Hooper, Capon, Keenan, Parry, Reitner and Keupp1991). The paucity of diagnostic characteristics for taxon delimitation in sponges makes their systematics very complex and often conservative (Hooper et al., Reference Hooper, Capon, Keenan, Parry, Reitner and Keupp1991; Klautau et al., Reference Klautau, Russo, Lazoski, Boury-Esnault, Thorpe and Solé-Cava1999). Although many studies apply different approaches to complement morphological information, we are still very far from knowing the true number of extant sponge species (Boury-Esnault, Reference Boury-Esnault2006). Furthermore, the difficulty in establishing homologies among skeletal elements and their organization hinders the comprehension of evolutionary relationships among sponge taxa, especially among sibling and cryptic species (Boury-Esnault et al., Reference Boury-Esnault, Hajdu, Klautau, Custódio and Borojevic1994; Klautau et al., Reference Klautau, Solé-Cava and Borojevic1994; Wulff, Reference Wulff2006).
For many marine invertebrates, like crustaceans (Groeneveld et al., Reference Groeneveld, Gopal, George and Matthee2007; Palero et al., Reference Palero, Abello, Macpherson, Gristina and Pascual2008), molluscs (Imron et al., Reference Imron, Jeffrey, Hale, Degnan and Degnan2007; Baker et al., Reference Baker, Austin, Bowen and Baker2008; Polson et al., Reference Polson, Hewson, Eernisse, Baker and Zacherl2009), annelids (Wiklund et al., Reference Wiklund, Glover, Johannessen and Dahlgren2009) and echinoderms (Muths et al., Reference Muths, Jollivet, Gentil and Davoult2009; Owen et al., Reference Owen, Messing, Rouse and Shivji2009) mitochondrial DNA (mtDNA) has proved to be an excellent marker for studies of population genetic structure, dispersal and historical biogeography (Avise, Reference Avise1986). Indeed, mtDNA presents a number of theoretical and practical advantages over nuclear DNA for phylogeography, since, in addition to its high rate of evolution, it is maternally inherited avoiding, thus, problems related to recombination, and has coalescent times three-times shorter than those of nuclear markers (Hare, Reference Hare2001).
However, for basal metazoans, such as sponges and cnidarians, it has been shown that the evolutionary rate of mtDNA can be 10 to 20 times lower than that of the Bilateria (Shearer et al., Reference Shearer, Van Oppen, Romano and Wörheide2002; van Oppen et al., Reference van Oppen, Wörheide, Takabayashi, Moosa, Soemodihardjo, Soegiarto, Romimohtarto, Nontji, Soekarno and Suharsono2002; Duran et al., Reference Duran, Pascual and Turon2004a; Wörheide, Reference Wörheide2006). The reported lack of intra-specific variation of mtDNA in sponges and cnidarians led van Oppen and colleagues (Reference van Oppen, Wörheide, Takabayashi, Moosa, Soemodihardjo, Soegiarto, Romimohtarto, Nontji, Soekarno and Suharsono2002) to advise against its use for studies at low taxonomic levels. Most studies that showed the conservativeness of mtDNA in sponges have used part of the cytochrome oxidase 1 (CO1) gene (Duran et al., Reference Duran, Pascual and Turon2004a; Wörheide, Reference Wörheide2006). The conservative features of the CO1 gene in sponges can be evidenced by its use at higher taxonomic level studies, such as relationships among genera (Heim et al., Reference Heim, Nickel and Brümmer2007), families (Erpenbeck et al., Reference Erpenbeck, Breeuwer, van der Velde and van Soest2002; Addis & Peterson, Reference Addis and Peterson2005; Itskovich et al., Reference Itskovich, Belikov, Efremova, Masuda, Krasko, Schröder and Müller2006) and even orders (Nichols, Reference Nichols2005; Erpenbeck et al., Reference Erpenbeck, Duran, Rutzler, Paul, Hooper and Wörheide2007). The I3M11 partition has been suggested as an alternative to the more commonly used 5′ partition CO1, because it has a lower transition/transversion ratio in the third position of codons (Erpenbeck et al., Reference Erpenbeck, Hooper and Wörheide2006). Levels of nucleotide diversity (π) for this marker in 7 populations of Xestospongia muta (4 haplotypes; π = 0.00386) were higher than those found for the 5′ partition (π = 0.00058) (López-Legentil & Pawlik, Reference López-Legentil and Pawlik2009) widely applied in metazoan population studies. Sequences of the mitochondrial NADH dehydrogenase subunit 5 (ND5) have also been analysed for population studies of the sponge Hymeniacidon synapium, but only two haplotypes were found in 18 localities around Japan and South Korea (Hoshino et al., Reference Hoshino, Saito and Fujita2008).
Due to the paucity of molecular markers at lower taxonomic levels, most alpha taxonomy, population genetics and phylogeography studies of sponges have been limited to allozymes, which present high levels of polymorphism (Solé-Cava & Thorpe, Reference Solé-Cava and Thorpe1989). Allozymes are ubiquitous and codominant, making them powerful tools for the detection of reproductive isolation in sympatry and, hence, very useful in alpha-taxonomy (Davis et al., Reference Davis, Ayre, Billingham, Styan and White1996; Solé-Cava & Boury-Esnault, Reference Solé-Cava and Boury-Esnault1999). However, the study of sponge allozymes is limited by the requirement of fresh or frozen samples (Boury-Esnault & Solé-Cava, Reference Boury-Esnault and Solé-Cava2004). Ribosomal spacers have also been used (Wörheide et al., Reference Wörheide, Hooper and Degnan2002, Reference Wörheide, Epp and Macis2008), but their utility is hampered in many sponge species by high intragenomic variability (Wörheide et al., Reference Wörheide, Nichols and Goldberg2004; Alvarez et al., Reference Alvarez, Krishnan and Gibb2007). Microsatellites are good markers for sponge population genetics and molecular ecology (Duran et al., Reference Duran, Pascual, Estoup and Turon2004b; Blanquer et al., Reference Blanquer, Uriz and Caujape-Castells2009; Noyer et al., Reference Noyer, Agell, Pascual and Becerro2009), but their low taxonomic ubiquity means that species-specific markers must be developed de novo for each species. Thus, there is currently much interest in the development of new polymorphic mitochondrial markers for sponge systematics, phylogeography and population genetics (Erpenbeck et al., Reference Erpenbeck, Duran, Rutzler, Paul, Hooper and Wörheide2007; Hoshino et al., Reference Hoshino, Saito and Fujita2008). In this paper, we describe new primer systems for the amplification and sequencing of four new mitochondrial polymorphic markers in nine species from a wide taxonomic range of demosponges.
MATERIALS AND METHODS
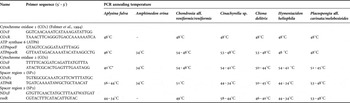
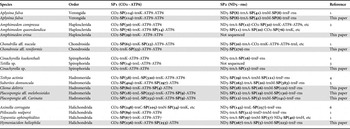
The target fragments were chosen after aligning all available sponge mitochondrial genomes using CLUSTALW2 (http://www.ebi.ac.uk/Tools/clustalw2/index.html) (Larkin et al., Reference Larkin, Blackshields, Brown, Chenna, McGettigan, McWilliam, Valentin, Wallace, Wilm, Lopez, Thompson, Gibson and Higgins2007). Based on the aligned mitochondrial DNA sequences, four pairs of primers were designed in conserved regions that flanked variable regions (Table 1). Two of those markers include genes and intergenic regions (Table 2), whereas the other two markers amplify partial sequences of the ATP synthase 6 (ATP6) and the cytochrome oxidase 2 (CO2) genes. To compare the variability levels of the four new markers, part of the CO1 gene was amplified using a universal pair of primers (Folmer et al., Reference Folmer, Black, Hoeh, Lutz and Vrijenhoek1994).
Primer sequences and annealing temperature of the markers and sponge species tested. * In the case of Aplysina fulva the reverse primer used was CO2aplyR: ACTAAMACTCGCACTTGGGTTTG.

Order of the genes and spacer regions from the analysed species. For comparison we present literature data from sponges from the same orders. Inside the parentheses are the numbers of base pairs (bp). References: 1, Lavrov et al. (Reference Lavrov, Wang and Kelly2008); 2, Wang & Lavrov (Reference Wang and Lavrov2008); 3, Watkins & Beckenbach (Reference Watkins and Beckenbach1999); 4, Lavrov et al. (Reference Lavrov, Forget, Kelly and Lang2005); 5, Lukic-Bilela et al. (Reference Lukic-Bilela, Brandt, Pojskic, Wiens, Gamulin and Müller2008); 6, Lavrov & Lang (Reference Lavrov and Lang2005).

The primers were tested in nine sponge species that encompass six orders of the class Demospongiae (Table 1). Whenever possible, samples from two populations per species were used to determine the level of variability for population genetics studies. This study also includes two species of the genera Placospongia and Chondrosia, to estimate levels of inter-specific variability.
The analysed sponge samples cover a wide range of sponge orders and geographical locations. Chondrosia aff. reniformis were collected in the south-west Atlantic (Arraial do Cabo—south-east Brazil and Guarajuba—north-east Brazil) and in the north-west Atlantic (Bermuda); Chondrosia reniformis are from the western Mediterranean Sea (Marseille, France) Placospongia aff. carinata are from the south-west Atlantic (Calheta and Ponta dos Seixas, both in north-east Brazil) and the Atlantic (Bocas del Toro) and Pacific (Galleta) coasts of Panama; Placospongia aff. melobesioides are from the south-west Atlantic (Guarajuba and Calheta, both in north-east Brazil); Cliona delitrix are from the north-west and south-west Atlantic (Lee Stocking Island, the Bahamas and the Abrolhos reefs—north-east Brazil); Cinachyrella sp. are from Atlantic Panama (Bocas del Toro) and the south-west Atlantic (Ponta dos Seixas and Pontal do Maracaípe—north-east Brazil); Aplysina fulva are from Atlantic Panama (Bocas del Toro); Hymeniacidon heliophila are from the south-west Atlantic (Rio de Janeiro—south-east Brazil); and Amphimedon erina are from the south-west Atlantic (Ponta dos Seixas—north-east Brazil).
The genomic DNA was obtained from sponge pieces smaller than 0.5 cm3 by lysing the tissue overnight in a guanidine solution (4 M guanidine hydrochloride, 50 mM Tris HCl pH 8.0, 0.05 M EDTA, 0.5% sodium-N′-lauroylsarcosine and 1% ß-mercaptoethanol) (Lôbo-Hajdu et al., Reference Lôbo-Hajdu, Guimarães, Mendes, Lamarão, Vieiralves, Mansure and Albano2004) with proteinase K at 55°C, followed by a phenol–chloroform extraction. Amplification reactions were performed in a 15 µl volume, containing 1 µl (90 ng) of genomic DNA, 1.5 mM MgCl2, 200 µM of dNTP mix, 0.5 µM of each primer and 1 U of Taq DNA polymerase. Cycling conditions for CO1 started with an initial cycle at 94°C for 3 minutes, followed by 35 cycles of denaturing at 93°C for 1 minute, annealing at 48°C for 1 minute and extension at 72°C for 1 minute, and one final extension step at 72°C for 4 minutes. For all other DNA markers, the polymerase chain reaction (PCR) conditions followed cycles similar to those used for CO1, however, a touchdown PCR was performed in which the annealing temperature was decreased by 1°C during each of the first 6 cycles, followed by 29 cycles with the lower annealing temperature, as shown in Table 1.
The PCR products were visualized on 1.5% agarose gels, purified using ExoSap-IT (USB Corporation, Cleveland, OH, USA) or QIAquick PCR Purification Kits (QIAGEN) and sequenced for both the forward and reverse strands using ABI Big Dye chemistry on an ABI 3130 DNA sequencer (Applied Biosystems, Foster City, CA, USA). All sequences were edited using the SEQMANII software program (DNASTAR, Inc.) and aligned in ClustalX with the Mega 4 software (Tamura et al., Reference Tamura, Dudley, Nei and Kumar2007). The aligned sequences were meticulously inspected and edited when necessary. Nucleotide (π) and haplotype (h) diversities and Jukes–Cantor DNA divergence between congeneric species of Placospongia and Chondrosia were estimated using DnaSP 5.10 (Librado & Rozas, Reference Librado and Rozas2009). Hairpin-forming elements have been reported within mitochondrial spacers of some demosponges, and their repetitive nature makes them a potential source of noise in evolutionary analyses (Erpenbeck et al., Reference Erpenbeck, Voigt, Wörheide and Lavrov2009). Thus, the presence of repetitive sequences in intergenic regions was checked using the Tandem Repeat Finder 4.00 program (Benson, Reference Benson1999).
RESULTS
Optimal temperatures for PCR amplification were established for the four new pairs of primers (Table 1). The SP2 primer system did not result in the amplification of any fragment in Amphimedon erina, but that was expected, considering that Haplosclerida present a gene order different from that of the other sponges tested (Wang & Lavrov, Reference Wang and Lavrov2008).
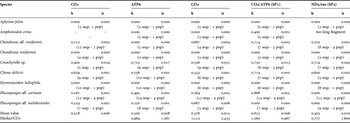
The highest value of nucleotide diversity was 0.042 in Cinachyrella sp. for the SP2 marker, and the highest value of haplotype diversity was 0.933 in Chondrosia aff. reniformis with the SP1 marker (Table 3). Interestingly, no variation was observed in any of the markers of Aplysina fulva, Hymeniacidon heliophila or Chondrosia reniformis (Table 3).
Haplotype (h) and nucleotide (π) diversity of each species for each marker. The number of sequences and populations used in the analyses are presented below the diversity indices. Mean diversity values exclude the potentially clonal populations of Chondrosia aff. reniformis, Aplysina fulva and Hymeniacidon heliophila. The ratio between variabilities of the new markers and those of CO1 were calculated over the loci that were sequenced for each species. “–”, did not amplify; seqs, sequences; pop, population.

The new markers were more polymorphic than CO1 in all species where any polymorphism was detected (Table 3). In some extreme cases, like CO2 in Placospongia aff. melobesioides, the new marker presented a nucleotide diversity six times higher than that observed with CO1 (Table 3).
Levels of gene divergence between the two species of Placospongia and Chondrosia were also higher for the new markers than for CO1 (mean Jukes–Cantor p = 0.0982 against p = 0.0149 for CO1 for Placospongia and mean Jukes–Cantor p = 0.0476 against p = 0.0431 for CO1 for Chondrosia). The comparisons between the species of Placospongia resulted in mean values of p = 0.020 (CO2); 0.065 (ATP6); 0.058 (SP1); 0.066 (SP2) and, for Chondrosia spp., mean p = 0.056 (CO2); 0.039 (ATP6); 0.059 (SP1); 0.036 (SP2).
Finally, repetitive hairpin-forming motifs were observed only in Chondrosia aff. reniformis, which presented two small (twelve-nucleotide stems) hairpins in the SP2 fragment.
DISCUSSION
This study describes four new polymorphic mitochondrial markers, which will provide evolutionary ecologists with the needed tools for studies of sponge alpha taxonomy, phylogeography and population genetics.
Additionally, this study contradicts previous suggestions on the high conservativeness of the sponge mitochondrial genome (van Oppen et al., Reference van Oppen, Wörheide, Takabayashi, Moosa, Soemodihardjo, Soegiarto, Romimohtarto, Nontji, Soekarno and Suharsono2002) and, as predicted by some researchers (Wörheide et al., Reference Wörheide, Solé-Cava and Hooper2005, Wang & Lavrov, Reference Wang and Lavrov2008), confirms that the sponge mtDNA contains regions variable enough for analyses at the population and alpha taxonomy levels. For example, the new mitochondrial markers were over two times more divergent than CO1 between congeneric species of Placospongia. Also, the observed relationship between inter- and intra-specific differentiation was about 2.3 times higher for the new markers than in CO1 (mean Jukes–Cantor pinter/pintra = 45.1 and 18.8, respectively), which indicates that they will be less restrained than CO1 (Shearer et al., Reference Shearer, Van Oppen, Romano and Wörheide2002) for studies of alpha-level sponge systematics.
In a few cases, CO1 has been shown to be useful for population genetics and detection of cryptic species, like in the study of Callyspongia vaginalis along the Florida reef tract (DeBiasse et al., Reference DeBiasse, Richards and Shivji2010) and in the finding of cryptic species of Cliona celata (Xavier et al., Reference Xavier, Rachello-Dolmen, Parra-Velandia, Schönberg, Breeuwer and van Soest2010). In both cases, levels of nucleotide diversity were similar to those found with the new markers (π from 0.001 to 0.042; Table 3).
The CO2 fragment was not amplified in Aplysina fulva (Table 3), even after exhaustive tests with different annealing temperatures and PCR-reagent concentrations. An analysis of the published sequence of the CO2 gene in Aplysina fulva showed that the reverse primer annealing site, which is conserved across other sponge orders, has five nucleotide differences which were probably responsible for the failed amplifications. Thus, we designed a new reverse primer which produced two sequences of CO2 with approximately 800 and 400 base pairs. The latter was used in the analyses because it has the expected size and produced the most reliable sequences. The same difficulty in amplification was observed for CO1, which failed to amplify in Amphimedon erina over a wide range of experimental conditions (Table 1). Since CO1 was not the aim of this work, we did not further pursue this matter.
The lack of sequence variation in any of the analysed markers in Chondrosia reniformis, Hymeniacidon heliophila and in Aplysina fulva is more likely the result of the analysis of clone-mates, since those three species are known to reproduce asexually, sometimes quite extensively (Stone, Reference Stone1970; Wulff, Reference Wulff1991; Tsurumi & Reiswig, Reference Tsurumi and Reiswig1997; Bavestrello et al., Reference Bavestrello, Benatti, Calcinai, Cattaneo-Vietti, Cerrano, Favre, Giovine, Lanza, Pronzato and Sarà1998). Although intra-population variability was observed in all other species analysed, it is noteworthy that for these three species we had samples from only one locality. It would be interesting to confirm the hypothesis of extensive clonality in these three species using hyper-variable markers, like microsatellites.
Recent data demonstrate that intergenic regions may have repetitive hairpin-forming elements that can lead to misleading phylogenetic signals due to independent origins and evolution (Erpenbeck et al., Reference Erpenbeck, Voigt, Wörheide and Lavrov2009). No hairpin-forming repetitive sequences were found for the intergenic region SP1 in any of the analysed sponges. In Chondrosia aff. reniformis, two small (twelve-nucleotide stems) hairpins were found in SP2. The repeat was not found in any of the other tested species, including the congeneric Chondrosia reniformis. In spite of their low frequency, repetitive sequences should be searched for whenever intergenic spacers are analysed.
Applying a large array of molecular markers is desirable for phylogeography and molecular systematics analyses (Beheregaray, Reference Beheregaray2008). The four new markers described here amplified efficiently and were more variable than CO1 in the polymorphic sponges tested (Table 3). Therefore, they will be useful to complement the markers available for sponge studies. This will help in overcoming typical problems linked to the use of single markers for population genetics, such as the presence of pseudogenes and other sources of homoplasy. More importantly, the use of genes with different evolutionary rates will help to circumvent the pitfalls of using single-gene trees, which tell a limited story of the species, to draw general conclusions in systematics and phylogeography (Solé-Cava & Wörheide, Reference Solé-Cava, Wörheide, Custódio, Lôbo-Hajdu, Hajdu and Muricy2007).
ACKNOWLEDGEMENTS
The authors thank Dr Claudia Russo for the collection of the Bermuda samples, Dr Nancy Knowlton for logistic support during the collections in Panama, and Dr Janie Wulff for taxonomic identification of samples of Amphimedon erina. This manuscript was submitted as partial fulfilment of the PhD degree to C.P.J. Rua at the Universidade Federal do Rio de Janeiro, Brazil. This work was supported by grants from Conselho Nacional de Desenvolvimento Científico e Tecnológico (CNPq) and Fundação de Amparo à Pesquisa do Estado do Rio de Janeiro (FAPERJ) (Brazil).