




Non-technical Summary
Signs of disease and trauma as well as tooth marks observed on fossil bones have long been used for behavioral interpretations of extinct organisms, including dinosaurs. However, our understanding of this behavior is limited by the rarity of large-scale surveys of fossils. Here, we present a systematic survey of tooth marks across 148 duck-billed dinosaur (Hadrosauridae) cheek bones (jugals) from various Late Cretaceous formations of Alberta, Canada. Across 20 of the elements (13.6%), we observed 48 tooth marks, restricted to the outer surface, 40% of which were located on the middle jugal body and showed no preferred orientation of the mark long axis. Tooth marks are most common on isolated specimens, followed by specimens from bonebeds, with few articulated/semi-articulated/associated skulls showing marks. The proportion of tooth-marked to non-tooth-marked jugals is comparable to the proportion of marked and un-marked elements observed for modern mammalian carnivores. Although tooth marks were likely produced during feeding after the animal’s death, it is unclear whether tooth marks were produced when the jugal was removed to access underlying jaw-closing muscles, during the removal of tissues around the jaw, or a combination of these behaviors. Future large-scale surveys of duck-billed dinosaur skull elements could help clarify which of these explanations is more likely and clarify Cretaceous carnivore carcass-processing behaviors. Our survey also identified an additional two specimens showing elongate healed marks extending front to back across the outer surface of the jugal body that are of unknown, but potentially the same, origin. Further specimens with similar paleopathologies could help narrow a possible cause of injury.
Introduction
Alterations made to bone from diseases and traumatic injuries, including those from suspected intra- and inter-specific interactions, provide a wealth of information regarding the behavior of extinct organisms and have received considerable attention for non-avian dinosaurs. Paleopathologies, marked by calluses or remodeled bone textures concentrated in a particular region of a bone or skeleton, provide evidence of healing following an injury severe enough to leave evidence on the skeleton (e.g., Carpenter, Reference Carpenter1998; Tanke and Rothschild, Reference Tanke and Rothschild2002; Farke et al., Reference Farke, Wolff and Tanke2009; Bell and Currie, Reference Bell and Currie2010; Peterson et al., Reference Peterson, Dischler and Longrich2013; Siviero et al., Reference Siviero, Rega, Hayes, Cooper, Brand and Chadwick2020; Bertozzo et al., Reference Bertozzo, Manucci, Dempsey, Tanke, Evans, Ruffell and Murphy2021, Reference Bertozzo, Tanke, Conti, Manucci and Arnott2025; Brown et al., Reference Brown, Currie and Therrien2022; Tumanova et al., Reference Tumanova, Penkalski, Gallagher, Engiles and Dodson2025). Tooth marks, produced when a tooth contacts bone, can record evidence of feeding/scavenging or possible hunting behaviors of carnivorous animals (e.g., Currie and Jacobsen, Reference Currie and Jacobsen1995; Erickson and Olson, Reference Erickson and Olson1996; Carpenter, Reference Carpenter1998; Jacobsen, Reference Jacobsen1998; Fowler and Sullivan, Reference Fowler and Sullivan2006; Hone and Watabe, Reference Hone and Watabe2010; Murphy et al., Reference Murphy, Carpenter, Trexler, Parrish, Molnar, Currie and Koppelhus2013; Hone et al., Reference Hone, Tanke and Brown2018; Peterson and Daus, Reference Peterson and Daus2019; Drumheller et al., Reference Drumheller, McHugh, Kane, Riedel and D’Amore2020; Brown et al., Reference Brown, Tanke and Hone2021, Wyenberg-Henzler and Scannella, Reference Wyenberg-Henzler and Scannella2026) or possible evidence of intraspecific agonism (Tanke and Currie, Reference Tanke and Currie2000; Bell and Currie, Reference Bell and Currie2010; Brown et al., Reference Brown, Currie and Therrien2022). In some cases, tooth marks can show signs of healing, indicating the affected animal survived the altercation long enough to heal, with these marks therefore considered paleopathological as opposed to taphonomic (e.g., Carpenter, Reference Carpenter1998; Bell and Currie, Reference Bell and Currie2010; Brown et al., Reference Brown, Currie and Therrien2022; Garcia et al., Reference Garcia, Martínez and Müller2025). By contrast, most tooth marks lack any evidence of healing, which makes it difficult to determine with any level of certainty whether these tooth marks were produced peri- or post-mortem (e.g., Currie and Jacobsen, Reference Currie and Jacobsen1995; Chure et al., Reference Chure, Fiorillo and Jacobsen1998; Jacobsen, Reference Jacobsen1998; Hone and Tanke, Reference Hone and Tanke2015; Hone et al., Reference Hone, Tanke and Brown2018; Peterson and Daus, Reference Peterson and Daus2019; Drumheller et al., Reference Drumheller, McHugh, Kane, Riedel and D’Amore2020, Reference Drumheller, Boyd, Barnes and Householder2022; Brown et al., Reference Brown, Tanke and Hone2021; Lei et al., Reference Lei, Tschopp, Hendrickx, Wedel, Norell and Hone2023 but see Wyenberg-Henzler and Scannella, Reference Wyenberg-Henzler and Scannella2026), with these tooth marks considered feeding traces. Our understanding of behaviors leading to the occurrence of paleopathologies and non-pathological tooth marks (herein simply “tooth marks”) is also limited by the rarity of large-scale surveys of recovered material (but see Jacobsen, Reference Jacobsen1998; Drumheller et al., Reference Drumheller, McHugh, Kane, Riedel and D’Amore2020; Siviero et al., Reference Siviero, Rega, Hayes, Cooper, Brand and Chadwick2020; Lei et al., Reference Lei, Tschopp, Hendrickx, Wedel, Norell and Hone2023; Bertozzo et al., Reference Bertozzo, Tanke, Conti, Manucci and Arnott2025; McHugh and Drumheller, Reference McHugh and Drumheller2026). Although individual-specimen-based case studies can be important, particularly if a specimen preserves evidence for a rare or novel behavior (e.g., Erickson and Olson, Reference Erickson and Olson1996; Bertozzo et al., Reference Bertozzo, Manucci, Dempsey, Tanke, Evans, Ruffell and Murphy2021; Brown et al., Reference Brown, Tanke and Hone2021; Wyenberg-Henzler and Scannella, Reference Wyenberg-Henzler and Scannella2026), these instances cannot provide answers to large-scale questions around how frequent a particular behavior occured or whether it is representative of behaviors that occurred across many individuals at the population or species level. Systematic surveys to document the relative proportions and nature of tooth-marked, paleopathological, and unmodified elements can potentially aid in answering these large-scale questions. To contribute to this process, we present a systematic survey documenting the nature and frequency of tooth marks and paleopathologies across hadrosaurid jugals from the Late Cretaceous of Alberta.
Materials and methods
Hadrosaur jugals (Fig. 1) were selected for this survey for several reasons. Hadrosaur bones, whether isolated or part of an associated/articulated skeleton, are some of the most common elements in many Late Cretaceous North American formations in Alberta (Foremost, Oldman, Dinosaur Park, Bearpaw, Horseshoe Canyon, and Wapiti formations), allowing a large sample size to be studied (Béland and Russell, Reference Béland and Russell1978; Currie and Russell, Reference Currie, Russell, Currie and Koppelhus2005). The hadrosaur jugal is relatively large, easily identified, and diagnostic to Hadrosauridae, with additional diagnostic utility to lower taxonomic levels (Godefroit et al., Reference Godefroit, Bolotsky and Alifanov2003; Prieto-Márquez, Reference Prieto-Márquez2010, Reference Prieto-Márquez2012; Brink et al., Reference Brink, Zelenitsky, Evans, Therrien and Horner2011; Farke et al., Reference Farke, Chok, Herrero, Scolieri and Werning2013; Xing et al., Reference Xing, Mallon and Currie2017). Limited representation in the skeleton (i.e., one per side) removes complications of possible pseudoreplication caused by a single individual with multiple modifications in adjacent (or what were adjacent) elements, as seen in vertebrae or ribs.
Line drawings showing positioning of jugals on lambeosaurine (top) and saurolophine (bottom) skulls and relative to the eye and major jaw adductor muscles. Line drawing for lambeosaurine is based on ROM 871 (Corythosaurus casuarius Brown, Reference Brown1914) redrawn from Evans (Reference Evans2010). Line drawing for saurolophine is based on ROM 873 (Gryposaurus notabilis Lambe, Reference Lambe1914) redrawn from Gates and Sampson (Reference Gates and Sampson2007).

Figure 1. Long description
A two-panel anatomical line drawing.
Top panel: A Corythosaurus casuarius skull shown in lateral view. The skull features a high, rounded cranial crest. The eye is represented by a solid black circle. Below and slightly behind the eye is the jugal bone, shaded in dark gray. The jugal has a distinct four-pronged shape. Overlapping the jugal and extending toward the back of the skull is a large, pink-shaded muscle mass representing the jaw adductors. A second pink-shaded muscle region extends downward from the lower edge of the jugal toward the jawline.
Bottom panel: A Gryposaurus notabilis skull shown in lateral view. This skull is longer and lower than the first, lacking the high crest but featuring a prominent nasal arch. The eye is again a solid black circle. The dark gray jugal bone is positioned similarly below the eye but appears more elongated horizontally compared to the top panel. The pink-shaded jaw adductor muscles are larger and more vertically oriented, covering a greater portion of the posterior jugal and the back of the skull.
In both drawings, dotted lines indicate where muscles pass behind or attach to the bone structures, illustrating the mechanical relationship between the jugal and the primary chewing muscles.
Finally, one major consideration of a systematic survey surrounds potential collection and preservational biases that could falsely inflate the rate of modification of elements recorded (Drumheller et al., Reference Drumheller, McHugh, Kane, Riedel and D’Amore2020; McHugh et al., Reference McHugh, Drumheller, Riedel and Kane2020, Reference McHugh, Drumheller, Kane, Riedel and Nestler2023). Because only jugals were considered in the sample, the preservational potential of each element is approximately equal as the general dimensions of each element at the beginning of the fossilization process are essentially identical. Collection biases (i.e., preferential collection of tooth-marked bone that would otherwise not be collected) are also unlikely to have a large influence on this survey given that hadrosaur jugals (as with many cranial elements) are nearly always collected when found, even if they are fragmentary, given their potential diagnostic value.
Data collection and documentation
Hadrosaurid jugal specimens reposited at the University of Alberta Laboratory for Vertebrate Paleontology (UALVP) and Royal Tyrrell Museum of Palaeontology (TMP) were systematically surveyed for tooth marks and paleopathologies (Supplementary Table 1). The sample encompassed a wide range of taphonomic modes, including isolated bones, disarticulated bones as part of both bonebed and associated skeletons, and articulated skulls/skeletons. For isolated or disarticulated jugals, all surfaces were visually surveyed for modification at the macroscopic scale with light directed across the surface at various angles. For articulated skulls, a similar approach was used except that the medial (internal) surface of the jugal could not be observed. Jugals with potential modifications were photographed using a Canon EOS 6D Mark II digital SLR camera using a 24–105 mm lens and the camera on a Samsung Galaxy S21 5G. Low-angle lighting was used to accentuate the bone surface topography, including tooth marks (Blumenschine et al., Reference Blumenschine, Marean and Capaldo1996). For some specimens, ammonium chloride powder coating was used, following the “dry method” sensu Parsley and colleagues (Reference Parsley, Lawson and Pojeta2018), to enhance the surface texture while homogenizing bone color for photography.
If an element was deemed stable enough, potential tooth marks were molded using Smooth-On Dragon Skin 10 Very Fast platinum-cure silicone to accurately capture the three-dimensional nature of the mark. This silicone captures the internal shape and texture of the mark with high fidelity without losing its shape (Smooth-On Inc., 2025). Because the silicone captures tooth-mark depth as a raised surface, it is much easier to measure the tooth-mark depth from the silicone than it is from the original bone, especially when the tooth mark is especially narrow. These silicone peels are accessioned at the institutions of their respective specimens (Supplementary Table 2). Tooth marks were described and measured according to the category-modifier (CM) system (Wyenberg-Henzler et al., Reference Wyenberg-Henzler, Fowler, Currie and Sullivan2024) as this is the most up-to-date classification system available for vertebrate tooth marks and aims to unify mark terminological schemes across fields by building on the work of Binford (Reference Binford1981) and other subsequently derived mark categorization schemes (e.g., Jacobsen, Reference Jacobsen1998; Fowler and Sullivan, Reference Fowler and Sullivan2006; Njau and Blumenschine, Reference Njau and Blumenschine2006; D’Amore and Blumenschine, Reference D’Amore and Blumenschine2009, Reference D’Amore and Blumenschine2012; Hone and Watabe, Reference Hone and Watabe2010; Drumheller and Brochu, Reference Drumheller and Brochu2014; Njau and Gilbert, Reference Njau and Gilbert2016). Although ichnotaxonomic frameworks exist (e.g., LaBarge and Njau, Reference LaBarge and Njau2024), our use of the taphonomically based CM system follows the recommendations of Zonneveld et al. (Reference Zonneveld, Fiorillo, Hasiotis and Gingras2022) as it most closely aligns with the majority of schemes previously implemented in the literature.
Paleopathologies were also measured and categorized following the CM system for consistency and more direct comparison with non-pathological modifications. The key difference in our treatment of paleopathologies and tooth marks was in the textural modifiers assigned. Given reactive bone textures often obscure or even obliterate the original textures of the injury, both edge and internal modifiers were recorded as “healing” for the purposes of our survey. Using a ruler, measurements were taken to the nearest millimeter and visually estimated using this ruler to the nearest 0.1 mm. Measurements and descriptive modifiers for these features are available in Supplementary Table 3, and corresponding line drawings for corresponding elements are provided in Supplementary Figures 1, 2.
To document the placement of these various features, photographs of elements were imported and outlined in the free software Inkscape (v. 2.0) to produce a schematic line drawing (a “mark map”) for each specimen. Individual line drawings for each specimen (available in Supplementary Fig. 1) were then isometrically scaled, rotated, and/or reflected to overlie on top of one another to produce a composite mark map (standardized to left lateral view) for all modified elements in the dataset that will highlight overall mark pattern, such as regions with more frequent modification or consistent orientations.
Analytical investigations
All plots and statistical analyses were conducted in R (v. 4.5.1) (R Core Team, 2024) (Supplementary code). The long-axis orientation of elongate tooth marks and paleopathologies was measured in Fiji (Schindelin et al., Reference Schindelin, Arganda-Carreras, Frise, Kaynig and Longair2012) and standardized so that all angles were relative to the dorsoventral axis of the lateral surface of a left jugal (i.e., with dorsal = 0°, posterior = 90°, ventral = 180°, anterior = 270°). Modifications on right jugals were mirrored to match the orientations of those observed on left jugals for comparability purposes. Because it is extremely difficult to determine which end of the tooth mark is the initiation versus termination point, and elongate paleopathologies may not necessarily have an initiation and termination point, we chose to display the orientation for each mark as apolar (i.e., between 0° and 180° and the equivalent angle between 180° and 360°).
Dimensions of different features were compared using a permuted t-test and follow-up pairwise comparisons using the “perm.t.test” function from the RVAideMemoire package (Herve, Reference Herve2025) with the number of permutations for each test set to 999. The Holm correction method was used to correct the p-values returned from follow-up pairwise tests to adjust for multiple comparisons.
To investigate overall modification rate, we documented all specimens that were examined, not just those for which tooth marks or paleopathologies were observed (Supplementary Table 1). To see how different factors might impact the rate of modification, we also recorded information such as preservation mode (isolated, bonebed, associated/articulated/semi-articulated), level of element completeness (fragmentary, partial, mostly complete/complete), and geological formation of origin. Level of element completeness was assigned visually. Elements were considered mostly complete or complete if ~75% or more of the element was preserved, consisting of most of the jugal body and approximately half of the postorbital process. If 40–75% of an element was preserved (e.g., large part of the jugal body but lacking the postorbital process), it was considered partial. Fragmentary elements were less than 40% complete. A series of chi-squared tests were then conducted to determine whether there was a significantly different proportion of modified to unmodified elements across the entire sample, for elements collected from the same lithological unit, for elements of varying levels of completeness, and for elements preserved under different conditions or taphonomic mode (i.e., bonebed, associated/articulated/semi-articulated, isolated). A chi-squared test was also used to investigate whether the number of modified elements significantly differed by condition of preservation. To see whether one side of the face was more heavily tooth marked than the other, we also compared the proportion of tooth-marked elements observed on the right versus left side of the face by conducting a chi-squared test on the proportion of tooth-marked jugals from the left and right sides (i.e., using the number of tooth-marked left jugals/number of left jugals examined and the number of tooth-marked right jugals/number of right jugals examined). We do not apply corrections to the results of our chi-squared tests as these analyses are assessing two separate parameters. Although the jugal does have some utility at taxonomic scales finer that Hadrosauridae (Godefroit et al., Reference Godefroit, Bolotsky and Alifanov2003; Prieto-Márquez, Reference Prieto-Márquez2010, Reference Prieto-Márquez2012; Brink et al., Reference Brink, Zelenitsky, Evans, Therrien and Horner2011; Farke et al., Reference Farke, Chok, Herrero, Scolieri and Werning2013; Xing et al., Reference Xing, Mallon and Currie2017), most of the isolated specimens were not identified beyond Hadrosauridae, limiting taxonomic comparisons.
Repositories and institutional abbreviations
Specimens figured and examined in this study are reposited in the following institutions: Field Museum of Natural History (FMNH), Chicago, USA; Royal Ontario Museum (ROM), Toronto, Canada; Royal Tyrrell Museum of Palaeontology (TMP), Drumheller, Canada; University of Alberta Laboratory for Vertebrate Paleontology (UALVP), Edmonton, Canada.
Results
Modification rate and general distribution
Of the 147 jugals examined, a total of 51 marks were observed over 21 elements from various formations across the Late Cretaceous of Canada (Supplementary Table 1). Of the 51 features observed, 48 are unhealed tooth marks (i.e., feeding traces) distributed across 21 elements, and three are paleopathologic marks—showing evidence of active healing—distributed across two elements (TMP 1999.055.0133 and UALVP 61095). The overall frequency of tooth marks on hadrosaur jugals in the sample is 13.6%, whereas the frequency for pathology is 1.4%. Usually, elements exhibit only one type of modification, either pathologic marks or tooth marks, except for UALVP 61095, which preserves both tooth marks and pathologic marks. Of the number of modified elements observed, 11 elements (55%) preserved only one paleopathologic mark or tooth mark whereas 10 elements (50%) preserved more than one paleopathologic and/or tooth mark. Tooth marks were observed on both the jugal body and the postorbital process. Conversely, paleopathologic marks were observed only on the body of the jugal and extended along most of the length of the jugal body (Figs. 2, 3).
Numbers of different modification types per element across different categories for jugal dataset. (1) Number of different modification types per element in general and across different regions of the jugal. (2) Number of unhealed tooth marks per element across specific regions of the jugal. (3) Number of unhealed tooth marks between elements of varying levels of completeness. Dark blue diamonds represent the average number of modifications per element for each category. “Ne =” denotes the number of elements with marks contributing to a given diagram.

Figure 2. Long description
Panel 1 is a multi-column plot with the y-axis labeled number of modifications per element from 0 to 6. It is divided into three sections: jugal, body, and postorbital process. In the jugal section, pathologic modifications Ne equals 2 show a low count around 1.5, whereas tooth marks Ne equals 20 show a range from 1 to 7 with a dark blue diamond average near 2.5. The body section shows similar distributions for pathologic and tooth marks Ne equals 18. The postorbital process section shows only tooth marks Ne equals 5 with an average near 2.5.
Panel 2 shows the number of tooth marks per element across specific jugal regions. From left to right: anterior body N e equals 6 has an average near 1.5; middle body Ne equals 12 has an average near 1.8; posterior body Ne equals 5 has an average near 1.5; and postorbital process Ne equals 5 has an average near 2.5. Data points are shown as red dots with black outlier dots.
Panel 3 shows the number of tooth marks based on element completeness. Fragment Ne equals 5 has the lowest average near 1.5. Partial Ne equals 4 has an average near 2.2. Mostly complete or complete Ne equals 11 has the highest average near 3.0 and the widest range of modifications, reaching up to 7 marks on a single element. Dark blue diamonds indicate the mean for each category across all panels.
Composite mark map for sampled jugal elements in left lateral view with corresponding rose diagrams. Smaller diagram of postorbital process is in left posterolateral view. Rose diagrams have been standardized to left lateral view unless otherwise indicated. In all lateral rose diagrams, anterior = 270° and posterior = 90°; in all posterolateral rose diagrams, lateral = 270° and medial = 90°. “Ne =” denotes the number of elements with marks (denoted with “Nm =”) contributing to a given rose diagram. Mark maps for each element are provided in Supplementary Figure 1 and corresponding measurements in Supplementary Table 3. Line drawing for lambeosaurine skull showing relative orientation of an articulated jugal is based on ROM 871 (Corythosaurus casuarius) redrawn from Evans (Reference Evans2010).

Figure 3. Long description
The diagram is organized into three horizontal sections.
Top Section: Three rose diagrams labeled postorbital process.
* Left: Lateral view, Ne equals 2, Nm equals 3, showing red wedges primarily at 90, 150, and 270 degrees.
* Middle: Posterolateral view, Ne equals 1, Nm equals 7, showing a dominant red wedge spanning 60 to 240 degrees.
* Right: Lateral view, Ne equals 5, Nm equals 6, showing multiple blue wedges distributed around the circle.
Middle Section:
* Left: A rose diagram labeled healing, body. Lateral view, Ne equals 2, Nm equals 3, with purple wedges at 90, 150, and 300 degrees.
* Center: A large line drawing of a left jugal bone in lateral view. It contains color-coded markings: red and pink oval shapes, long purple streaks, and a large light blue shaded area on the dorsal process. A small inset to the left shows a full lambeosaurine skull with the jugal highlighted in gray.
* Legend: Located above the jugal drawing. Red square for tooth mark (definitive), pink square for tooth mark (uncertain), purple square for pathologic, and light blue square for associated damage.
Bottom Section: Three rose diagrams labeled unhealed, body, all in lateral view, connected by lines to specific regions of the jugal drawing.
* Left: Ne equals 5, Nm equals 7, with red wedges concentrated at 150 and 315 degrees.
* Middle: Ne equals 11, Nm equals 16, showing a wide distribution of red and pink wedges, with peaks at 90, 180, and 280 degrees.
* Right: Ne equals 5, Nm equals 7, with red wedges concentrated at 20, 70, and 200 degrees.
All rose diagrams use a circular grid with degree markers from 0 to 360 and concentric rings for frequency counts 1 and 2.
Across all lithological divisions sampled, the proportion of tooth-marked jugals is significantly lower than that of non-tooth-marked jugals (Fig. 4.1; Table 1), varying from a high of 19.4% in the Dinosaur Park Formation and 3.0% in the Horseshoe Canyon Formation to 0% in all remaining formations (but note the sample size in each of these). All but one (19/20) of the tooth-marked jugals derive from the Dinosaur Park Formation.
Bar plots showing the proportion of jugals with tooth marks versus jugals without tooth marks: (1) by lithological unit; (2) by preservation mode; (3) by level of completeness. Bar thickness scaled to sample size for each bin.

Figure 4. Long description
A three-panel set of stacked bar charts. The Y axis for all panels is frequency from 0.0 to 1.0. The legend indicates teal represents tooth marked and salmon represents not tooth marked.
Panel 1, Lithological Unit. The X axis lists units with varying bar widths based on sample size N sub e.
- all (N sub e = 147): 13.6 percent tooth marked, 86.4 percent not tooth marked.
- Milk River (N sub e = 1): 100 percent not tooth marked.
- Belly River Group (N sub e = 107): 17.8 percent tooth marked, 82.2 percent not tooth marked. This group is further subdivided into Foremost (N sub e = 2, 100 percent not tooth marked), Oldman (N sub e = 6, 100 percent not tooth marked), and Dinosaur Park (N sub e = 98, 19.4 percent tooth marked, 80.6 percent not tooth marked).
- Bearpaw (N sub e = 1): 100 percent not tooth marked.
- Horseshoe Canyon (N sub e = 33): 3 percent tooth marked, 97 percent not tooth marked.
- Wapiti (N sub e = 4): 100 percent not tooth marked.
Panel 2, Preservation Mode.
- isolated (N sub e = 72): 23.6 percent tooth marked, 76.4 percent not tooth marked.
- bonebed (N sub e = 27): 7.4 percent tooth marked, 92.6 percent not tooth marked.
- associated/articulated/semi-articulated (N sub e = 42): 2.4 percent tooth marked, 97.6 percent not tooth marked.
Panel 3, Level of Completeness.
- fragment (N sub e = 17): 29.4 percent tooth marked, 70.6 percent not tooth marked.
- partial (N sub e = 49): 10.2 percent tooth marked, 89.8 percent not tooth marked.
- mostly complete/complete (N sub e = 72): 13.9 percent tooth marked, 86.1 percent not tooth marked.
Statistical output of chi-squared tests comparing the number of tooth-marked versus non-tooth-marked jugals across various categories and the number of tooth-marked jugals from different preservation modes

Table 1. Long description
A table presenting statistical outputs for chi-squared tests. The columns are: Number of elements compared, Chi-squared statistic, d f, and p-value.
Section 1: Tooth-marked versus non-tooth-marked.
* General: No = 127, yes = 20. Chi-squared 77.88, d f 1, p-value 1.09 E minus 18.
* Formation - Belly River Group: No = 88, yes = 19. Chi-squared 44.5, d f 1, p-value 2.55 E minus 11.
* Formation - Dinosaur Park: No = 79, yes = 19. Chi-squared 36.73, d f 1, p-value 1.35 E minus 09.
* Formation - Horseshoe Canyon: No = 32, yes = 1. Chi-squared 29.12, d f 1, p-value 6.80 E minus 08.
* Preservation mode - isolated: No = 55, yes = 17. Chi-squared 20.06, d f 1, p-value 7.52 E minus 06.
* Preservation mode - bonebed: No = 25, yes = 2. Chi-squared 19.59, d f 1, p-value 9.58 E minus 06.
* Preservation mode - associated or articulated or semi-articulated: No = 47, yes = 1. Chi-squared 44.08, d f 1, p-value 3.15 E minus 11.
* Level of completeness - fragment: No = 12, yes = 5. Chi-squared 2.88, d f 1, p-value 0.0896.
* Level of completeness - partial: No = 46, yes = 5. Chi-squared 32.96, d f 1, p-value 9.4 E minus 09.
* Level of completeness - mostly complete or complete: No = 66, yes = 10. Chi-squared 41.26, d f 1, p-value 1.33 E minus 10.
Section 2: Tooth marks by Preservation mode.
* Comparison: associated or articulated or semi-articulated = 1, bonebed = 2, isolated = 17. Chi-squared 24.1, d f 2, p-value 5.84 E minus 06.
Note: Significant p-values in bold.
When comparing taphonomic mode, isolated elements have the highest frequency of marks (23.6%), with a lower frequency seen in bonebed specimens (7.4%) and one articulated/semi-articulated/associated specimen (TMP 1998.081.0001) with marks (Fig. 4). Chi-squared tests indicate that the higher proportion of tooth-marked isolated jugals relative to bonebed specimens is statistically significant (Fig. 4.2; Table 1). In all cases, the proportion of tooth-marked jugals is significantly lower than that of non-tooth-marked jugals (Table 1).
Despite more-pronounced differences in tooth-mark frequency across differing taphonomic modes, tooth-mark frequencies across completeness categories are relatively consistent, with fragments showing the higher frequency (29.4%), complete/mostly complete showing a slightly lower frequency (13.9%), and partial specimens showing an even lower frequency (10.2%) (Fig. 4.3). Chi-squared tests indicated significant differences in the proportion of tooth-marked to non-tooth-marked jugals for partial and mostly complete specimens but not for fragmentary specimens (Table 1).
Of the 138 specimens sampled where side information was recorded, tooth marks were observed on six of the 60 left jugals (10%) and 14 of the 78 right jugals (17.9%) examined. Chi-squared tests indicate that there was no statistically significant bias toward either side of the face (Table 2).
Statistical output of chi-squared test comparing the proportion of tooth-marked jugals from the left versus right side of the face

Table 2. Long description
The table consists of four columns.
Column 1, Number of elements compared: 6 tooth-marked of 60 sampled (left) and 14 tooth-marked of 78 sampled (right).
Column 2, Chi-squared statistic: 1.066.
Column 3, d f: 1.
Column 4, p-value: 0.302.
Tooth marks show a range of internal textures as well as both rough- and smooth-edged external textures (sensu Wyenberg-Henzler et al., Reference Wyenberg-Henzler, Fowler, Currie and Sullivan2024; Fig. 5; Supplementary Table 3). Smooth-edged marks (N = 27) are the most common, accounting for 56.3% of the edge textures observed for unhealed tooth marks. Excepting ringed textures, every type of internal modifier as defined under the CM system is observed on jugals. Smooth internal textures, observed for 27 of 48 tooth marks (56.3%), are most associated with smooth-edged textures (N = 22). Chattered (N = 4) and spongy (N = 10) internal textures are observed exclusively with rough-edged textures whereas raked (N = 1) and striated (N = 2) internal textures are observed only with smooth-edged textures (Fig. 5). Of the four marks with mixed internal textures, three are rough-edged and show a transition from smooth to chattered or smooth to striated to spongy textures along their length; the one smooth-edged mark shows a transition from smooth to striated textures along its length.
Close-up images of different tooth marks showing various textures observed on hadrosaurid jugals. (1) Marks 1 and 2 on UALVP 63097 showing rough-edged, internally spongy textures. (2) Marks on TMP 1980.016.1723 showing smooth-edged, internally smooth (marks 1 and 2) and smooth-edged, internally spongy textures (mark 3). (3) Mark 1 on TMP 2009.012.0075 showing rough-edged, internally mixed (smooth, striated, spongy) textures. (4) Mark 1 on TMP 1993.066.0010 showing rough-edged, internally chattered textures. (5) Mark 3 on TMP 1993.066.0010 showing rough-edged, internally spongy textures. (6) Mark 2 on UALVP 61095 showing smooth-edged, raked texture. (7) High-contrast image of posterolateral surface of the postorbital process of UALVP 54667 with very thin marks 4, 5, and 6 showing smooth-edged, internally smooth textures with red arrows indicating mark location. Scale bars = 1 cm. Positionings of tooth marks on corresponding specimens are available in Supplementary Figure 1. (2–6) Specimens were coated with ammonium chloride.

Figure 5. Long description
A multi-panel collection of seven photos showing fossilized bone surfaces. Each panel includes a black or white scale bar representing 1 cm.
* Panel 1: Top row. A wide view of specimen U A L V P 63097 showing two horizontal, rough-edged marks with internally spongy textures crossing vertical cracks in the bone.
* Panel 2: Middle row left. Specimen T M P 1980.016.1723 displays three marks. Marks 1 and 2 are smooth-edged and internally smooth, whereas mark 3 is smooth-edged with a spongy interior.
* Panel 3: Middle row right. Specimen T M P 2009.012.0075 shows a single vertical mark with rough edges and a mixed internal texture of smooth, striated, and spongy areas.
* Panel 4: Bottom row, first from left. Specimen T M P 1993.066.0010 shows a long, vertical, rough-edged mark with a chattered internal texture.
* Panel 5: Bottom row, second from left. Specimen T M P 1993.066.0010 shows a triangular, rough-edged mark with a spongy interior.
* Panel 6: Bottom row, third from left. Specimen U A L V P 61095 shows a smooth-edged mark with a raked, linear texture.
* Panel 7: Bottom row, far right. A high-contrast view of specimen U A L V P 54667. Three red arrows point to very thin, smooth-edged, internally smooth marks labeled 4, 5, and 6.
Two of the three paleopathologic marks observed in this study show raised edges surrounding a central depression extending along the length of the mark (Fig. 6). On UALVP 61095, the largest paleopathologic mark, located more centrally on the jugal body, has a central depression surrounded by raised edges whereas the smaller paleopathologic mark, located closer to the orbit, lacks a central depression (Fig. 6.2, 6.5). Like the larger paleopathologic mark on UALVP 61095, the one paleopathologic mark on TMP 1999.055.0133 is located relatively central on the jugal body and has a central depression surrounded by raised edges (Fig. 6.1, 6.4). However, the central depression observed for the mark on TMP 1999.055.0133 is wider and more rugose in texture than that of UALVP 61095 (Fig. 6).
(1, 4, 7) Pathological jugal TMP 1999.055.0133. (2, 5, 8) Pathological jugal UALVP 61095. (3, 6, 9) Skull with possible pathological jugal FMNH UC 1479 in left lateral view. (1, 2) Specimens coated with ammonium chloride powder. (3) High-contrast, gray-scale image of FMNH UC 1479 (courtesy of W. Simpson). (4–6) Line drawings of specimens. (7, 8) Line drawings of specimens on generalized articulated skulls. Line drawing for lambeosaurine is based on ROM 871 (Corythosaurus casuarius) redrawn from Evans (Reference Evans2010). Line drawing for saurolophine is based on ROM 873 (Gryposaurus notabilis) redrawn from Gates and Sampson (Reference Gates and Sampson2007). (9) Line drawing of FMNH UC 1479 (Lambeosaurus lambei Parks, Reference Parks1923). Scale bars = 5 cm.

Figure 6. Long description
The figure is organized into a three-by-three grid.
Top Row (Panels 1, 2, 3): Photographs of three pathological jugal bones against a black background.
* Panel 1 shows specimen T M P 1999.055.0133, a light gray fossil with a dashed line indicating missing sections.
* Panel 2 shows U A L V P 61095, a smaller fragmented specimen.
* Panel 3 shows F M N H U C 1479, a dark, high-contrast gray-scale image of a skull section in left lateral view.
Each photograph includes a 5 cm scale bar in the bottom left.
Middle Row (Panels 4, 5, 6): Line drawings corresponding to the specimens directly above them.
* The bones are shaded in gray.
* A distinct pink-shaded region runs diagonally across each bone to highlight the pathological area.
* Dashed lines represent reconstructed or missing anatomical boundaries.
Bottom Row (Panels 7, 8, 9): Line drawings of articulated dinosaur skulls in lateral view to provide anatomical context.
* Panel 7 shows a lambeosaurine skull (Corythosaurus) with the jugal bone from panel 1 highlighted in gray and pink.
* Panel 8 shows a saurolophine skull (Gryposaurus) with the jugal bone from panel 2 highlighted.
* Panel 9 shows the skull of Lambeosaurus lambei (F M N H U C 1479) with the jugal bone from panel 3 highlighted.
In all three skull drawings, the specific jugal bone is shaded gray with the pathology marked in pink to show its position relative to the orbit and other cranial elements.
Orientation and location
More elements preserved tooth marks on the jugal body than on the postorbital process but with a lower number of tooth marks per element on average compared with that observed on the postorbital process (Fig. 2). However, the number of elements preserving multiple tooth marks on the jugal body was twice that for multiple tooth marks on the postorbital process. Across particular regions of the jugal, tooth marks were more common on the middle third of the jugal body than on the anterior or posterior third both in the number of modified elements and in the number of tooth marks observed per element (Figs. 2, 3). The postorbital process and anterior jugal body were the second most common locations for tooth marks to be observed, with a higher average number of tooth marks per element observed on the postorbital process. Although fewer elements preserved tooth marks on the posterior jugal body, the average number of tooth marks per element was higher on the posterior third than on the anterior third. The number of elements preserving tooth marks decreases with decreasing level of completeness as does the average and median number of tooth marks per element (Fig. 2).
Regions of the jugal that most commonly preserve tooth marks include the middle jugal body (N = 20) and the postorbital process (N = 13) followed by the anterior (N = 8) and posterior (N = 7) jugal body (Fig. 3). Tooth marks are restricted almost exclusively to the lateral surface of the jugal with the exception of one specimen (UALVP 54667) that exhibits tooth marks on the posterolateral surface of the postorbital process (Fig. 3; Supplementary Fig. 1; Supplementary Table 3). Elongate tooth marks show a wide range of orientations across jugals in general, but orientations appear less restricted when angles are plotted according to their relative placement on the jugal. On the anterior third of the jugal body, tooth marks are inclined ~20°, ~80°, and from ~140° to ~175° anteroposteriorly from the dorsoventral axis of the skull (Fig. 3). Tooth marks on the middle of the jugal body occupy a greater range, being inclined at ~5° and from 30° to ~155° anteroposteriorly from the skull dorsoventral axis (but note the number of elements contributing to each diagram). Tooth marks on the posterior third of the jugal body are oriented between 10° and 25° anteroposteriorly from the dorsoventral axis. One tooth mark on the posterior portion of the jugal body is inclined ~40° anteroposteriorly from the skull dorsoventral axis (Fig. 3). The orientations of tooth marks observed on the lateral surface of the postorbital process are more like the orientations of paleopathologic marks extending along the length of the jugal body. Tooth marks on the posterolateral surface of the postorbital process exhibit a relatively narrow range of orientations, being restricted to between 55° and 65° relative to the dorsoventral axis of the skull (Fig. 3).
Of the three paleopathologic marks observed, the two positioned more centrally on the jugal body roughly parallel the long axis of the element, being inclined between ~130° and ~150° from the dorsoventral axis of the skull (Fig. 3). The remaining paleopathologic mark, positioned closer to the orbital margin, is oriented more horizontally.
Damage to the postorbital process
Six elements exhibited unusual damage to the postorbital process where breakage occurs about a third of the way up from the base of the postorbital process. Five of these elements exhibited this damage in addition to tooth marks, three with tooth marks on the jugal body (TMP 1993.066.0010, TMP 2007.020.0037, TMP 2015.012.0081) and two with tooth marks on the postorbital process (TMP 2007.020.0037, TMP 2015.012.0081) (Supplementary Fig. 1). The edges of these broken surfaces are abraded (Fig. 7), suggesting damage to the postorbital process occurred in the Cretaceous and was not the result of modern breakage after element exposure. When the broken edges are measured in lateral view, the orientations of those edges are inclined 40° to 95° and 125° to 145° anteroposteriorly from the dorsoventral axis of the skull, like the orientations observed for tooth marks on the postorbital process (Fig. 3).
Close-up images of Cretaceous damage observed on postorbital processes of hadrosaurid jugals. (1) TMP 1993.066.0010 in right lateral view; (2, 3) close-ups of the postorbital process in lateral (2) and medial (3) views (mirrored). (4) TMP 2007.020.0037 in left lateral view; (5–7) close-ups of postorbital process in oblique dorsolateral (5), left lateral (6), and medial (7) views. Scale bars = 1 cm.

Figure 7. Long description
A collection of seven photos organized into two rows.
Top row:
* Panel 1 shows a light gray fossilized jugal in right lateral view. It is a curved bone with a prominent vertical postorbital process. A white scale bar is located below the center.
* Panel 2 is a close-up of the postorbital process from panel 1 in lateral view, showing a tapered, pointed tip with fine surface striations. A vertical scale bar is on the left.
* Panel 3 is a mirrored medial view of the same process, showing cracks and surface texture. A vertical scale bar is on the right.
Bottom row:
* Panel 4 shows a tan and brown fossilized jugal in left lateral view. The bone is more robust than the first specimen. A white scale bar is below the center.
* Panel 5 is a close-up of the postorbital process in oblique dorsolateral view, highlighting a circular, pitted area of damage at the apex.
* Panel 6 shows the process in left lateral view, focusing on the jagged, broken distal edge. A vertical scale bar is on the left.
* Panel 7 shows the medial view of the process, revealing the depth of the bone damage and internal texture. A vertical scale bar is on the right.
All scale bars represent 1 cm.
Feature dimensions, secondary category, and curvature
Of the 48 tooth marks observed across jugals, 40 (83.3%) are elongate and eight (16.7%) are non-elongate. All paleopathologic marks, although masked somewhat by reparative bone deposition, are classified as elongate. Tooth marks are significantly shorter than paleopathologic marks but of statistically comparable widths (Fig. 8; Supplementary Table 4). Marks on the jugal body are significantly longer and wider than those on the postorbital process but not significantly deeper (Fig. 8; Supplementary Table 4). Paleopathologic marks are significantly longer than tooth marks on the postorbital process and middle jugal body (Fig. 9; Supplementary Tables 4, 5). Tooth marks on the postorbital process are significantly shorter and narrower than tooth marks on the anterior jugal body and significantly narrower than tooth marks on the middle jugal body (Fig. 9; Supplementary Tables 4, 5). Although no significant differences in tooth-mark depth were returned, tooth marks on the posterior jugal body are, on average, slightly shallower than those on other parts of the jugal (Fig. 9; Supplementary Tables 4, 5).
Boxplots showing log-transformed mark length (1, 3) and width (2, 4) by mark type across jugals in general (1, 2) and by placement on the jugal (3, 4) along with associated p-values for permuted t-tests comparing marks on the jugal body versus postorbital process. “Ne =” denotes the number of elements with marks contributing to a given diagram whereas “Nm =” denotes the number of marks contributing to a given diagram. Detailed statistical results in Supplementary Table 3.

Figure 8. Long description
A four-panel figure displaying statistical distributions of bone marks. A legend in the center indicates purple dots for healing and orange dots for unhealed marks.
Panel 1: Top-left. Y-axis is log length in millimeters from 0.5 to 2.0. X-axis compares tooth marks (N e = 20, Nm = 48) and pathologic marks (N e = 2, Nm = 3). Tooth marks are mostly unhealed, clustered between 0.5 and 1.5. Pathologic marks are healing and significantly longer, clustered near 2.0. P-value equals 0.001.
Panel 2: Top-right. Y-axis is log width in millimeters from -0.5 to 0.5. Tooth marks show a wide vertical spread of unhealed points. Pathologic marks are healing and slightly wider on average. P-value equals 0.216.
Panel 3: Bottom-left. Log length categorized by jugal location. The body section shows tooth marks clustered around 1.2 and pathologic marks near 2.0. The postorbital process section shows only tooth marks, which are shorter, clustered below 1.0. P-value equals 0.002.
Panel 4: Bottom-right. Log width categorized by location. In the body, tooth marks and pathologic marks have similar width distributions centered near 0.5. In the postorbital process, tooth marks are notably narrower, centered below 0.0. P-value equals 0.001.
Boxplots showing log-transformed mark length (1), width (2), and depth (3) by mark type and specific regions on jugals with omnibus p-values and significant p-values from follow-up pairwise comparisons. “Ne =” denotes the number of elements with marks contributing to a given diagram whereas “Nm =” denotes the number of marks contributing to a given diagram. Detailed statistical results in Supplementary Tables 4, 5.

Figure 9. Long description
A multi-panel figure with three vertical sections labeled 1, 2, and 3.
Panel 1: Log length (m m) on the y-axis from 0.5 to 2.0. The x-axis is divided into body (pathologic, anterior body, middle body, posterior body) and postorbital process (tooth mark). Pathologic marks show the highest log length (median near 2.0). Length decreases toward the postorbital process. Significant p-values (p equals 0.02 and p equals 0.032) indicate differences between pathologic/anterior body and the tooth mark region. Omnibus p equals 0.001.
Panel 2: Log width (m m) on the y-axis from -0.5 to 1.5. Similar x-axis categories. Pathologic marks have the highest width (median near 0.6). Width remains relatively stable across the body regions but drops significantly in the postorbital process tooth marks (median below 0). Significant p-values (p equals 0.02) connect anterior/middle body to tooth marks. Omnibus p equals 0.001.
Panel 3: Log depth (m m) on the y-axis from -1.0 to 0.5. This panel lacks the pathologic category. Medians for anterior body, middle body, and tooth marks are similar (between -0.5 and 0), whereas posterior body marks are significantly shallower, clustered at -1.0. Omnibus p equals 0.241.
Each boxplot includes individual data points (red or purple dots), a median line, a blue diamond representing the mean, and sample sizes (N e and Nm) listed below each category label.
In terms of curvature, linear (N = 27) tooth marks are the most common, followed by curved (N = 12) and then S-shaped (N = 1); tooth marks belonging to the hooked curvature category were not observed (Fig. 10). Most linear tooth marks are located on the postorbital process whereas curved or S-shaped tooth marks are concentrated on the jugal body. Curvatures for linear and curved tooth marks generally form a continuous distribution ranging from ~160° to ~180° except for two curved marks with curvatures of ~143° and ~131°. One arc of the single S-shaped tooth mark falls within the curved portion of this range (165°) whereas the other arc falls within the linear portion (172°) (Fig. 10). All paleopathologic marks (N = 3) are S-shaped, with most arcs having curvatures between 150° and 165° except for one arc with a curvature of 117° (Fig. 10).
Distribution of curvature measurements for elongate marks observed on hadrosaurid jugals. Dashed lines represent boundaries between curvature categories assigned to marks with a single curve following the Category-Modifier system of Wyenberg-Henzler et al. (Reference Wyenberg-Henzler, Fowler, Currie and Sullivan2024). Each point represents a curvature measurement; for S-shaped marks, two curvatures were obtained for a single mark, and both are displayed in the graph and connected with a vertical line (= two points per S-shaped mark). “Ne =” denotes the number of elements with marks contributing to a given distribution.

Figure 10. Long description
A dot and box plot with a Y axis labeled curvature in degrees ranging from 110 to 180. The X axis is divided into two primary sections: pathologic on the left and tooth mark on the right.
Legend at the top:
* Asterisk: multi-curve, body
* Square: single-curve, body
* Triangle: single-curve, postorbital process
Horizontal dashed blue lines divide the graph into three curvature categories:
* Linear: above 170 degrees
* Curved: between 120 and 170 degrees
* Hooked: below 120 degrees
Data distribution from left to right:
1. Pathologic (multiple curves, Ne equals 2): Features three vertical purple lines connecting pairs of asterisks. Two pairs are in the curved zone and one spans from hooked to curved. A purple box plot is centered around 154 degrees.
2. Tooth mark (multiple curves, Ne equals 1): Features one vertical orange line connecting two asterisks at approximately 165 and 173 degrees. A pink box plot is centered just below 170 degrees.
3. Tooth mark (single curve, Ne equals 17): A dense cluster of red squares and triangles located primarily in the linear zone (170 to 180 degrees), with a few outliers in the curved zone. A pink box plot for this group is centered at approximately 173 degrees. Two black dots representing outliers are located at 131 and 143 degrees.
Discussion
Interpreting the mechanism or series of mechanisms responsible for the formation of tooth marks often relies on considerations of soft-tissue distribution and the way the tooth or teeth are interacting with bone. The distribution of tooth marks across the skeleton is also important in aiding behavioral interpretations (Estes and Goddard, Reference Estes and Goddard1967; Blumenschine, Reference Blumenschine1986; Nation and Williams, Reference Nation and Williams1989; Komar and Beattie, Reference Komar and Beattie1998; Njau, Reference Njau2012; Njau and Gilbert, Reference Njau and Gilbert2016; Young, Reference Young, Schotsmans, Márquez-Grant and Forbes2017; Errickson et al., Reference Errickson, Lawrence, Indra and Thompson2024; Wahl et al., Reference Wahl, Burcham, Herbert, Humberg, Zollner, Jones, Quinby and Kluever2024; Finaughty et al., Reference Finaughty, French, Adams, Spies and Gibbon2025). This larger context becomes particularly important for discerning whether tooth marks are the result of predation or scavenging, which is often extremely difficult as these mechanisms often produce tooth marks that appear very similar (Shipman, Reference Shipman1986; Hone and Watabe, Reference Hone and Watabe2010; Hone et al., Reference Hone, Tanke and Brown2018; Drumheller et al., Reference Drumheller, McHugh, Kane, Riedel and D’Amore2020). In cases where marks can be attributed to either predation or scavenging, paleontologists often refrain from attributing them to predation unless they show evidence of healing and are positioned in regions (e.g., hindquarters, distal limbs) that are commonly targeted by modern predators while attempting to catch and dispatch prey (Carpenter, Reference Carpenter1998; DePalma et al., Reference DePalma, Burnham, Martin, Rothschild and Larson2013; Rothschild and Depalma, Reference Rothschild and Depalma2013; Drumheller et al., Reference Drumheller, Stocker and Nesbitt2014; Wyenberg-Henzler and Scannella, Reference Wyenberg-Henzler and Scannella2026). Given the difficulties with assigning marks to predation versus scavenging, we advise caution with the interpretations presented by Rothschild and DePalma (Reference Rothschild and Depalma2013) until the specimens can be studied in further detail. Although the red markings the authors provided are useful for mapping out the marks, they also obscure the morphology of the marks themselves, making study and interpretation by subsequent researchers impossible. There are also some methodological concerns that bring some of the results of DePalma et al. (Reference DePalma, Burnham, Martin, Rothschild and Larson2013) into question. In the majority of published cases, tooth marks are observed on isolated elements and lack any signs of healing, which makes it impossible to establish whether the marks were made by a carnivore that had caught, killed, and then fed upon an animal or by a carnivore that had fed upon the carcass of an animal that was already dead. In these scenarios, it is common practice to take a conservative approach and interpret such tooth marks as the result of scavenging or simply attribute the marks to feeding more generally without ascribing them to scavenging or predation (Currie and Jacobsen, Reference Currie and Jacobsen1995; Erickson and Olson, Reference Erickson and Olson1996; Chure et al., Reference Chure, Fiorillo and Jacobsen1998; Jacobsen, Reference Jacobsen1998; Fowler and Sullivan, Reference Fowler and Sullivan2006; Hone and Watabe, Reference Hone and Watabe2010; Hone and Tanke, Reference Hone and Tanke2015; Hone and Chure, Reference Hone and Chure2018; Hone et al., Reference Hone, Tanke and Brown2018; Peterson and Daus, Reference Peterson and Daus2019; Drumheller et al., Reference Drumheller, McHugh, Kane, Riedel and D’Amore2020, Reference Drumheller, Boyd, Barnes and Householder2022; Brown et al., Reference Brown, Tanke and Hone2021; Lei et al., Reference Lei, Tschopp, Hendrickx, Wedel, Norell and Hone2023). One notable exception is a recent study by Wyenberg-Henzler and Scannella (Reference Wyenberg-Henzler and Scannella2026) that documents a possible successful predation attempt and subsequent carcass utilization by an adult Tyrannosaurus from an embedded tooth in the nasal and tooth marks on the lateral surfaces of the left jugal and right dentary of an adult Edmontosaurus skull. In this rather unique case, the authors were able to associate these unhealed tooth marks only with feeding following a successful predation attempt because of the positioning and orientation of the embedded tooth in the snout of the specimen. If the tooth-marked left jugal or right dentary had been found in isolation, it would have been impossible to establish that the tooth marks on these elements had been produced by feeding following a successful predation attempt. In the present study, none of the tooth marks observed show any evidence of healing, and many of these specimens are isolated so we can only say that these tooth marks were likely produced during the removal and subsequent consumption of soft tissue.
Any discussion of the patterns of occurrence of tooth traces across the jugal requires a brief discussion of potential within-element biases. One of these biases may be related to survivorship, in which more robust regions, such as the jugal body, may be more likely to undergo tooth-mark damage and survive, whereas more delicate areas, such as the postorbital process, may be destroyed entirely after being tooth marked. A second potential bias is related to surface area, with areas with more surface being more likely to be marked than areas with limited surface area. Specimen maturity may also influence element survivorship as smaller elements/animals are more likely to be destroyed or consumed whole (e.g., Therrien et al., Reference Therrien, Zelenitsky, Tanaka, Voris, Erickson, Currie, DeBuhr and Kobayashi2023). Although we examined all jugals within the TMP and UALVP collections regardless of size, all jugals with tooth marks appear to be from adult-sized animals judging from the relative sizes of the elements and bone texture. Although we acknowledge that biases like these may be skewing the data, we do not attempt to quantitatively correct for them.
Because tooth marks were restricted almost exclusively to the lateral surface of the jugal, it is most likely that they would have been produced while the jugal was at least in partial articulation with the rest of the skull, making the medial surface largely inaccessible. If the jugal were disarticulated from the rest of the skull, the medial surface would have been accessible but the likelihood of the bone becoming severely damaged and/or broken would have also increased. Disarticulation of the jugal would have also influenced the likelihood of tooth marks being produced. A disarticulated jugal would have moved more freely, producing less resistance against the carnivore’s tooth as it was brought into contact with the bone surface and thereby decreasing the likelihood the tooth would leave behind a visible mark. Conversely, an articulated jugal would provide more resistance, increasing the chances of tooth marks being produced. The rarity of bite marks on the jugals of articulated and partially articulated skulls (2.4%), but relatively common occurrence on isolated elements (23.3%), yet being observed only on the lateral surface, is consistent with (1) the marks being delivered while the jugal was articulated to the skull and (2) the removal of the surrounding soft tissue resulting in or contributing to disarticulation of the jugal from the skull.
Mechanism of tooth-mark formation
Postorbital process
The shape of the element also would have played a role in tooth-mark distribution, particularly for marks on the postorbital process. The roughly anteroposterior orientation and short, narrow, and linear nature of tooth marks on the postorbital process would be consistent with a scenario where the jugal is being gripped and manipulated (Figs. 3, 8). Such an explanation would also be consistent with the pattern of Cretaceous damage observed on the postorbital processes of several specimens (Figs. 3, 7). Not only are the broken edges approximately parallel to tooth marks on the postorbital process, but also this breakage occurs about a third of the way up from the base of the process in a similar region to where tooth marks are observed. Although it is difficult to definitively claim that this breakage is the result of manipulation of the jugal via the postorbital process, the commonalities observed with tooth marks is intriguing enough to consider it as a plausible explanation.
Feeding on the eye and/or associated orbital tissues is another plausible explanation for tooth marks on the postorbital process, either alternative or in addition to manipulation of the element. The eye and associated orbital tissues are also present in close association with the jugal (Fig. 1). Findings from examination of feeding behaviors following predation (Estes and Goddard, Reference Estes and Goddard1967; Blumenschine, Reference Blumenschine1986; Errickson et al., Reference Errickson, Lawrence, Indra and Thompson2024) or during scavenging scenarios (Blumenschine, Reference Blumenschine1986; Nation and Williams, Reference Nation and Williams1989; Komar and Beattie, Reference Komar and Beattie1998; Young, Reference Young, Schotsmans, Márquez-Grant and Forbes2017; Wahl et al., Reference Wahl, Burcham, Herbert, Humberg, Zollner, Jones, Quinby and Kluever2024; Finaughty et al., Reference Finaughty, French, Adams, Spies and Gibbon2025) suggest these tissues are often accessed relatively later in the consumption sequence after most of the soft tissue has been removed from other, higher-economy (sensu Drumheller et al., Reference Drumheller, McHugh, Kane, Riedel and D’Amore2020) parts of the carcass. The main exception appears to be avian scavengers and small-bodied scavengers (e.g., mongooses, fish), which appear to target the orbital region (Nation and Williams, Reference Nation and Williams1989; Berger and Clarke, Reference Berger and Clarke1995; Trapani et al., Reference Trapani, Sanders, Mitani and Heard2006; Reeves, Reference Reeves2009; Kumar et al., Reference Kumar, Chhabra and Kumar2014; Polačik et al., Reference Polačik, Jurajda, Blažek and Janáč2015; Wahl et al., Reference Wahl, Burcham, Herbert, Humberg, Zollner, Jones, Quinby and Kluever2024; Finaughty et al., Reference Finaughty, French, Adams, Spies and Gibbon2025). The concentration of narrow marks on the postorbital process may alternatively represent targeted consumption of the eye and associated orbital tissues, possibly by smaller-bodied scavengers.
Jugal body
Tooth marks on the anterior and middle jugal body are located more anterior and lateral to the reconstructed adductor musculature (Figs. 1, 3). Given these marks show no clear preferred orientation, are some of the longest and widest marks observed, and are located away from easily accessible soft tissue, it is possible that they represent manipulation behavior, including attempts to remove the jugal to access the underlying adductor musculature (Rybczynski et al., Reference Rybczynski, Tirabasso, Bloskie, Cuthbertson and Holliday2008; Holliday, Reference Holliday2009; Bell, Reference Bell, Eberth and Evans2014; Nabavizadeh, Reference Nabavizadeh2020a, Reference Nabavizadeh2020b; Dudgeon and Evans, Reference Dudgeon and Evans2025). Given the relatively fragile nature of the jugal, it is likely that it and the underlying adductor musculature were removed while the skull was mostly articulated. If the skull was not mostly articulated, the jugal would likely have been broken and lost or potentially consumed along with the adductor musculature. To grip the jugal, it is likely that the teeth of the upper jaws contacted the lateral surface, and teeth of the lower jaws contacted the medial surface. However, this may have been especially difficult for some marks on the middle jugal body as there would have been little space between the jugal and surrounding bones such as the quadrate, maxilla, and dentary. If some of the elements such as the maxilla or dentary had already been partially disarticulated, possibly by prior manipulation of the premaxilla/nasal, quadrate, or dentary, then this might have increased the amount of space around the jugal. This would be consistent with the one articulated specimen in our dataset (TMP 1998.081.0001), which is preserved with the lower jaw and quadrate on the corresponding side disarticulated. Furthermore, none of the specimens examined showed marks on the medial surface. Although it is possible for contact by the opposing teeth to be inhibited by tissues surrounding the opposing surface of a given element or by the bone of another articulating element, as is likely the case for other examples in the literature (e.g., Brown et al., Reference Brown, Tanke and Hone2021), this does not explain why none of the jugals in our datasetexhibit tooth marks on the medial surface. For both jaws to contact the medial and lateral surfaces to grip the jugal, all the bones and tissues that would have inhibited contact would need to have been relocated. This makes gripping during manipulation an unlikely explanation for tooth marks on the lateral surfaces of hadrosaurid jugals.
Alternatively, tooth marks on the jugal body could reflect attempts to remove other, extraoral, soft tissues (“cheeks”) that surround the lateral surfaces of the face. Some authors have proposed the presence of muscular “cheeks” with the attachment of the m. adductor mandibulae externus superficialis (mAMES) to the labial dentary ridge (LDR) on the lateral surface of the dentary, anterior the coronoid process (Nabavizadeh, Reference Nabavizadeh2020a, Reference Nabavizadeh2020b). However, a recent study found that the space in the temporal chamber was not large enough to allow for the mAMES to attach to the LDR without twisting and mediolateral narrowing of the muscle (Dudgeon and Evans, Reference Dudgeon and Evans2025). Judging from this information, a muscular “cheek” via the mAMES would appear unlikely. However, it is possible that a flap of tissue extended across this region instead. Such a flap has been proposed given the average number of foramina along the premaxilla, maxilla, and dentary (Morhardt, Reference Morhardt2009). The presence of non-muscular extraoral tissues has also been proposed for other dinosaurs, including tyrannosaurids (Cullen et al., Reference Cullen, Larson, Witton, Scott, Maho, Brink, Evans and Reisz2023) and possibly the nodosaurid Panoplosaurus (Barrett, Reference Barrett and Carpenter2001; Nabavizadeh, Reference Nabavizadeh2020a). To access the underlying adductor musculature, this labial extraoral flap would also need to be removed via nipping or scraping by the anterior teeth and could have resulted in the production of tooth marks on the lateral surface of the anterior and middle jugal body. Conversely, the tooth marks on the posterior jugal body are positioned near the reconstructed attachment region for the exoparia and oriented more perpendicular to the fiber direction of the tissues composing the exoparia (Sharpe et al., Reference Sharpe, Wang, Dudgeon, Powers, Whitebone, Coppock, Dyer and Sullivan2024), suggesting these tooth marks were produced during the removal of this tissue. A recent study on an articulated Edmontosaurus skull from the Hell Creek Formation suggested that tooth marks on the lateral surface of the posterior jugal body in this specimen were produced during the removal of the exoparia by the premaxillary arcade (Wyenberg-Henzler and Scannella, Reference Wyenberg-Henzler and Scannella2026). This nipping/scraping behavior has also been previously invoked in studies describing tooth marks attributed to tyrannosaurid premaxillary teeth making incidental contact with the bone surface of postcranial elements to remove flesh from close to the bone (e.g., Erickson and Olson, Reference Erickson and Olson1996; Fowler and Sullivan, Reference Fowler and Sullivan2006; Hone and Watabe, Reference Hone and Watabe2010; Hone and Chure, Reference Hone and Chure2018). It is possible that a similar nipping/scraping behavior was responsible for the tooth marks seen here.
Carcass utilization
When modern carnivores feed off of a carcass, they generally begin by consuming flesh from body regions with the highest nutritional yield (i.e., high-economy areas) and progressively consume flesh from regions of lower nutritional yield (i.e., low-economy areas) in what is known as a carcass consumption sequence (Richardson, Reference Richardson1980; Haynes, Reference Haynes1982; Blumenschine, Reference Blumenschine1986; Nation and Williams, Reference Nation and Williams1989; Capaldo and Peters, Reference Capaldo and Peters1995; Haglund, Reference Haglund, Haglund and Song1997; Stiner et al., Reference Stiner, Munro and Sanz2012; Haynes and Klimowicz, Reference Haynes and Klimowicz2015; Drumheller et al., Reference Drumheller, McHugh, Kane, Riedel and D’Amore2020; Wadley, Reference Wadley2020). Many modern carnivores typically consume flesh from the skull during the later stages of carcass utilization because cranial elements are considered low-economy elements. In some instances, such as when there is a large disparity between carnivore and carcass size or competition between group members for components of a carcass or during long-term utilization, carcasses will tend to be more heavily utilized (Willey and Snyder, Reference Willey and Snyder1989; Wadley, Reference Wadley2020). This is supported by the percentage of damaged elements recovered in studies of modern animals with higher rates of feeding-related damage reported for higher-economy elements. A survey of ungulate carcasses fed upon by wild bears reported feeding-related damage on 37.5% of recovered cranial elements versus 73.2% of recovered ribs (Arilla et al., Reference Arilla, Rosell, Blasco, Domínguez-Rodrigo and Pickering2014). Another survey of small ungulate carcasses fed upon by wild red foxes recorded feeding-related damage on 14.3% of recovered cranial elements versus 72.2% of recovered ribs (Arilla et al., Reference Arilla, Rosell and Blasco2019). Analyses of material collected from a modern wild spotted hyena den reported slightly lower percentages, with tooth marks on 7.0% of cranial elements, 34.1% of mandibular elements, and 47.4% of ribs (Egeland et al., Reference Egeland, Egeland and Bunn2008). Work on modern captive felids fed partial equid carcasses suggested tooth marks occurred on 16.7% of cranial elements and 1.9% of mandibles and only 9.3% of ribs (Errickson et al., Reference Errickson, Lawrence, Indra and Thompson2024). This study also noted tooth marks occurred mostly in regions around the eyes, nasals, posterior mandible, and sagittal crest. However, this frequency might be artificially high as one study has suggested higher tooth-marking frequencies in captive compared with wild felids (Haynes, Reference Haynes1982; Gidna et al., Reference Gidna, Yravedra and Domínguez-Rodrigo2013). Specimens dragged off and consumed at den sites are also known to exhibit higher tooth-marking frequencies from gnawing compared with carcasses that were consumed in place (Haynes, Reference Haynes1982). The overall jugal tooth-marking frequency (13.5%) observed in the present study is comparable to these reported values for cranial elements, particularly those for red foxes. Similarities in modern tooth-marking frequency/feeding modification to that of our dataset suggest Cretaceous carnivores may have utilized carcasses in a manner reminiscent of modern carnivores. However, establishing this will require further systematic investigations using large datasets, consideration of other cranial and postcranial elements, and taphonomic factors that could influence overall tooth-mark frequency.
Note that although the sample encompassed hadrosaurid (or hadrosauroid) jugals spanning from the Santonian Milk River Formation to the early Maastrichtian Horseshoe Canyon Formation, most of the elements bearing tooth marks (95%) are derived from the well-sampled Dinosaur Park Formation. Thus, the feeding observations noted here may not be consistent across the entirety of the sampled formations and may be representative of only the Dinosaur Park Formation assemblage. It is currently unclear whether the large proportion of elements bearing tooth marks recovered from the Dinosaur Park Formation are the result of more-intensive sampling or could be related to differences in faunal composition or environment.
Given low-economy elements such as cranial elements are often consumed relatively later in the consumption sequence (Richardson, Reference Richardson1980; Haynes, Reference Haynes1982; Blumenschine, Reference Blumenschine1986; Nation and Williams, Reference Nation and Williams1989; Capaldo and Peters, Reference Capaldo and Peters1995; Haglund, Reference Haglund, Haglund and Song1997; Stiner et al., Reference Stiner, Munro and Sanz2012; Haynes and Klimowicz, Reference Haynes and Klimowicz2015; Drumheller et al., Reference Drumheller, McHugh, Kane, Riedel and D’Amore2020; Wadley, Reference Wadley2020), it is likely the tooth marks observed on jugals in our dataset were produced during late-stage carcass utilization. Case studies that describe Late Cretaceous tooth marks have often suggested that these marks are produced during late-stage carcass utilization, particularly for examples that attribute the tooth marks to tyrannosaurids (e.g., Currie and Jacobsen, Reference Currie and Jacobsen1995; Erickson and Olson, Reference Erickson and Olson1996; Fowler and Sullivan, Reference Fowler and Sullivan2006; Hone and Watabe, Reference Hone and Watabe2010; Hone and Tanke, Reference Hone and Tanke2015; Hone and Chure, Reference Hone and Chure2018; Hone et al., Reference Hone, Tanke and Brown2018; Drumheller et al., Reference Drumheller, McHugh, Kane, Riedel and D’Amore2020; Brown et al., Reference Brown, Tanke and Hone2021; Lei et al., Reference Lei, Tschopp, Hendrickx, Wedel, Norell and Hone2023; Wyenberg-Henzler and Scannella, Reference Wyenberg-Henzler and Scannella2026 but see Drumheller et al., Reference Drumheller, McHugh, Kane, Riedel and D’Amore2020, Reference Drumheller, Boyd, Barnes and Householder2022).
Possible tracemakers
Within the Late Cretaceous formations of Alberta where these specimens originate, there are several potential carnivores that could have been responsible for the production of tooth marks on the specimens described here: dromaeosaurid, troodontid, tyrannosaurid, champsosaur, and crocodilian. Most of the tooth marks observed in the present study were likely produced by tyrannosaurids or crocodilians. Given the relatively gracile nature of dromaeosaurid, troodontid, and champsosaur skulls and teeth, any tooth marks they produced would have been relatively fine and shallow and likely obscured during the fossilization process. One notable exception to this may be UALVP 54667, which preserves extremely fine and shallow tooth marks on the posterolateral surface of the postorbital process (Fig. 5.7). However, it is equally possible that another similarly sized tracemaker such as a juvenile tyrannosaurid produced these tooth marks. This leaves tyrannosaurids and crocodilians as potential tracemakers. Determining which of these two candidates is more likely is extremely difficult given most specimens preserve only one tooth mark or preserve several tooth marks that cannot be ascribed to, or are hard to confidently ascribe to, multiple teeth contacting during a single bite, thereby preventing the comparison of tooth and tooth-mark spacing. Of the handful of specimens that can be considered (TMP 1980.016.1723, TMP 1993.066.0010, TMP 1994.012.0640, UALVP 63097), the overall spacing between tooth marks appears relatively large, indicating either (1) only some teeth contacted the bone surface, resulting in gaps and artificially increasing the apparent spacing between marks, or (2) a rather large animal was responsible for the production of those tooth marks. Assuming all successive teeth contacted the bone, tooth marks on these specimens would most likely be attributable to an adult tyrannosaurid. This identification would be consistent with the scraping/nipping behavior that is interpreted as being responsible for the production of these tooth marks. The depth of the tooth marks and associated damage to the postorbital process would also be consistent with a tyrannosaurid tracemaker.
Mechanism of formation for paleopathologic marks
Minor textural differences between the paleopathologies on both jugals suggest that these elements represent slightly different stages of healing but could also suggest differences in the severity of the initial injury. Although TMP 1999.055.0133 bears a distinct halo of swollen and remodeled bone around the central incised area, the texture of this bone does not show the high porosity generally seen in remodeled bone and has a similar texture to the rest of the bone (Fig. 6.1). By contrast, the marks on UALVP 61095 show remodeled bone with much higher porosity than the rest of the element (Fig. 6.2). The mark on TMP 1999.055.0133 has a more-pronounced rugose central groove than the marks on UALVP 61095, suggesting that either the marks on UALVP 61095 are more fully healed than those on TMP 1999.055.0133 or the mark on TMP 1999.055.0133 was much wider or deeper than those on UALVP 61095 and required more time to heal. Our understanding of the timing and sequence of healing of traumatic injuries in extant and extinct reptiles is limited (Scott et al., Reference Scott, Gamble, Brown and Brink2025), and as such we do not speculate further. Given all three paleopathologic marks share similar orientations, placement on the jugal, and S-shaped curvature, it is most parsimonious to assume that the same mechanism of injury was responsible (Figs. 3, 6). In particular, the arrangement of the two marks on UALVP 61095 might be helpful in identifying a mechanism of injury. The relatively localized nature of healing marks to one surface of the element and the presence of multiple, semi-parallel marks on UALVP 61095 suggest that the cause of these marks was relatively instantaneous, localized, and potentially involved multiple points of contact. Possible explanations include injury from a fall either in general or onto one or more branches, intra- or inter-specific agonism, injury during a failed attack with claws, or injury during a failed attack with teeth. It is also possible that the paleopathologies, although consistent with a traumatic injury, may be non-traumatic in origin and may represent an unknown developmental or disease condition.
Ascribing a particular mechanism to the formation of these features is particularly difficult given the reactive bone generated by the healing response has obliterated some of the finer details of the original marks and the limited number of specimens in this region preserving paleopathological marks. Consideration of similarities in the overall orientation of the individual marks, the presence of multiple similarly oriented marks on a single specimen, and the relatively restricted extent of the marks along the lateral surface of the jugals makes injury inflicted by one or more kicks from a conspecific, injury during a failed attack with claws, or injury during a failed attack with teeth, more likely than the other mechanisms mentioned (see Supplementary Text for details). Although there is a possible third specimen, FMNH UC 1479 (figured by Dalman et al., Reference Dalman, Jasinski, Malinzak, Lucas, Kundrat and Fiorillo2025), which may preserve a similar mark to those observed on TMP 1999.055.0133 and UALVP 61095 (Fig. 6), several things inhibit our ability to confidently determine whether the feature is indeed pathological (Supplementary Text). In photos of the specimen from 1955, the feature on the anterior half of the jugal is slightly raised. In more recent photos, however, this feature is less pronounced. Further complicating matters is the post-1955 restoration of the specimen following damage incurred while on display (Field Museum of Natural History, 2025; W. Simpson, personal communication, 2025), which is most noticeable on the crest, anterior end of the premaxilla, the ascending jugal process, and the descending postorbital process. Whether the differences observed between the 1955 photos and modern photos is due to differences in lighting conditions or some other reason cannot be determined at this time. For this reason, we have chosen to not include FMNH UC 1479 in our analysis but note it as a potential example worthy of future consideration.
Conclusion
This systematic survey of hadrosaurid jugals from the Late Cretaceous of Alberta, Canada, records an overall tooth-mark frequency of 13.6% but with a distinct difference across taphonomic modes, with nearly one quarter (23.6%) of all isolated elements marked, 7.4% of specimens from bonebeds, but only 2.4% of articulated specimens. The frequency of marks on disarticulated jugals (19%) is similar to, but slightly higher than, the frequency previously reported for disarticulated hadrosaur bones in general (14%; Jacobsen, Reference Jacobsen1998), but whether this represents a significant difference in damage relative to other cranial and post-cranial elements awaits further systematic sampling. Judging from the behavior of modern carnivores, the proportion of marked to unmarked elements suggests that jugals would have been removed relatively later during the consumption sequence. The restriction of tooth marks to the lateral surface but low frequency on articulated skulls suggests they were largely produced as the result of removal of the jugal from the articulated skull to access the underlying adductor musculature during feeding. Tooth marks observed on the postorbital process appear to be associated with attempts to grasp and remove the jugal. In our survey, two specimens were paleopathological, preserving a total of three S-shaped marks oriented roughly anteroposteriorly across the anterior two-thirds of the jugal body. Although this distribution is inconsistent with some explanations (fall, intraspecific combat), some explanations (injury by claws or teeth) cannot be excluded with the information currently available. Further investigations into tooth-mark distribution patterns across other elements in the skull may provide greater insight into how hadrosaurid carcasses were being utilized by Late Cretaceous carnivores. Such surveys might also highlight other pathologies similar to those observed on jugals that could help further narrow a potential cause for these paleopathologies.
Acknowledgments
We thank B. Strilisky, B. Sanchez, and T. Courtenay at the RTMP and J. Sweder and H. Gibbins at the UALVP for assistance with and access to collections. Thanks to H. Sharpe and M. Powers for early conversations on jugal pathologies and T. Dudgeon for conversations on hadrosaurid cranial musculature. Thanks also go to C. Reed for helpful discussions surrounding the project and questions about the possibility of claws as a formational mechanism and to J. Milligan for philosophical discussions on terminology. Our gratitude also goes to J. McKee for drawing our attention to FMNH UC 1479. Thanks to J. Mallon, W. Simpson, and J. O’Connor for assistance with determining the true specimen number of FMNH UC 1479 and to W. Simpson for sending photos of FMNH UC 1479. Thanks to P. Brinkman for sharing a copy of Zangerl (1956). We also acknowledge the detailed comments provided by four anonymous reviewers that helped improve this manuscript.
Data availability statement
Data available from Dryad Digital Repository: https://doi.org/10.5061/dryad.fqz612k6x.
Competing interests
The authors declare no competing interests.

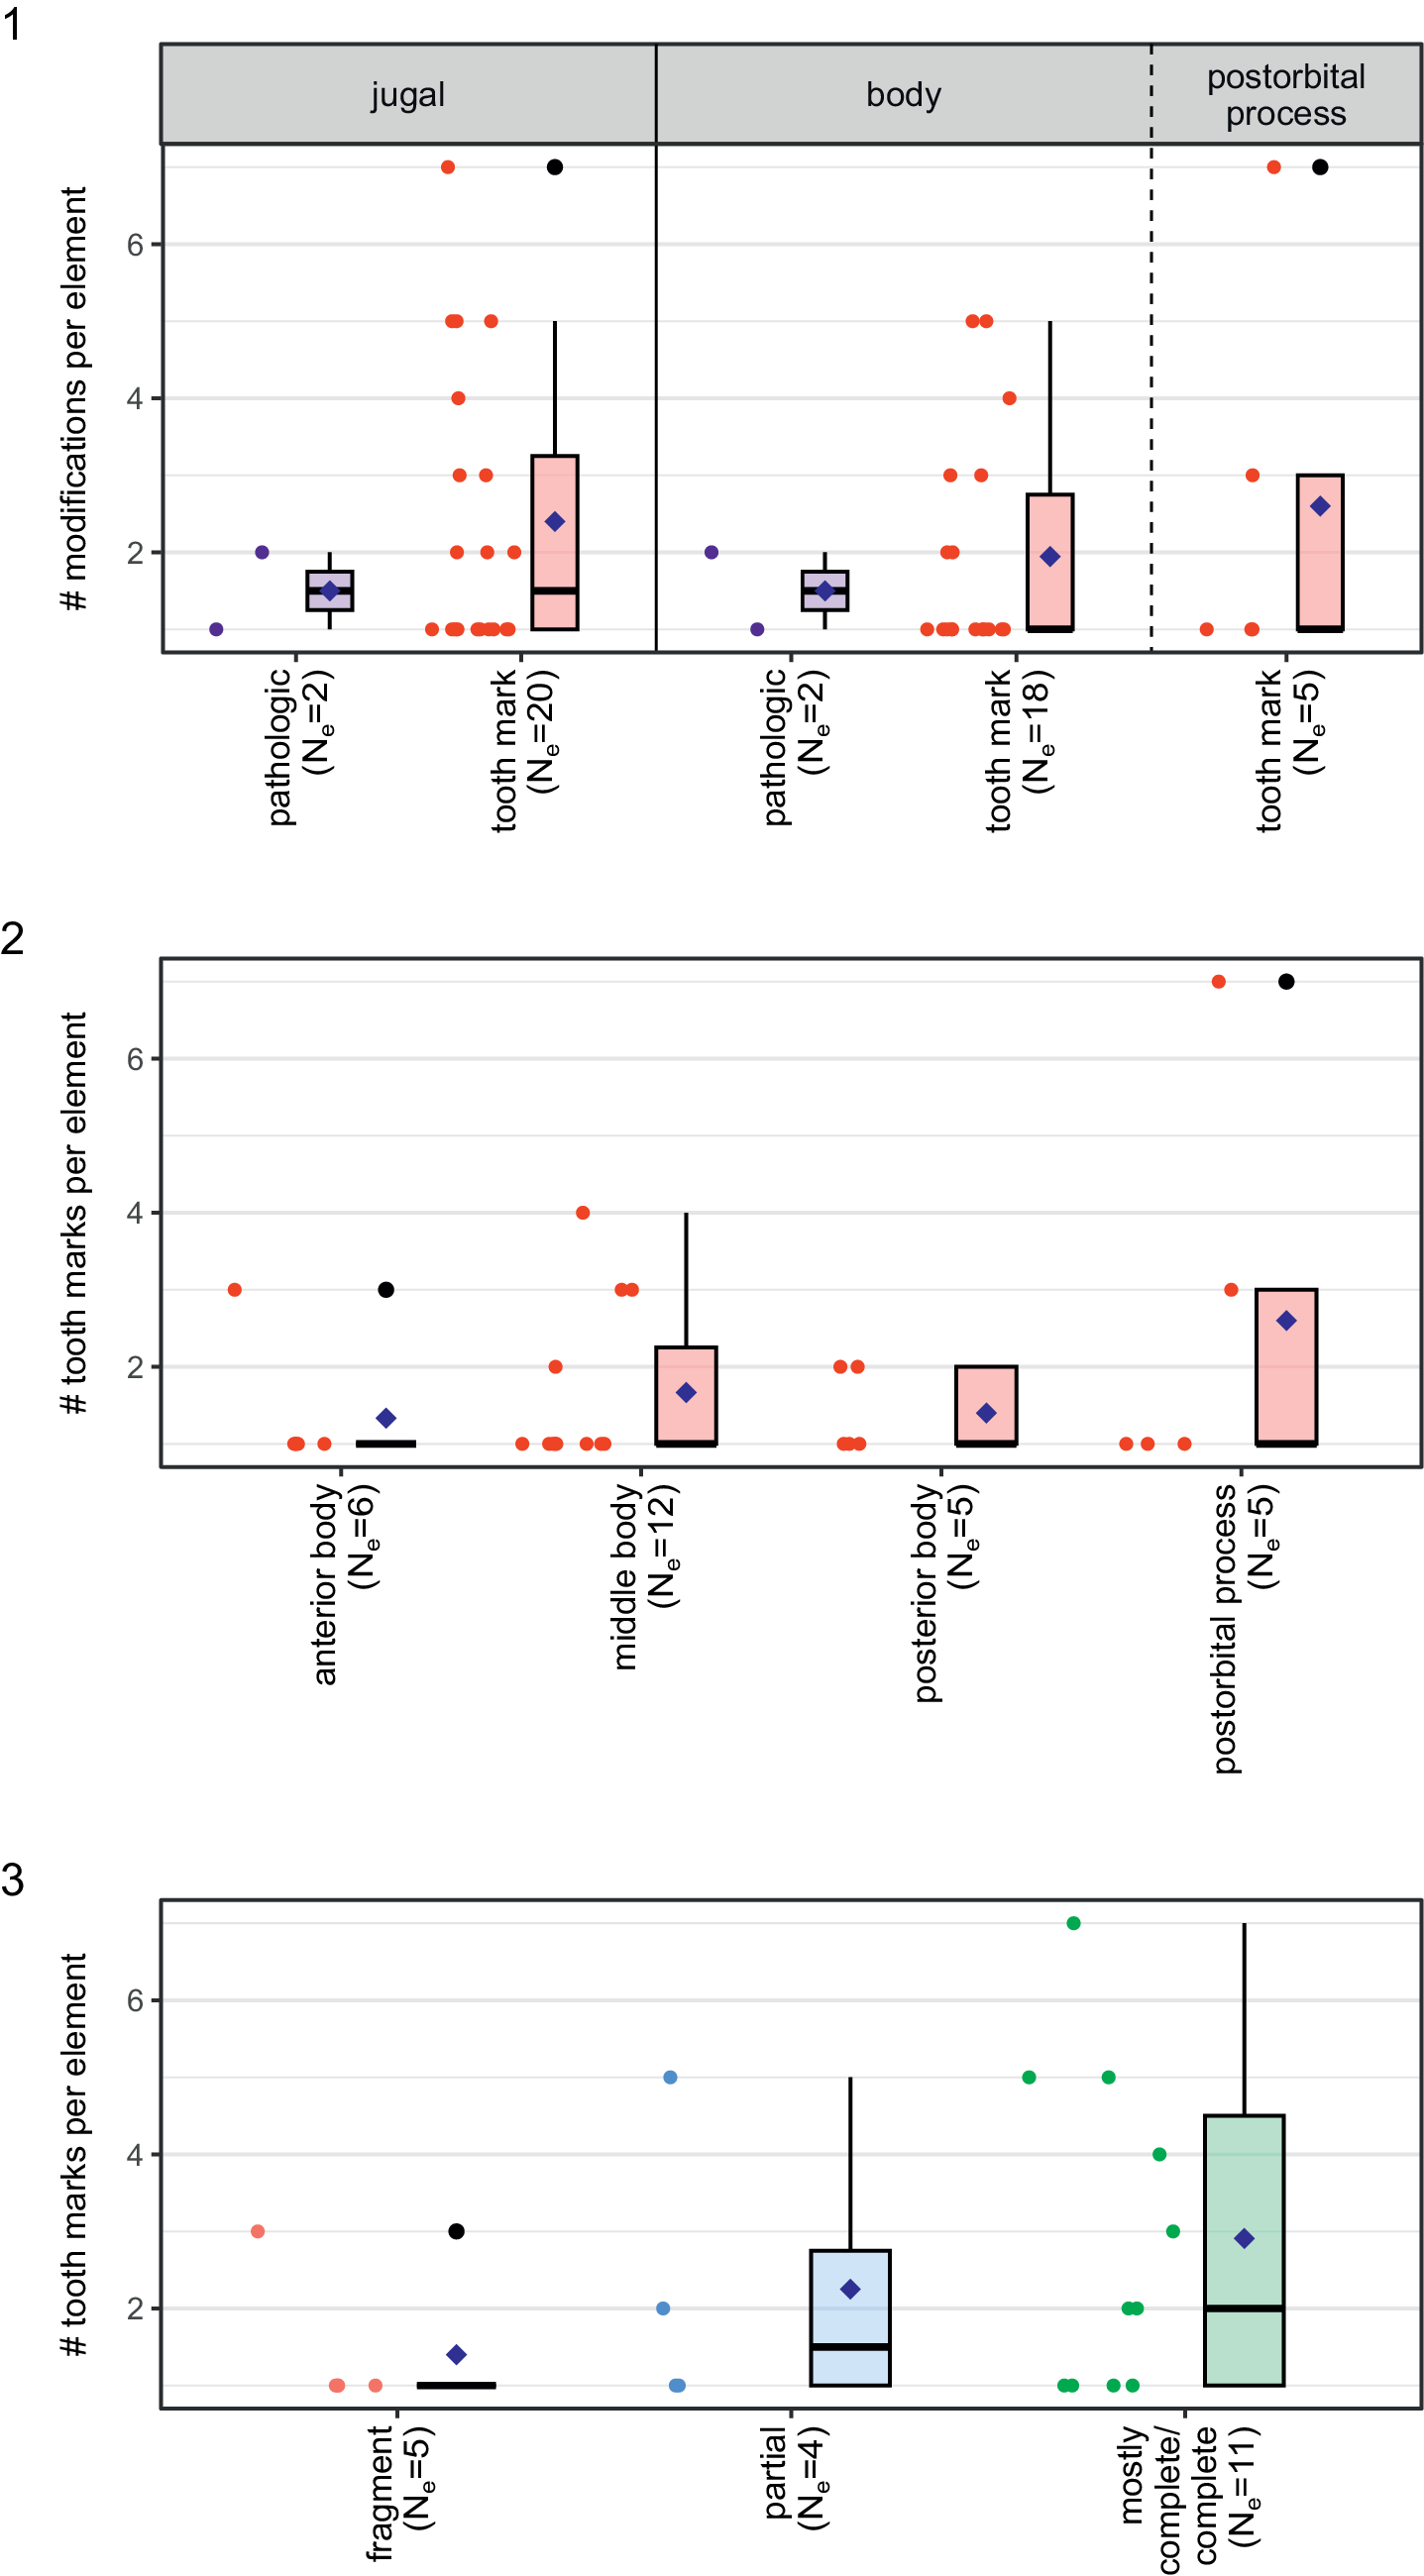





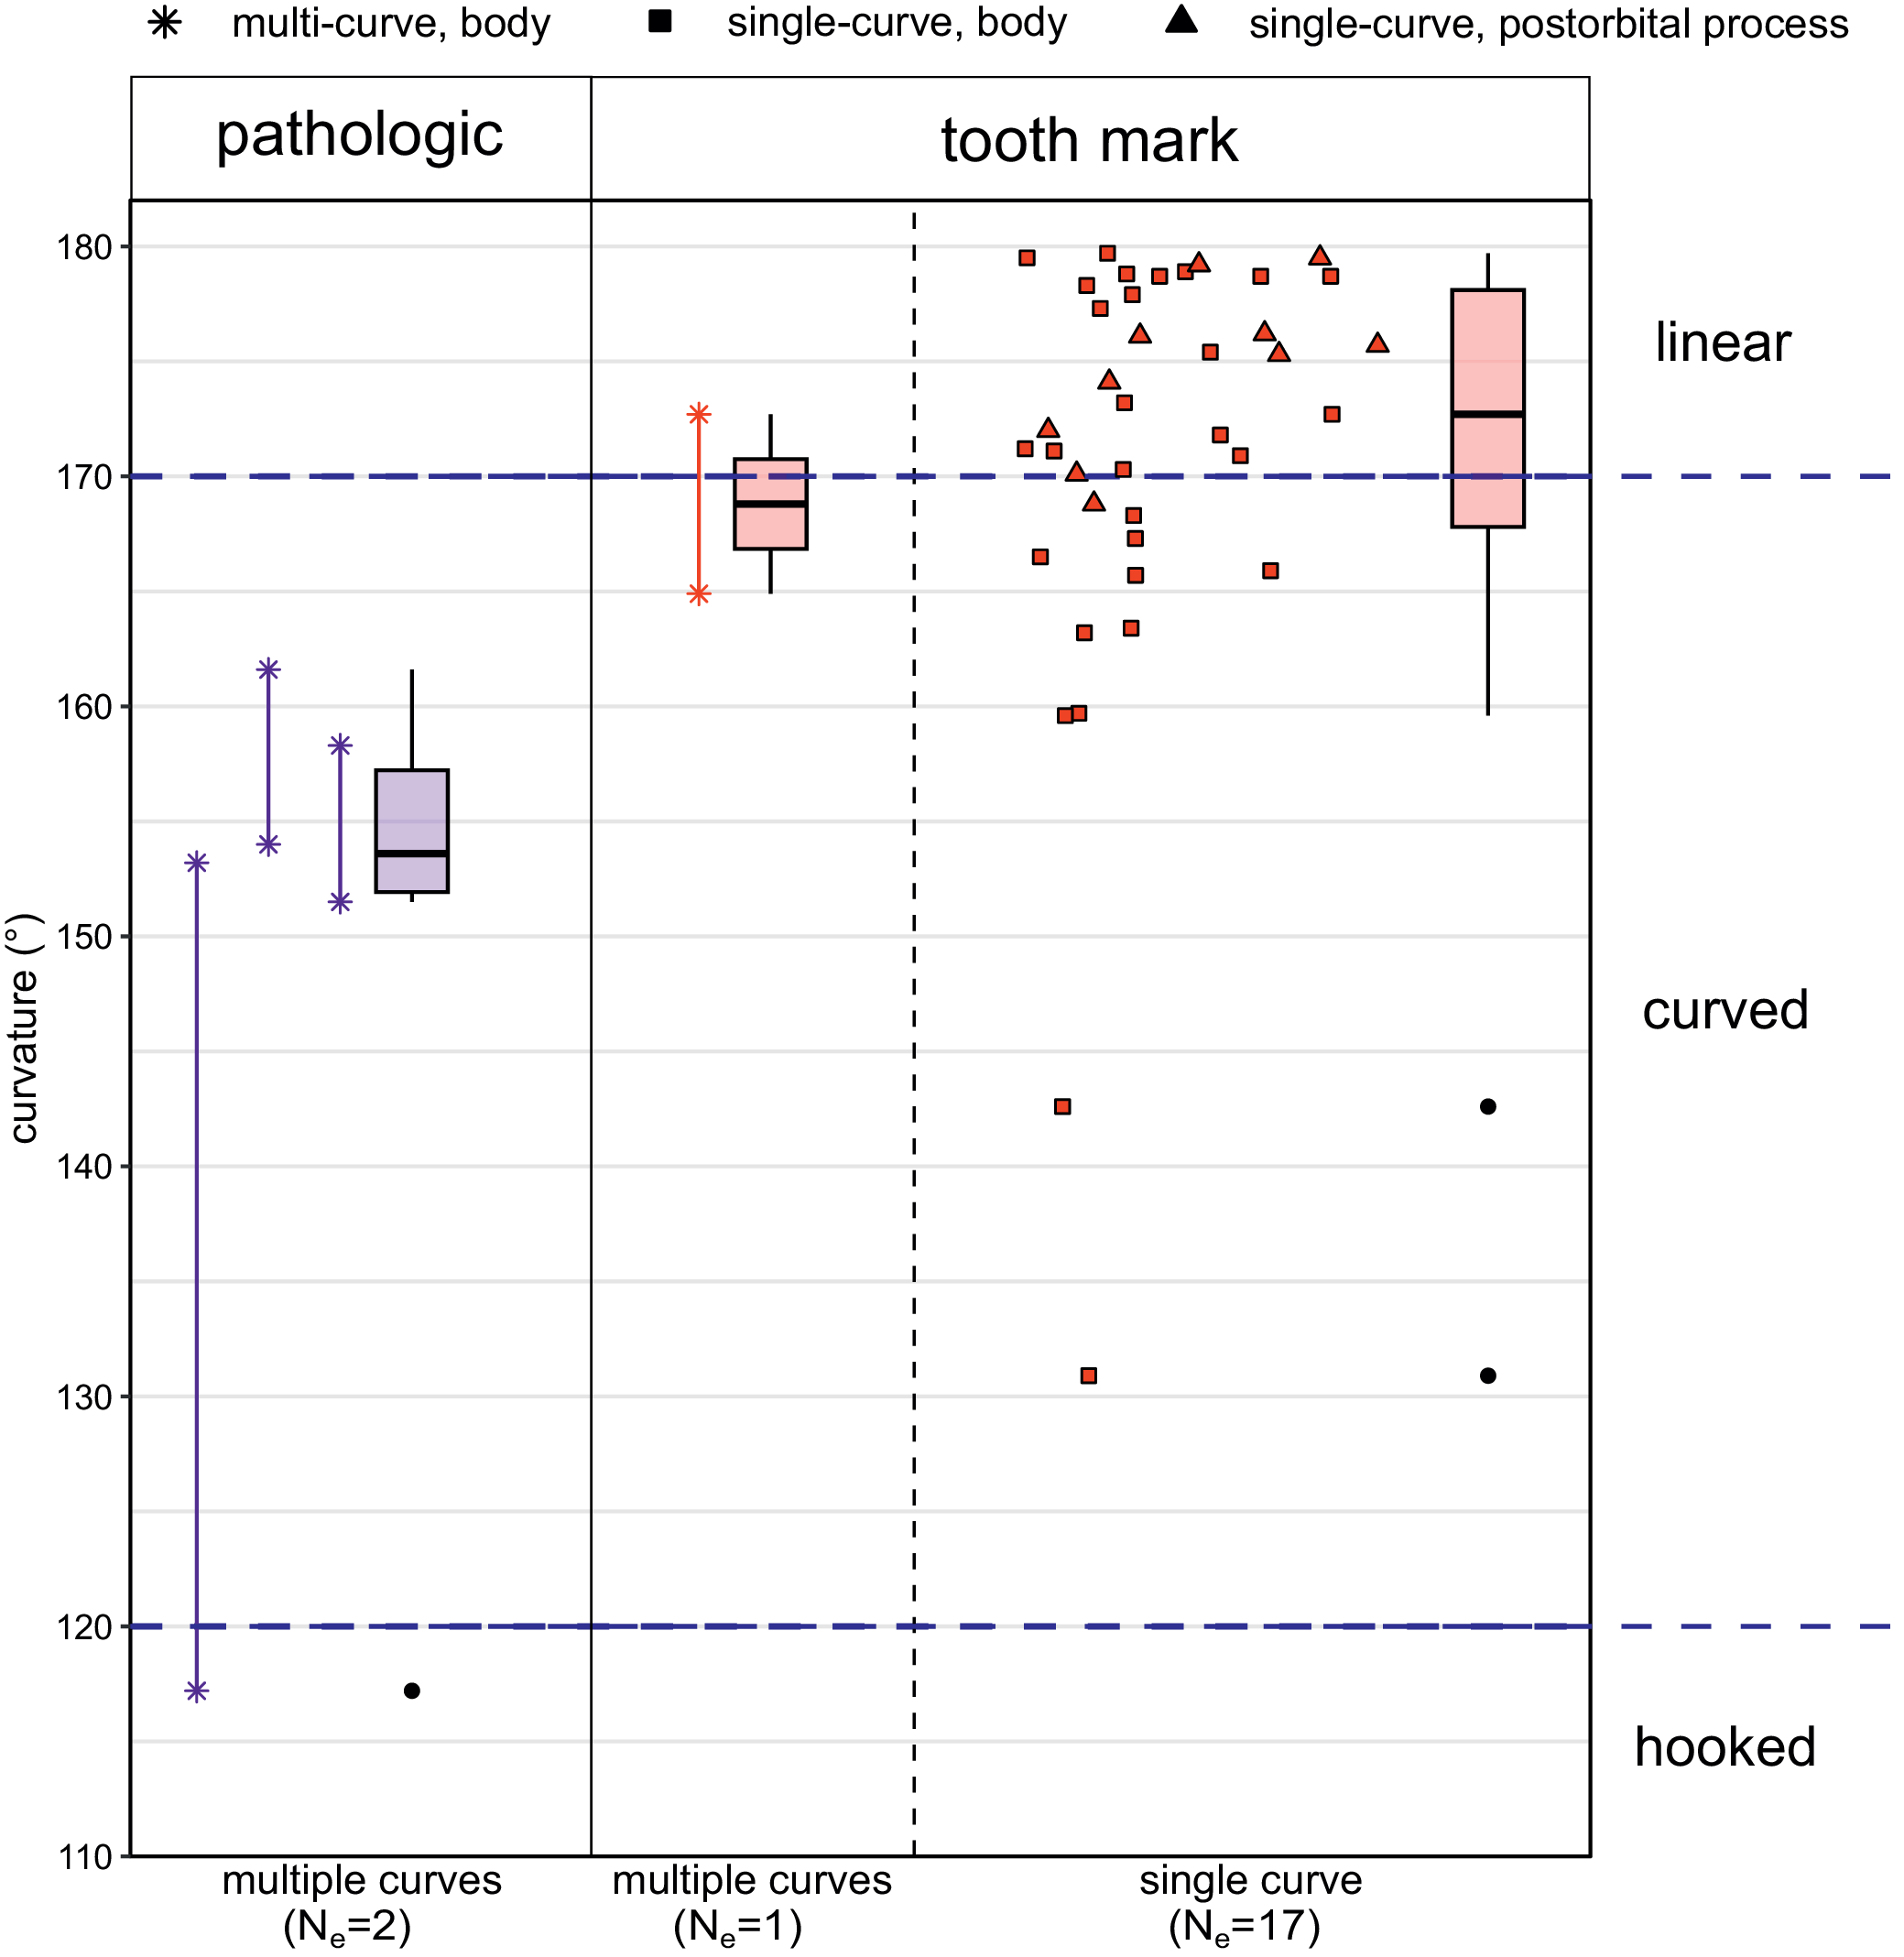

 Open access

