INTRODUCTION
There is increasing evidence that climate change will strongly affect the African continent particularly in its dry regions (Roudier et al., Reference Roudier, Sultan, Quirion and Berg2011). Smallholder agriculture will be strongly impacted (Lobell and Burke, Reference Lobell and Burke2008; Traore et al., Reference Traore, Corbeels, van Wijk, Rufino and Giller2013) given the limited adaptive capacity of regions dominated by poverty, subsistence farming, and a low agro-ecological potential (Galvin et al., Reference Galvin, Boone, Smith and Lynn2001). Although projected climate change and its impact on crop yields are subject to considerable uncertainties, there are strong indications that future changes in temperature and rainfall will negatively impact crop yields in sub-humid and semi-arid west Africa, with potential reductions in crop yields of up to 40% under a worst-case scenario of a 6°C increase in temperature and a 20% decline in rainfall (Sultan et al., Reference Sultan, Roudier, Quirion, Alhassane, Muller, Dingkuhn, Ciais, Guimberteau, Traore and Baron2013).
Adaptation is a key factor that will determine the future impacts of climate change on crop yields and food production, and adaptive capacity of farmers and their communities is widely recognized as a vital component of response to climate change. Without adaptation, climate change will hit the agriculture sector hard (Adger et al., Reference Adger, Huq, Brown, Conway and Hulme2003) whilst adaptation can soften the impacts (Waha et al., Reference Waha, Müller, Bondeau, Dietrich, Kurukulasuriya, Heinke and Lotze-Campen2013).
Possible technical adaptation options can range from relatively low-cost changes in crop or farm management, such as altering planting dates or changing to another existing crop variety, to more expensive measures, such as development of new crop varieties. Although other, more systemic, changes will be needed, including changes in social and institutional structures when it comes to adaptation to severe climate changes (Howden et al., Reference Howden, Soussana, Tubiello, Chhetri, Dunlop and Meinke2007), adaptations in crop management can be an effective way to cope with current and future climate variability that is within the reach of smallholder farmers.
Mineral fertilizer use, as part of integrated soil fertility management, is an essential component of sustainable intensification in the nutrient-limited environments of sub-Saharan Africa (Vanlauwe et al., Reference Vanlauwe, Wendt, Giller, Corbeels, Gerard and Nolte2014). However, use of fertilizer among smallholder farmers is limited, especially in rainfed agriculture, due to, inter alia, the risk associated with rainfall variability (Cooper et al., Reference Cooper, Dimes, Rao, Shapiro, Shiferaw and Twomlow2008). Hence, to increase farmers’ adaptive capacity, intensification and adaptation strategies should be coordinated, and based on an understanding of farmers’ exposure to risk (Simelton et al., Reference Simelton, Quinn, Batisani, Dougill, Dyer, Fraser, Mkwambisi, Sallu and Stringer2013). Smallholder farmers in the tropics have a long history of coping with climate variability and have developed many different ways of addressing it (Mortimore and Adams, Reference Mortimore and Adams2001) mostly ‘risk spreading’ in nature (Cooper et al., Reference Cooper, Dimes, Rao, Shapiro, Shiferaw and Twomlow2008). As farmers experience climate change not as a shifting mean but as climatic variations, the primary focus of an adaptation strategy should be the management of climate risk and variability (Howden et al., Reference Howden, Soussana, Tubiello, Chhetri, Dunlop and Meinke2007). This can be done by a combination of measures that on the one hand spread risk by minimizing losses in bad years and on the other hand grasp opportunities by maximizing outputs in good years.
Farmers’ perceptions of climate variability and change determine the type of management adaptation or technical option that is adapted to a large extent (Thomas et al., Reference Thomas, Twyman, Osbahr and Hewitson2007). Local knowledge and perceptions are not incompatible with more formal, scientific insights (Cleveland and Soleri, Reference Cleveland and Soleri2007). Rather, evidence suggests that farmers’ perception must be integrated with research information and proposed technologies in order to improve the adaptive capacity of smallholders (Sillitoe, Reference Sillitoe1998). Also with respect to climate variability, aligning scientific and farmer information can help to design relevant coping strategies (Simelton et al., Reference Simelton, Quinn, Batisani, Dougill, Dyer, Fraser, Mkwambisi, Sallu and Stringer2013). However, little is known about farmers’ perceptions of climate variability and change (Mertz et al., Reference Mertz, Mbow, Reenberg and Diouf2009), how these perceptions determine farmers’ assessment of options (Vedwan, Reference Vedwan2006) and how that affects the actual adoption of adaptation options. To guide future adaptation and to better comprehend farmers’ preferences, we need an understanding of past and current coping strategies.
This study aims to capture the perceptions of farmers in southern Mali, and together with these farmers evaluates adaptation strategies. Using open discussion and survey techniques, farmers’ perceptions on climate variability and change, impact of weather aspects on crop production and potential adaptation options for dealing with climate anomalies were identified. The effectiveness of altered planting dates in combination with the use of mineral fertilizer for coping with current climate variability was assessed through a 2-year field experiment conducted and evaluated with farmers.
MATERIALS AND METHODS
Study area
The study was conducted in the Try (12°35′N, 5°32′W, 335 m a.s.l.) and N’Goukan (12°27′N, 5°42′W, 409 m a.s.l.) in the Cercle de Koutiala, southern Mali. These villages were selected because of their representativeness of the region and their accessibility during all seasons. The climate of the study area is typical of the Sudano–Sahelian region. Average annual rainfall is around 850 mm, with a high inter-annual variability. The rainy season lasts from June to October with rainfall peaks in August. The dry season comprises a relatively cold period from November to February and a hot period lasting from March to May. The average maximum temperature is 34°C during the rainy season and 40°C during the hot dry period.
Cattle is a key component of the mixed crop–livestock farming systems in the study region. Eighty per cent of farmers own at least one pair of oxen, a cultivator and a seeder, and use animal traction for soil preparation, weeding and sowing (Sanogo, Reference Sanogo2010). The largest share of the cultivated land is allocated to cereal production. Sorghum (Sorghum bicolor (L.) Moench) and millet (Pennisetum glaucum (L.) R.Br.) are the main crops representing, respectively, 38% and 32% of the cultivated area, but maize (Zea mays L.) is also important covering 12%. The cereals are grown in a two- or three-year rotation with cotton (Gossypium hirsutum L.). Fertilizer and pesticides are mainly applied to cotton and maize. Millet and sorghum usually do not receive fertilizer but benefit in the crop rotation from previous fertilizer applications to cotton or maize.
The landscape of the study area consists of a rocky plateau and valley bottoms with slightly sloping land in between. The soils are mainly Ferric Lixisols with low clay content (<10%) in the top soil. Soils are in general moderately acidic with a pH of around 6 (Hazelton and Murphy, Reference Hazelton and Murphy2007). Our own soil characterisations indicate that the organic C content (4 g kg−1) is within the typical range (3–5 g kg−1) for the Sudano–Sahelian region (Veldkamp et al., Reference Veldkamp, Traore, N’Diaye, Keïta, Keïta and Bagayoko1991). Available P (17 mg kg−1) is above the critical level of 8 mg kg−1 that was established for cereal crops in the region (Veldkamp et al., Reference Veldkamp, Traore, N’Diaye, Keïta, Keïta and Bagayoko1991).
Perceptions of climate variability and change, and of impacts on crop production and adaptation measures
In line with Simelton et al. (Reference Simelton, Quinn, Batisani, Dougill, Dyer, Fraser, Mkwambisi, Sallu and Stringer2013), we combined group discussions, which allow capturing narratives that illustrate underlying causes and drivers, with household questionnaires, which better avoid bias resulting from climate-related probing questions (Mertz et al., Reference Mertz, Mbow, Reenberg and Diouf2009).
A workshop with farmers was organized to identify indicators of climate variability and change and their impact on crop production, and to discuss existing adaptation measures at crop and farm management level. From each village 12 farmers were selected and invited to join the workshop. The participating farmers were representative of the different farm types that co-habit in the region, ranging from small (less than 10 ha of land, no animal draught power) self-subsistence-oriented farms to larger (10 ha of land or more, with 1 or 2 pairs of draught oxen) more market-oriented farms. Interviewed farmers that were older than 50 years were able to relate weather events with important political events in the past, such as the country's independence or a change of a president.
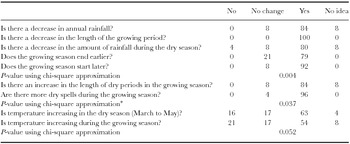
Based on the findings of the workshop discussions, a follow-up formal survey was carried out with the same farmers to quantify the prevalence of farmers’ perceptions. Climate change indicators included changes in rainfall, temperature, wind speed and growing season conditions (Table 1). Farmers’ perceptions of climate variability and change were compared with observed long-term (1945–2005) meteorological data from the weather station at the N’Tarla Agricultural Research Station, situated at about 50 km from the two villages.
Percentage of farmers perceiving a change in different climate indicators in N’Goukan and Try, Mali.

Number of respondents = 24.
*Friedman's test.
On-farm experiments
To evaluate the option most preferred by farmers to adapt to climate risk, in combination with increased fertilizer use, trials were conducted in 2010 on 14 and 11 farmers’ fields for millet and maize, respectively. In 2011, the trials were conducted on the fields of 10 and 8 farmer's fields, respectively (Table in Appendix 1 available online at http://dx.doi.org/10.1017/S0014479714000507). Farmers decided to experiment with staggering planting dates for maize and millet in combination with current and recommended fertilizer application rates. Maize was chosen because it is less sensitive to drought than cotton, and is both a cash and food crop. Millet was chosen because it can be grown without the use of mineral fertilizer and because of cultural considerations related to taste and diet.
Farmers also decided which crop varieties to test. Maize variety Suwan 1 SR (CIMMYT/IITA), known as ‘Sotubaka’ in Mali, was chosen. It has a growth cycle of 110–120 days, and a maximum height of 2.5–3 m. For millet, farmers preferred to experiment with their local variety ‘Kolonada’ with a growth cycle of 120 days and ear length of 60 cm.
Two fertilizer treatments were compared: the ‘Recommended Practice (RP)’ according to the recommendations by the national research institutes and the ‘Farmer's Practice (FP)’. In the RP treatment each crop received the recommended rates (IER/CMDT/OHVN, 1998) of compound NPK (16–16–16) fertilizer at planting and urea (46% N) at 40 days after planting. Accordingly, maize received a total of 85 kg of N ha−1, 16 kg of P ha−1 and 16 kg of K ha−1, and millet 39 kg of N ha−1 8 kg of P ha−1 and 8 kg of K ha−1. For the FP treatment the rate of fertilizer varied from one farmer to another.
The experiments were conducted on small adjacent plots of 56 m2 comprising seven rows of 10 m length. Cropping operations (e.g. weeding, hilling, ridging, harvesting) were carried out according to the current farmer practice both in RP and FP. Three planting dates were tested to cover the possible planting windows for maize and millet in southern Mali: an early planting date in June (D1), a medium planting date in July (D2) and a late planting date in August (D3). Small variations in the different planting dates were allowed to accommodate farmers’ labour availability. Farmers were split into three groups according to the three planting dates. However, in 2010, farmers in the D3 group did not want to delay planting until August, and planted in July. In 2011, the three planting dates were executed, but only in the RP treatments.
Yield was estimated from a net plot of 24 m2 (3 rows of 10 m length) in the centre of the plot to avoid border effects. Over the two years of the experiment, daily rainfall on each individual field was measured with a rain gauge by a trained family member of the farm household. Soil samples were taken from a depth of 0–20 cm at each field before the start of the rainy season (April–May) in 2010 and analysed for pH, soil organic C and available P (Table in Appendix 1 available online at http://dx.doi.org/10.1017/S0014479714000507).
The profitability of treatments was assessed based on gross margin, calculated as the income minus the variable cost of production. The price of mineral fertilizer (compound and urea) was 250 CFA per kg, and the average selling prices of maize and millet were 180 CFA and 125 CFA kg−1 grain (OMA, 2012), respectively. We compared gross margins obtained across farmers’ fields over the two years of the experiment and investigated the sensitivity of profit risk to changes in market prices. By keeping the grain prices constant, grain: fertilizer price ratios of 1:1, 1:2 and 2:1 were generated by varying the fertilizer price.
Statistical analysis
The effect of fertilizer treatment (RP and FP) and location (the village of Try and N’Goukan) on grain yields of maize and millet were analysed using ANOVA procedures for a split-plot design (GenStat Edition 14th Library Release Pl 18.2, VSN International Ltd). Villages were chosen as the main (fixed) factor and fertilizer treatment as the sub-plot (fixed) factor. Farm was considered as a random factor. The Restricted Maximum Likelihood procedure was used to test the individual effect of fertilizer treatment (RP and FP), mineral fertilizer (N), pH, soil organic C, soil C to N ratio, available P, planting date and rainfall on the grain yields of maize and millet. For each crop the analysis was performed for 2010 and 2011, separately. Friedman's test (a non-parametric test used to statistically evaluate scoring tests) was used to assess differences between farmers’ perceptions of changes in climate indicators.
Evaluation of the experiment by farmers
At the end of the field experiment a group discussion was organized with all 24 farmers to evaluate the main results of the experiment. Farmers gave their opinion on the difference between the yields obtained with the recommended and the farmer's practice. The main lessons learned with respect to climate risk management were also formulated.
RESULTS
Farmers’ perceptions
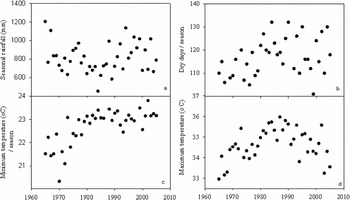
Climate change: The majority (84%) of the farmers at the workshop claimed that total annual rainfall is decreasing in the region, and this group was significantly larger than the groups perceiving no or positive change (Table 1). Only 8% of the farmers reported no change and attributed this view to the high year-to-year variability. Observed data at the N’Tarla Experimental Station showed large inter-annual variability (coefficient of variation (CV) = 20%) with no significant trend in the rainfall over the 1965–2005 period. However, between 1965 and 1993, a nearly significant (p = 0.06) decrease in seasonal rainfall was observed (Figure 1a), which corresponds with farmers’ perception of declining rainfall.
Variation in climatic variables between 1965 and 2005 at N’Tarla, in southern Mali. (a) Regression of seasonal rainfall and year: Y = −0.12× + 1045.38 (r = −0.13, n = 41) (b) Regression of seasonal dry days over the period 1965–2005: Y = 0.2× −350 (r = 0.33*, n = 41) (c) Regression of seasonal minimum temperature and year: Y = 0.05× −68.34 (r = 0.70***, n = 41), and (d) Regression of seasonal maximum temperature and year: Y = 0.014× −6.26 (r = 0.20, n = 41).

All farmers felt that the cropping period had shortened and 80% reported a decrease in the rainfall during the dry season. The majority of the farmers mentioned that the change in the rainy season is characterized by a later onset (92% of the respondents), and an earlier end (79%), thus explaining the shortening of the rainy season (Table 1). All these differences were statistically significant. Nearly all farmers claimed that dry spells during the rainy season became longer (84%) and more frequent (96%). These perceptions corresponded with weather records at N’Tarla showing that the number of dry days indeed increased significantly between 1965 and 2005 (p < 0.05) (Figure 1b).
About half of the farmers found that there was an increase in temperature during the dry season as well as the rainy season. Seasonal minimum and maximum daily air temperature increased significantly (p < 0.01) over the period 1965–2005 at N’Tarla with an average rise of, respectively, 0.05°C and 0.01°C per year (Figure 1c and d).
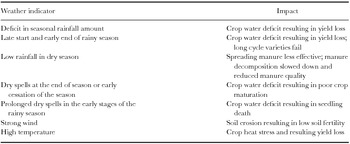
Impacts of weather anomalies on crop production: The main weather anomalies mentioned by farmers that impact crop production were related to the seasonal rainfall pattern (Table 2), i.e. a late start or an early end of the rainy season, low seasonal rainfall, and the occurrence of dry spells. Strong winds and high temperatures were also perceived as causing damage to crops (Table 2). In general, crop production was affected through poor seed germination, full crop failure as a result of drought or damaged crops due to strong winds.
Farmers’ perceptions of impacts of weather anomalies in Try and N’Goukan, Mali.

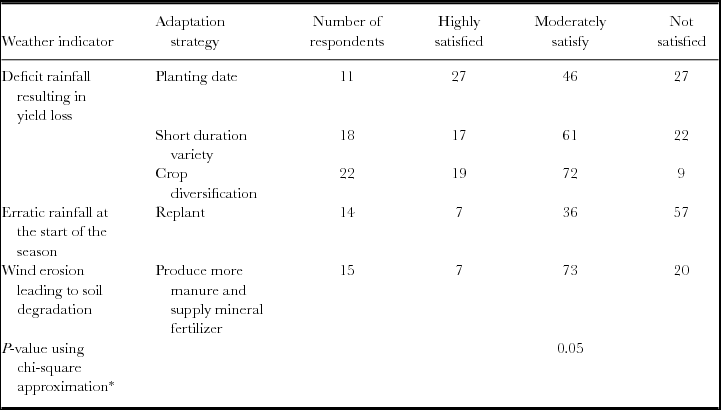
Adaptation measures and their drawbacks: The most common measures to cope with weather anomalies in cropping systems included adjusting planting time, use of short-duration varieties and crop diversification (Table 3). Although more than 50% of the farmers were at least moderately satisfied with later planting, around 25% were not, mainly because of a reduction in grain yields. The dissatisfaction (by 22% of farmers) about the use of short-duration varieties compared with the local varieties is related to their susceptibility to fungal diseases during storage of the grains. Reseeding was mentioned as an adaptation measure to early-season dry spells, but more than 50% of farmers were not satisfied with this because it implies extra costs (seed) and labour at times of peak labour demands. The common practices for soil fertility improvement, such as applying manure and mineral fertilizer were mentioned as a means to rehabilitate degraded soils and prevent wind erosion. However, 93% of the farmers were only moderately or not satisfied with these practices, because of the lack of cattle or equipment (cart) for the production and transportation of the manure to the fields, which could be situated up to 5 km from their homes. Also the high cost of mineral fertilizers was mentioned as a drawback.
Percentage of farmers highly, moderately or not satisfied with adaptation measures to deal with weather anomalies in Try and N’Goukan, Mali.

*Friedman's test.
On-farm experimentation
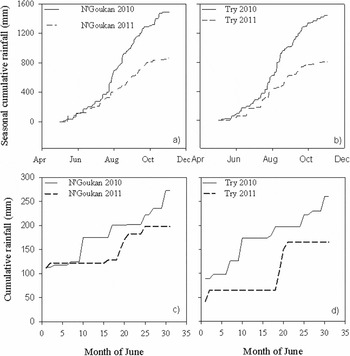
Rainfall: Seasonal rainfall was very similar at N’Goukan and Try and characterized by low spatial variation. In 2010, at N’Goukan, the average rainfall across farms was 1465 mm with a CV of 3%, while at Try the average rainfall was 1358 mm with a CV of 4%. In 2011, at N’Goukan, the average rainfall was 806 mm with a CV of 6%, whereas at Try 829 mm was recorded with a CV of 8%. The difference between both years was high: rainfall recorded in 2010 was 45 and 39% higher than that recorded in 2011 at N’Goukan and Try, respectively. In 2011, after the first rainfall there was a series of 13 and 16 continuous dry days at N’Goukan and Try, respectively (Figure 2).
Cumulative rainfall during the growing season (a and b) and at the start of the growing season during the month of June (c and d) in 2010 and 2011 at N’Goukan and Try.

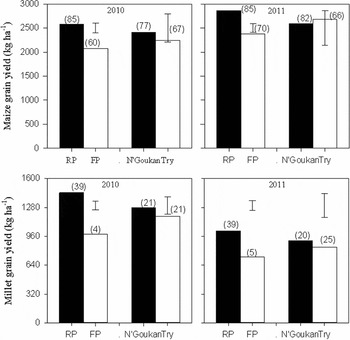
Yield determinants: Both in 2010 and 2011, maize and millet grain yields obtained with RP were significantly larger than those with FP (p < 0.05), while the differences in yields between the villages were not significant (Figure 3). Maize yields in both years were hardly different, whereas larger millet grain yields were obtained in 2010 than in the shorter 2011 growing season when late season drought stress negatively affected grain filling (Figure 3).
Yield of maize and millet with Recommended Practice (RP) and with Farmer Practice (FP). Value in between parentheses indicates the average amount of chemical N applied (in kg ha−1). Error bars show the SED (Standard Error of the Difference).

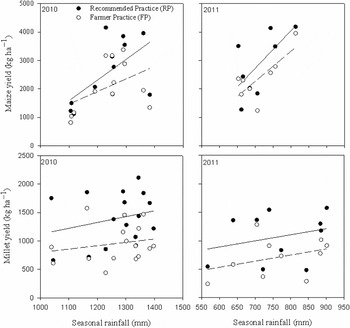
There was a positive relationship between the grain yield of maize and seasonal rainfall recorded from planting date till harvest (Figure 4). The correlation was significant in 2010 for maize with RP (p = 0.04), but not with FP (p = 0.13). In contrast, the relationship was significant in the drier year 2011 for both RP (p = 0.07) and FP (p = 0.03) indicating the sensitivity of maize yield to the seasonal rainfall amount. For millet, no significant correlations were found between yield and seasonal rainfall, neither in 2010 nor in 2011 for RP and FP. Differences in seasonal rainfall were caused by differences in planting date and not by spatial rainfall variability across the farms.
Scatterplots of maize and millet yield against seasonal rainfall recorded from planting until harvest with fitted regression lines for Recommended Practice (RP, full line) and Farmer Practice (FP dashed line). Note the different scales of the Y-axes for the crops. In 2010, data for the first (D1) and second (D2) planting date are shown, and for 2011, only D1 data are shown.

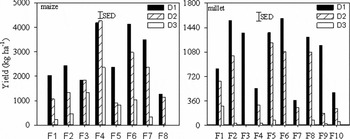
In 2011, maize grain yield at early planting (D1) was significantly higher than that obtained at medium planting (D2), which was in its turn significantly higher than that at late planting (D3) (p < 0.01) (all RP). However, even with the same planting date, the variability in maize grain yields across farm fields was high (Figure 5). Also in the case of millet, grain yields decreased significantly (p < 0.01) with a delay of planting, and varied significantly from one field to another, even if planted at the same time (Figure 5).
Yield of maize and millet in 2011 with the recommended practice at farmers’ fields (F) and three planting dates (D1 earlier planting, D2 medium planting and D3 late planting). Note the different scale of the y axis between the two graphs. SED = Standard Error of the Difference.

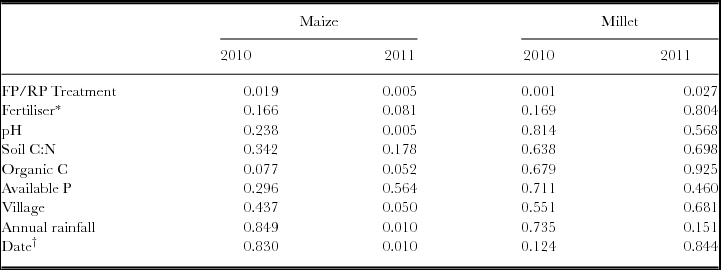
The mixed linear model analysis indicated that in both years there was a significant effect of fertilizer treatment (FP or RP) and of soil organic C content on maize grain yield. In addition to these variables, there was a significant effect of pH on maize yield in 2011 (Table 4). Under farmer practices, there was a significant relationship between maize yield and mineral N fertilizer in 2011 (p < 0.10). Nitrogen supplied as urea was more effective (p < 0.05) than that of compound fertilizer (p > 0.10, not shown). For millet, apart from the fertilizer treatment (FP or RP), there was no significant effect of the other variables neither in 2010 nor 2011 (Table 4).
p-values for the different variables explaining the variability in observed on farm experimental yields of maize and millet. Values were calculated using the Restricted Maximum Likelihood procedure.

*Comparison restricted to FP. The number of observations is 10 and 7 for maize in 2010 and 2011 respectively. For millet it is 15 and 10 in 2010 and 2011 respectively.
†Comparison restricted to RP.
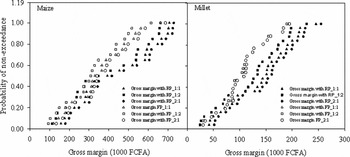
Gross margin analysis: Gross margins obtained with maize ranged from about 100,000 to 750,000 FCFA across farmers’ fields and both years. The cumulative probability distribution of gross margin of maize indicated that for about 55% of fields, the gross margin obtained with RP was significantly larger (p = 0.004) than that obtained with FP. However, for the remaining 45% of the fields, there was no noticeable improvement in gross margin with recommended fertilizer rates (Figure 6).
Cumulative probability distribution of maize and millet gross margin for different grain: fertilizer price ratios. For maize: 1:1 = 180FCFA/180FCFA; 1:2 = 180FCFA/360FCFA; 2:1 = 180FCFA/90FCFA For millet: 1:1 = 125FCFA/125FCFA; 1:2 = 125FCFA/250FCFA; 2:1 = 125FCFA/60FCFA RP: Recommended practice, FP: Farmer Practice. Note the different scale of the x-axis between the two graphs. Data include yields from 2010 and 2011.

Millet gross margins were much poorer, ranging from 50,000 to 250,000 FCFA. On about 70% of the millet fields, better gross margins were obtained with recommended fertilizer rates as compared with current farmer practices. Conversely, no response to fertilizer was obtained on about 30% of the millet fields (Figure 6). On fields with a weak response to fertilizer, changes in grain: fertilizer price ratios affect gross margin probability to a similar extent as changing fertilizer application rates. However, where a response can be expected, price fluctuations alter the resulting effect on gross margins only to a small extent (Figure 6). For both millet and maize, the variability across fields is more important than the variability resulting from price fluctuations.
Farmer's evaluation of the experiments
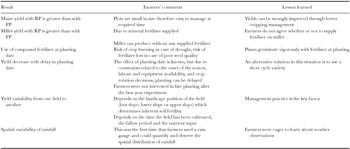
Farmers attributed the performance of RP both with maize and millet to timely crop management, which, according to them, was easy to achieve on the small experimental plots (Table 5). This means that the feasibility of the tested adaptation options on larger areas depends not only on the inputs, but also on the availability of labour and equipment.
Farmers’ evaluation of the experiment (Recommended Practice (RP) and Farmer Practice (FP).

It was unanimously agreed that mineral fertilizer is the key factor for increasing maize and millet yield in the region. However, due to its high price and the risk of no response farmers currently prioritize maize to receive fertilizer over the other cereals. Most farmers do not use mineral fertilizer on millet, because they think that millet can also yield without nutrient inputs. In the fields with the RP treatment, compound fertilizer was used at planting as recommended by the national agricultural research institute. However, this is costly and labour demanding and therefore not part of farmers’ current practice, which is geared to planting a large area in a short time. Instead, farmers prefer applying fertilizer at crop emergence as a climate risk management strategy. Indeed, later fertilization saves resources in case of a long dry spell after planting or low germination rates due to poor seed quality. To some extent it also helps to schedule the use of available labour.
Farmers are aware of the negative effect of delaying planting of maize and millet on crop yields. However, in certain circumstances, such as equipment constraints or peak labour demands when the season starts late, they are forced to delay planting. Short-duration varieties are an alternative solution in this situation, ensuring at least a modest yield. Yield variability between farms was largely attributed to the capacity of the household to apply proper crop management. The main factors included timely ploughing when the soil is wet, timely planting and the application of mineral fertilizer on the recommended date. For instance, a farmer with no equipment (cart, plough) and lack of cattle will have to rely on others, which can cause a delay in cropping activities and a poor response to actual weather conditions.
DISCUSSION
Farmers’ perceptions
Farmers perceived an increase in the occurrence of unfavourable weather conditions, which was confirmed through our analysis of observed historical weather data in southern Mali showing an increase in inter-annual rainfall variability and the number of dry spells during the growing season. These results concur with those of Cooper et al. (Reference Cooper, Dimes, Rao, Shapiro, Shiferaw and Twomlow2008), Deressa et al. (Reference Deressa, Hassan, Ringler, Alemu and Yesuf2009) Simelton et al. (Reference Simelton, Quinn, Batisani, Dougill, Dyer, Fraser, Mkwambisi, Sallu and Stringer2013) and Rurinda (Reference Rurinda2014) for several other countries in sub-Saharan Africa.
Farmers’ perceptions of a change in annual rainfall could be caused by the increase in the year-to-year variability of seasonal rainfall (Balme et al., Reference Balme, Vischel, Lebel, Peugeot and Galle2006). Findings by Diggs (Reference Diggs1991) support the hypothesis that changes in environmental variability are often accompanied by perceived changes in absolute terms. Furthermore, farmers often over-estimate the frequency of unfavourable weather events (Cooper et al., Reference Cooper, Dimes, Rao, Shapiro, Shiferaw and Twomlow2008) and might confuse changes in rainfall with changes in the sensitivity of the cropping system due to other unfavourable changes (Simelton et al., Reference Simelton, Quinn, Batisani, Dougill, Dyer, Fraser, Mkwambisi, Sallu and Stringer2013).
For temperature, farmers’ perception of a substantial increase matched the empirical observations for the region well. Farmers linked the temperature increase to a change in the number of dry days in the growing season, as these are perceived to be hot.
Climate variability is often given as the main reason for crop failure and food shortages (Sultan et al., Reference Sultan, Baron, Dingkuhn, Sarr and Janicot2005). Irregular rainfall distributions may expose the crop to a range of mild to severe intra-seasonal water stresses, which may subsequently affect the yield especially if they occur during the critical stages of flowering and grain filling. This relation between weather anomalies and crop production was also acknowledged by the farmers in this study, and illustrates that farmers look at meteorological events through an agronomic lens (Simelton et al., Reference Simelton, Quinn, Batisani, Dougill, Dyer, Fraser, Mkwambisi, Sallu and Stringer2013).
In order to cope with the unpredictable nature of the weather, farmers acknowledged the potential of various adaptation measures that can be applied mostly before and during the season (Matlon, 1988). The options identified by the farmers in this study corresponded well with the ones identified in another study by Ghanaian farmers, who also mentioned early planting as the most important strategy to cope with climate variability (Adjei-Nsiah, Reference Adjei-Nsiah2010).
Role of planting date as an option for adaptation to climate variability
Perceived and observed changes in the climate in southern Mali were manifested mainly through increased variability. As planting date adjustment was the preferred option for managing this variability, it was included in the on-farm trial in combination with fertilizer treatments. The role of climate in the two years of the trial could be investigated only to a minor extent, because both years received above average rainfall. For maize, yields in both years were not significantly different: although drought occurred in the 2011 planting period, maize recovered because of the good rainfall distribution later on, allowing maturity before the cessation of rain. Nevertheless, we found a positive effect of growing season rainfall, except for FP in 2010 (Figure 4), which highlights the importance of planting date. Other studies also showed that late planting of maize results in significant yield loss (Kamara et al., Reference Kamara, Friday, David and Lucky2009).
For millet, yields in the shorter growing season of 2011 were low because the maturity period coincided with the end of the rain. Here, the effect of planting date (Figure 5) is related mostly to this timing of the maturity period, rather than to the total amount of growing season rainfall, for which no effect was found (Figure 4). The latter absence of rainfall effect is not surprising for a drought-resistant crop like millet in the wetter than normal conditions of 2010 and 2011.
Our results confirm that the onset of the rainy season is the most important driver of agricultural management (Ingram et al., Reference Ingram, Roncoli and Kirshen2002). It directly affects crop management practices, especially planting date, which has a significant effect on crop yield. The decline in yields of maize and millet as planting is delayed, suggest an important role for timely planting in dealing with the year-to-year variability of the weather. To take advantage of early planting, farmers even conduct ‘dry planting’ before the rains start. This practice is used with millet and tends to ease the general labour shortage at the first rains. Early planting, however, can be risky, because of the occurrence of early-season dry spells. However, Traore et al. (Reference Traore, van Wijk, Descheemaeker, Corbeels, Rufino and Giller2014) indicated that there is some flexibility in the timing of planting in the Sudano–Sahelian region. For example, the planting of maize can be delayed up to 30 days from the first of June without significant yield loss, thus leaving some room for farmers to adjust crop management activities to labour and equipment availability.
Intensification as an option for adaptation to climate variability
Farmers’ evaluation of the experiment indicated that the size of farm fields plays an important role in the potential for intensification. The limited financial and labour resources of a typical family in comparison with the relatively large cropped area result in small rates of agricultural inputs and delays in cropping activities. Our results showed that by using the recommended rates of mineral fertilizer and avoiding planting delays, the yield and gross margin of maize and millet can be substantially increased.
However, our gross margin probability analysis indicated that increasing current to recommended fertilizer rates does not increase the profitability in 30 and 45% of the cases for millet and maize, respectively. This risk of no response together with limited access to input markets and financial resources explains the current low application rates. The higher risk of a low gross margin in case of low grain: fertilizer price ratios further highlights the important role of national institutions to facilitate stable farmer access to affordable fertilizers.
Intensifying agriculture through increased nutrient application can be seen as an adaptation option to climate change, as resulting higher yields especially in favourable years, could provide options for grain storage and the evening out of crop failure risks related to year-to-year rainfall variability (Milgroom and Giller, Reference Milgroom and Giller2013). Even though our study shows a larger grain yield improvement potential per unit of N input for maize than for millet, the poorer storage capacity of maize than of millet would need to be addressed.
Furthermore, proper adaptation requires an integrated approach as there is an important interaction between fertilizer use efficiency and planting date (Traore et al., Reference Traore, van Wijk, Descheemaeker, Corbeels, Rufino and Giller2014). Rurinda et al. (Reference Rurinda, Mapfumo, van Wijk, Mtambanengwe, Rufino, Chikowo and Giller2013) reported that with a substantial delay in planting, soil fertility management cannot compensate yield losses.
Helping smallholder farmers to deal with climate variability
The current farmers’ understanding of climate and prediction of weather is mostly based on indigenous knowledge, which can be considered as a kind of legacy and heritage from the farmers’ forebears. In general, indigenous knowledge can be helpful but may lead to bias, especially with highly variable factors, like climate variables (Nicholls, Reference Nicholls1999). With current easy-to-use and cheap tools and technologies opportunities exist to complement indigenous knowledge with science-based observations and predictions (Cooper et al., Reference Cooper, Dimes, Rao, Shapiro, Shiferaw and Twomlow2008).
The adaptation strategies tested in this study were focused on technical crop management aspects, but the successful dissemination and adoption of risk management strategies will involve a variety of private initiatives, policy measures and institutions (Lybbert and Sumner, Reference Lybbert and Sumner2012). More systemic changes in resource allocation need to be considered. Given the complexity of managing the interactions between crop production and climate risk, successful adaptation requires a multidisciplinary approach involving many stakeholders including practitioners, policymakers, and scientists (Howden et al., Reference Howden, Soussana, Tubiello, Chhetri, Dunlop and Meinke2007).
Crop management would benefit from extension and national weather services collaborating in the establishment of early warning systems and in the improvement of the current climate predictions, resulting in information that is meaningful for local farmers. The growth in the use of mobile phones in rural Mali constitutes new opportunities for access and dissemination of information. The recent launch of the project ‘Senekela’ of the mobile company ‘Orange Mali’ is an initiative that aims at facilitating the access of farmers to information via the mobile phone. It could enable farmers to benefit from the variety of information relevant for each stage of the agricultural production process, ranging from weather forecasts, seed and fertilizer availability, to pest and disease occurrence. Evidence from Kenya shows that it is possible to reach millions of farmers with climate services that support decision-making under a changing climate by using mobile phones (Aker, Reference Aker2011). Improved weather information increases the ability of farmers to take appropriate actions to face adverse weather events and improve the timing and management of inputs in ways that reduce financial and production risks.
CONCLUSIONS
Farmers are aware and conscious of climate variability and change and view it as a real risk to their livelihood. Their agricultural practices could be improved by use of forecasted weather data, enhancing the agility to tackle challenges posed by climate change and variability. Drought tolerant, short maturing crop varieties and appropriate planting date were the commonly preferred adaptation strategies to year-to-year variability in the current weather conditions. These risk-spreading strategies can be combined with fertilizer management taking advantage of favourable conditions, which seems central to developing tactical and strategic measures to cushion farmers against the potential impact of climate change and increased climate variability. Yields can be increased through improved crop management, but the feasibility of options depends on the availability of labour, equipment and access to inputs such as mineral fertilizer and short duration varieties. Training of farmers and providing information on weather and climate-related aspects like the onset of rains is critical to improve farmers’ adaptive capacity. Nevertheless it is important to recognize that such adaptations may result in fairly marginal adaptation given the many constraints faced by smallholder farmers.
SUPPLEMENTARY MATERIAL
To view supplementary material for this article, please visit http://dx.doi.org/10.1017/S0014479714000507
Acknowledgements
We thank the International Development Research Centre (IDRC) and Department for International Development (DFID) for funding through the Climate Change Adaptation in Africa (CCAA) Grant to the University of Zimbabwe. Additional funding from the Institut D’Economie Rurale du Mali is gratefully acknowledged. We are grateful to farmers of N’Goukan and Try for their availability. We thank Modibo Camara, Senko Coulibaly, Salif Doumbia and Mpie Bengaly who helped during data collection.