I. INTRODUCTION
It has long been of fundamental as well as practical interest to calculate or predict oxygen chemical potential profiles in a single-layer or multilayer composite of mixed conductor oxides under various boundary conditions.Reference Choudhury and Patterson1–Reference Jacobsen and Mogensen8 Particularly for bilayer electrolytes involving a main electrolyte with superior ionic conductivity but with too poor thermodynamic stability or too narrow electrolytic domain, and a complementary electrolyte with inferior ionic conductivity but with superior thermodynamic or electrolytic stability, e.g., Ce1−xGdxO2−x/2 (GDC)/Zr1−xYxO2−x/2 (YSZ) and Bi2−xYxO3−x/2 (YSB)/YSZ, oxygen chemical potential distribution is practically very important to ensure the thermodynamic or electrolytic stability of easily reducible GDC or easily decomposable YSB under solid oxide fuel cell conditions.Reference Choudhury and Patterson1–Reference Wachsman, Jayaweera, Jiang, Lowe and Pound5
It was WagnerReference Wagner9 who first tried to calculate the steady-state distribution of chemical potentials across heterogeneous phases. He was concerned with the open-circuit voltage E of the galvanic cell:

The open-circuit voltage is determined by the distribution of Ag chemical potential (μAg) in the cell. In his calculation,Reference Wagner9 he tacitly hypothesized that the distribution will be continuous at the interface between AgI and Ag2S and assigned a common chemical potential value  . Later on, authorsReference Choudhury and Patterson1–Reference Chan, Chen and Khor6 continued to adopt the same continuity hypothesis in dealing with the chemical potential distribution in a multilayer assembly subjected to a chemical potential difference of whatsoever origin. This continuity hypothesis is now widely accepted with little doubt, but it has never been tested experimentally.
We have recently measured the electronic conductivity of bilayer Ce0.9Gd0.1O1.95 (GDC)/Zr0.84Y0.16O1.92 (YSZ) electrolytes by using the Hebb–Wagner polarization method.Reference Kwon, Lee and Yoo10 In this course of work, we have observed that the continuity hypothesis appears to break down. The consequence would not be trivial: all the existing theories based on this hypothesis may not always be true.
We will hereby report on the possible failure of the hypothesis in detail by presenting the as-measured current (I) versus voltage (U) and electronic conductivity (σe), thereby calculating these on the basis of the continuity hypothesis and comparing each other. The failure strongly suggests that there may have to be a discontinuity of oxygen potential at an interface between two contiguous electrolytes. We will subsequently calculate this interfacial potential drop to compare with the overall drop across the entire GDC/YSZ bilayer.
II. I VERSUS U AND σe AS MEASURED
Let us consider a Hebb–Wagner polarization cell involving a bilayer electrolyte GDC/YSZ with the common cross section “A” and thickness of L C and L Z, respectively:
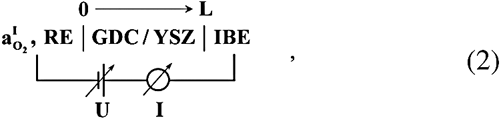
where RE and IBE denote the reversible and ion-blocking electrode, respectively, and  the oxygen activity fixed at RE. When a current I is driven toward IBE by a dc voltage U applied relative to IBE, the oxygen chemical potential at the right end of the bilayer (x = L = L C + L Z) in contact with IBE,
 , or oxygen activity there,
 , is lowered relative to the left end (x = 0) as:

because  ηi =
 μO + 2
 ηe = 0 in steady state, where ηk stands for the electrochemical potential of oxide ions (k = i) and electrons (k = e).
Letting σe denote the partial electronic conductivity of the bilayer as a whole, the steady-state current, which is totally electronic, is given as
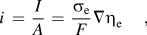
which may be rewritten, due to Eq. (3), as:

Upon integration along the length L, one obtains
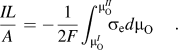
The electronic conductivity at  ,
 , of the bilayer as a whole can, thus, be determined from the instantaneous slopes of I versus U as measured with
 or
 fixed or

Experimental details are already given elsewhere.Reference Kwon, Lee and Yoo10 Briefly, the bilayers used were prepared by pulsed laser depositing YSZ films onto GDC disks as the main electrolytes. As IBE, Pt was first coated upon the as-deposited YSZ to a thickness of ∼1 μm, and then upon it, a Pt foil of 100 μm thickness was attached with the aid of Pt paste. As RE, a Pt net (100 mesh) was attached onto the other surface of the bilayer by lightly applying Pt paste. To secure firm attachment of these electrodes, the bilayer electrolyte as such was subsequently fired at ∼1000 °C under a light spring pressure, and the lateral surface of each cell was completely sealed with a glass. The steady-state voltage U across the cell was monitored relative to IBE, while passing a constant current I from RE to IBE.
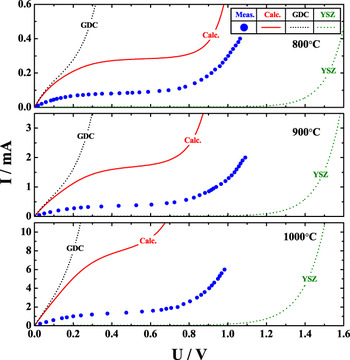
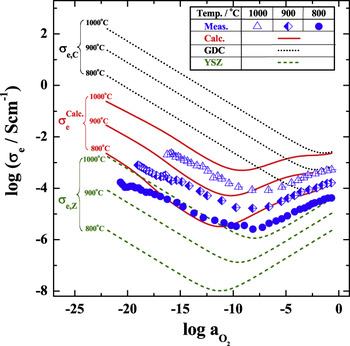
I versus U as measured on the Ce0.9Gd0.1O1.95/Zr0.84Y0.16O1.92 bilayer of L C = 1 mm and L Z = 1 μm with  = 0.21 at 800, 900, and 1000 °C, respectively, are shown (solid circles) in Fig. 1, and σe thereby due to Eq. (6) is shown (symbols) in Fig. 2.
I versus U as measured (solid circles) on the Ce0.9Gd0.1O1.95/Zr0.84Y0.16O1.92 bilayer electrolyte of thickness ratio of LC/LZ = 1 mm/1 μm by Hebb–Wagner polarization method and as calculated for the bilayer (solid lines) as well as both end-member electrolytes (dotted lines) at 800 °C (top), 900 °C (middle), and 1000 °C (bottom), respectively, with air as the reference oxygen activity ( = 0.21).

Electronic conductivity versus oxygen activity of Ce0.9Gd0.1O1.95/Zr0.84Y0.16O1.92 bilayer as measured (symbols) and as calculated (solid lines) at three different temperatures. For comparison, the as-calculated electronic conductivities of both end-member electrolytes are given (dotted lines).

III. I VERSUS U AND σe AS CALCULATED ON THE BASIS OF THE CONTINUITY HYPOTHESIS
Equation (5) indicates that once σe is known as a function of μO (=  /2) or
 , one can execute integration to eventually obtain I versus U due to Eq. (3). The partial electronic conductivity is known asReference Park and Blumenthal11−Reference Lee, Lee and Yoo13

for each end-member electrolyte  of the bilayer within its electrolytic domain, where
 and
 denote the conductivity by electrons and holes of the electrolyte
 , respectively, at the reference oxygen activity
 . One thus obtains the I versus U for the electrolyte
 with thickness
 as
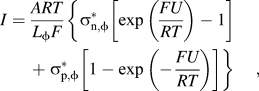
when  .
For the end-member electrolytes YSZ ( = Z) and GDC (
 = C), the reference conductivities
 and
 at
 = 0.21 take the numerical values as given in Table I. Using these values, we calculated, via Eq. (8), the I versus U for each end-member electrolyte YSZ and GDC with
 = L (=1 mm + 100 nm) at the three different temperatures, which are shown (dotted lines) in Fig. 1. The partial electronic conductivity as given in Eq. (7) or equivalently as calculated back via Eq. (6) from Eq. (8) is plotted (dotted lines) for each end-member electrolyte at the three corresponding temperatures in Fig. 2.
Numerical values for the electron and hole conductivities at the reference state  = 0.21, from Refs. Reference Park and Blumenthal11–Reference Lee, Lee and Yoo13.

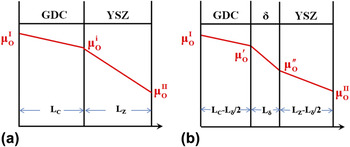
Let us now calculate the electronic conductivity of the bilayer itself by using the continuity hypothesis. The hypothesis stipulates a single value of oxygen chemical potential,  , at the GDC/YSZ interface, see Fig. 3(a). Once the steady state is achieved in Cell (2), the current I, which is now totally electronic, should be rendered constant and continuous across the two electrolyte phases or
Oxygen chemical potential distribution across a bilayer YSZ/GDC electrolyte (a) in the conventional picture and (b) in a newly proposed picture. Note an extra potential drop across an interphase δ with a thickness L δ such that L δ << L C, L Z.


Due to Eq. (5), thus, one has

which is subsequently integrated, by using Eq. (7), to
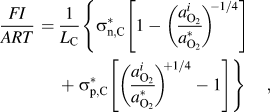
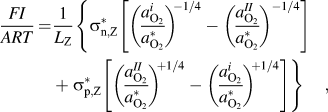
for the experimental condition  . These simultaneous equations can be analytically solved for
 in terms of
 and materials parameters
 and
 . By substituting the solution back into Eqs. (11a) or (11b) one obtains the analytic equation for I versus U with the aid of Eq. (3) as
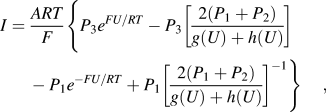
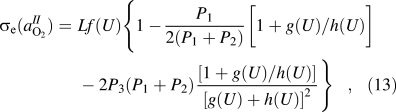
and according to Eq. (6), the conductivity of the bilayer as a whole as
where




Using the materials parameters in Table I, I versus U [Eq. (12)] is plotted (solid lines) at the three temperatures in Fig. 1, and σe versus log  [Eq. (13)] in Fig. 2.
In Figs. 1 and 2, one can clearly see that as expected, I versus U as well as σe versus log  of the GDC/YSZ bilayer, whether calculated or measured, are all bounded by the calculated ones of the end-member electrolytes, but for the bilayer itself, the as-calculated ones are too far off from the as-measured ones even though the former look somewhat similar to the latter in trends of variation. To drive a current of ∼0.2 mA at 800 °C, e.g., only 0.2 V is expected on the basis of the continuity hypothesis, but in reality, a much higher force, 0.9 V, is required (see Fig. 1), indicating that the electronic conductivity of the bilayer is much more suppressed than expected on the basis of the continuity hypothesis (see Fig. 2). Obviously, Eq. (12) or Eq. (13) that is based on the continuity hypothesis fails in predicting correctly the chemical potential distribution under electric tension in ion-blocking condition in particular. It is, therefore, suggested that the continuity hypothesis may not necessarily be true.
IV. NEW HYPOTHESIS INTERFACIAL DISCONTINUITY
We hereby hypothesize that there will be, for some reasons, a discontinuity of oxygen potential at the interface between the two end-member electrolytes or a continuous drop across a very thin interfacial layer or interphase δ with a thickness L δ, see Fig. 3(b). Letting  and
 denote the oxygen chemical potential at the GDC/δ and δ/YSZ interface, respectively, Eq. (9) should then be modified to include the third term I δ and, hence, Eq. (10) to include the corresponding term with oxygen potential bounds modified accordingly or
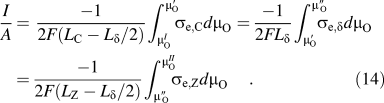
Assuming L δ << L C, L Z, the first and third integral in Eq. (14) will take the same form as in Eqs. (11a) and (11b), respectively, but with  in the former and
 in the latter.
From the as-measured I versus U in Fig. 1, one can now determine  via Eq. (11a) and
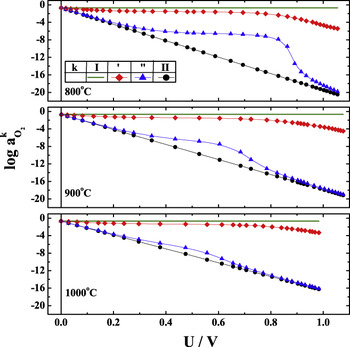
 via Eq. (11b) again using the materials parameters in Table I. The results at the three temperatures are shown in Fig. 4.
As-calculated oxygen activities  and
 across the interface of the Ce0.9Gd0.1O1.95/Zr0.84Y0.16O1.92 bilayer under electric tension U in ion-blocking condition at 800 °C (top), 900 °C (middle), and 1000 °C (bottom). GDC is on the reversible anode exposed to air (
 = 0.21) and YSZ on the blocking cathode [
 ].

It is seen that a great part of the overall oxygen potential drop ( ) across the bilayer occurs over the δ-interphase (
 ). This interfacial drop tends to be arrested, and accordingly, the drop across the YSZ layer (
 ) grows from ≈0 to maximum as σe of the bilayer approaches its minimum against
 or the current I approaches its inflection point against U, see Figs. 1 and 2. Furthermore, the drop across the GDC layer is rendered negligibly small (i.e.,
 ), as temperature gets lower.
One may now estimate the mean area-specific resistance of each phase. Letting < > and
 denote the mean conductivity and oxygen activity drop across the phase
 (= C, δ, Z), respectively, the equation for each phase in Eq. (14) may be rewritten as

where the left-hand side corresponds to the mean area-specific resistance. The as-calculated  /<
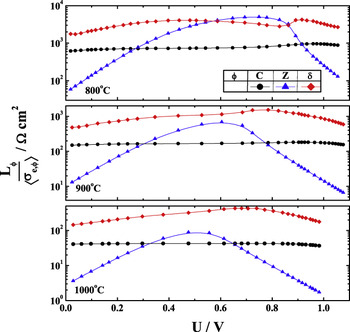
 > of the three constituent phases are shown in Fig. 5. One can clearly see that electron transfer is blocked mostly by the interface between GDC and YSZ or the interphase δ, rather than by the YSZ layer. The original idea of the bilayer electrolyte is to suppress the electronic conductivity of GDC by the thin complementary YSZ layer, which is electronically more resistive.Reference Kwon, Lee and Yoo10 In this light, the present finding is interesting and suggestive as well.
Mean area-specific electronic resistances,  /<
 > of GDC (
 = C), YSZ (
 = Z), and interface (
 = δ) in the bilayer electrolyte Ce0.9Gd0.1O1.95/Zr0.84Y0.16O1.92 versus applied voltage in Hebb–Wagner polarization cell at 800 °C (top), 900 °C (middle), and 1000 °C (bottom).

The origin or nature of this electron-blocking interphase is at large at the moment. An extra potential drop or electronic resistance across a heterogeneous interface such as the phase boundary of present concern, however, is not totally unexpected: Different phases have, in general, different ionic and electronic transference numbers, thus each transference number must be discontinuous across a virgin interface. It is then unavoidable to have a nonvanishing divergence of partial ionic and electronic current, or  i i ≠ 0, until the steady state where
 i i = 0 is achieved under an electric field. It is well knownReference Schmalzried14, Reference Yoo and Lee15 that wherever and whenever
 i i ≠ 0, there arises an electrochemical reaction to change the chemical composition or microstructure in the neighborhood of the singularityReference Schmalzried14, Reference Yoo and Lee15 in such a way that each partial current or flux is rendered continuous or
 i i = 0 in the steady state. We believe that this will be the cause for the extra potential drop or electronic resistance across the interface of the bilayer of present concern. Additionally, one may also think of a narrow interdiffusion zone, insulating impurity phase (e.g., glass), or structural singularity at the heterogeneous interface as its origin.Reference Yokokawa16 Work is now underway to elucidate the detailed inner workings.
V. CONCLUSIONS
It is observed that the enhanced electronic resistance and extended electrolytic domain width of bilayer YSZ/GDC electrolytes appear to be mostly due to the phase boundary, rather than due to the electronically more resistive YSZ itself. This observation suggests that the widely accepted continuity hypothesis on steady-state chemical potential distribution across phase boundaries may break down for bilayer composite electrolytes under electric tension in ion-blocking condition. All the existing theoriesReference Choudhury and Patterson1–Reference Chan, Chen and Khor6 dealing with the chemical potential distribution in a multilayer composite on the basis of this hypothesis, therefore, may not be always true depending on boundary conditions.
ACKNOWLEDGMENTS
This work was financially supported partially by the WCU project through National Research Foundation of Korea funded by the Ministry of Education, Science and Technology (R31-2008-000-10075-0) and partially by the Seoul R&D Program (CS070157).