Introduction
Anorexia Nervosa (AN) is an eating disorder with a life-time prevalence up to 0.9% in females (Smink et al., Reference Smink, van Hoeken and Hoek2012) and associated with extreme restriction of energy-intake, significantly low body weight, fear of weight gain and a distorted body image. Despite a recent increase in studies investigating the neurobiology of AN, the underlying pathophysiology remains largely unknown and the relationship between brain and illness behaviors is still poorly understood (Kaye et al., Reference Kaye, Wierenga, Bailer, Simmons and Bischoff-Grethe2013; Phillipou et al., Reference Phillipou, Rossell and Castle2014; Seitz et al., Reference Seitz, Bühren, von Polier, Heussen, Herpertz-Dahlmann and Konrad2014; King et al., Reference King, Frank, Thompson and Ehrlich2017). Several studies have reported reductions in gray matter (GM) in the acute state of AN (acAN; Mühlau et al., Reference Mühlau, Gaser, Ilg, Conrad, Leibl, Cebulla, Backmund, Gerlinghoff, Lommer, Schnebel, Wohlschläger, Zimmer and Nunnemann2007; Titova et al., Reference Titova, Hjorth, Schiöth and Brooks2013; Seitz et al., Reference Seitz, Bühren, von Polier, Heussen, Herpertz-Dahlmann and Konrad2014, Reference Seitz, Walter, Mainz, Herpertz-Dahlmann, Konrad and von Polier2015; King et al., Reference King, Geisler, Ritschel, Boehm, Seidel, Roschinski, Soltwedel, Zwipp, Pfuhl, Marxen, Roessner and Ehrlich2015) which (partially) normalize during weight restoration therapy (Castro-Fornieles et al., Reference Castro-Fornieles, Bargalló, Lázaro, Andrés, Falcon, Plana and Junqué2009; Friederich et al., Reference Friederich, Walther, Bendszus, Biller, Thomann, Zeigermann, Katus, Brunner, Zastrow and Herzog2012; Mainz et al., Reference Mainz, Schulte-Rüther, Fink, Herpertz-Dahlmann and Konrad2012; Bomba et al., Reference Bomba, Riva, Morzenti, Grimaldi, Neri and Nacinovich2015; Bernardoni et al., Reference Bernardoni, King, Geisler, Stein, Jaite, Nätsch, Tam, Boehm, Seidel, Roessner and Ehrlich2016). White matter (WM) alterations in acute patients seem to follow a similar pattern although the number of studies is limited (Wagner et al., Reference Wagner, Greer, Bailer, Frank, Henry, Putnam, Meltzer, Ziolko, Hoge, McConaha and Kaye2006; Lázaro et al., Reference Lázaro, Andrés, Calvo, Cullell, Moreno, Plana, Falcón, Bargalló and Castro-Fornieles2013; Seitz et al., Reference Seitz, Herpertz-Dahlmann and Konrad2016).
To examine potential WM pathology associated with AN, a growing number of studies have used diffusion tensor imaging (DTI; for review see Martin Monzon et al., Reference Martin Monzon, Hay, Foroughi and Touyz2016; King et al., Reference King, Frank, Thompson and Ehrlich2017). DTI enables the evaluation of microstructural properties in WM by quantifying the translational motion of water molecules in the brain (Basser and Jones, Reference Basser and Jones2002; Jones et al., Reference Jones, Knösche and Turner2013). A common metric is a fractional anisotropy (FA), a scalar value of the degree of diffusion anisotropy in brain tissue which is related to the dispersion of fibers in WM (Edwards et al., Reference Edwards, Pine, Weiskopf and Mohammadi2017). In WM tracts with coherently organized fibers, higher FA is thought to reflect favorable microstructural properties, such as increased myelination or greater axonal count (Basser and Pierpaoli, Reference Basser and Pierpaoli2011), whereas FA decreases are typically interpreted as reduced WM integrity (Via et al., Reference Via, Zalesky, Sánchez, Forcano, Harrison, Pujol, Fernández-Aranda, Menchón, Soriano-Mas, Cardoner and Fornito2014). Another common measure is mean diffusivity (MD), a measure that is related to the neurite density and as such typically negatively correlated to FA (Feldman et al., Reference Feldman, Yeatman, Lee, Barde and Gaman-Bean2010; Lampinen et al., Reference Lampinen, Szczepankiewicz, Mårtensson, van Westen, Sundgren and Nilsson2017). Further measures include axial (AD) and radial diffusivity (RD), which represent the diffusivity along the principal direction of fibers (AD) and perpendicular (RD) to it (Jones et al., Reference Jones, Knösche and Turner2013).
Several DTI studies have reported abnormalities in WM microstructure in acAN compared with healthy controls (HC), but both the location and direction of alterations (increased v. decreased anisotropy/diffusivity) has been relatively inconsistent (Kazlouski et al., Reference Kazlouski, Rollin, Tregellas, Shott, Jappe, Hagman, Pryor, Yang and Frank2011; Frieling et al., Reference Frieling, Fischer, Wilhelm, Engelhorn, Bleich, Hillemacher, Dörfler, Kornhuber, de Zwaan and Peschel2012; Frank et al., Reference Frank, Shott, Hagman and Mittal2013; Yau et al., Reference Yau, Bischoff-Grethe, Theilmann, Torres, Wagner, Kaye and Fennema-Notestine2013; Nagahara et al., Reference Nagahara, Nakamae, Nishizawa, Mizuhara, Moritoki, Wada, Sakai, Yamashita, Narumoto, Miyata, Yamada and Fukui2014; Via et al., Reference Via, Zalesky, Sánchez, Forcano, Harrison, Pujol, Fernández-Aranda, Menchón, Soriano-Mas, Cardoner and Fornito2014; Hayes et al., Reference Hayes, Lipsman, Chen, Woodside, Davis, Lozano and Hodaie2015; Travis et al., Reference Travis, Golden, Feldman, Solomon, Nguyen, Mezer, Yeatman and Dougherty2015; Gaudio et al., Reference Gaudio, Quattrocchi, Piervincenzi, Zobel, Montecchi, Dakanalis, Riva and Carducci2017). These discrepancies may be due to differences in analysis strategies, neurodevelopmental factors (age), clinical variables such as duration of illness and lack of statistical power (due to small sample sizes).
To study potential persistent microstructural WM alterations which might be related to predisposing factors for AN, a few DTI studies have focused on women recovered from AN (recAN). Whereas several prior reports suggest intact WM microstructure in recAN (Frieling et al., Reference Frieling, Fischer, Wilhelm, Engelhorn, Bleich, Hillemacher, Dörfler, Kornhuber, de Zwaan and Peschel2012; Yau et al., Reference Yau, Bischoff-Grethe, Theilmann, Torres, Wagner, Kaye and Fennema-Notestine2013; Pfuhl et al., Reference Pfuhl, King, Geisler, Roschinski, Ritschel, Seidel, Bernardoni, Müller, White, Roessner and Ehrlich2016), Shott et al. (Reference Shott, Pryor, Yang and Frank2016) found lower WM integrity in recAN in some WM tracts.
In an attempt to further differentiate transient phenomena (state markers), which may be secondary to acute undernutrition, from trait effects, two studies have longitudinally investigated WM microstructure alterations in acAN following partial weight restoration. A pilot study with a small sample (n = 9) found that increased FA in bilateral frontal, parietal and temporal areas in underweight adolescent acAN was partially normalized after nutritional treatment (Vogel et al., Reference Vogel, Timmers, Kumar, Nickl-Jockschat, Bastiani, Roebroek, Herpertz-Dahlmann, Konrad, Goebel and Seitz2016). Another study found no whole-brain FA differences in acAN at baseline, but a region of interest (ROI) analysis revealed increased WM anisotropy in the fronto-accumbal pathway after short-term weight restoration (Cha et al., Reference Cha, Ide, Bowman, Simpson, Posner and Steinglass2016). Also, WM alterations have been associated with AN-related characteristics such as measures of eating disorder severity (Cha et al., Reference Cha, Ide, Bowman, Simpson, Posner and Steinglass2016), anxiety (Kazlouski et al., Reference Kazlouski, Rollin, Tregellas, Shott, Jappe, Hagman, Pryor, Yang and Frank2011) and harm avoidance (Yau et al., Reference Yau, Bischoff-Grethe, Theilmann, Torres, Wagner, Kaye and Fennema-Notestine2013). However, replications are needed since current findings are inconsistent and may primarily be state-related.
Here, we studied the largest cohort of young acutely ill AN patients (and age-matched female HC) to date, both within the first days of treatment and again 2–4 months later after partial weight-restoration. Based on the previous DTI findings [and related findings for brain GM; see King et al. (Reference King, Frank, Thompson and Ehrlich2017) for review], we hypothesized that acAN patients would show evidence for reduced FA at baseline (acAN-Tp1) in brain areas that are assumed to be linked to AN symptomatology. For patients after short-term weight recovery (acAN-Tp2), we expected an at least partial normalization of WM microstructure compared with baseline, and no residual differences relative to HC. The current longitudinal study aims to bring some needed clarity to the literature on WM microstructure in AN. Affirmation of the hypothesis above would demonstrate that changes in WM microstructure in AN are more likely to be state-dependent and consequences of undernutrition than reflect premorbid trait markers or permanent ‘scars’.
Methods
Participants
We refer to acAN assessed within 96 hours after beginning nutritional rehabilitation program (timepoint 1) as ‘acAN-Tp1’ and after achieving partial weight restoration (timepoint 2) as ‘acAN-Tp2’. For the cross-sectional study arm, 56 acAN-Tp1 (12–27 years, 53 restrictive AN) and 56 age-matched HC (12–28 years) were included. HCs were individually age-matched to acAN by means of an automated search algorithm for optimal pairs (Munkres, Reference Munkres1957), resulting in a maximum difference of 58 days between individuals within one acAN-HC pair. The sample is partially overlapping with the one used in Pfuhl et al. (Reference Pfuhl, King, Geisler, Roschinski, Ritschel, Seidel, Bernardoni, Müller, White, Roessner and Ehrlich2016; see supplementary material [SM] 1.1). For the longitudinal analyses, 44 acAN-Tp1 (12–23 years, 41 restrictive AN) were reassessed after a body-mass-index (BMI) increase of at least 10% (acAN-Tp2, 12–23 years). The comparison between acAN-Tp2 and HC (12–23 years) included 44 subjects per group. For a more detailed description of the sample, see SM 1.1/SM 2.1.
For all participants, current and/or past diagnoses of eating disorders were obtained using the expert version of the Structured Interview for AN and Bulimia Nervosa for DSM-IV (SIAB-EX; Fichter and Quadflieg, Reference Fichter and Quadflieg2002). Inclusion criteria for acAN-Tp1 were a BMI below the 10th age percentile (if younger than 15.5 years) or a BMI below 17.5 kg/m2 (if older than 15.5 years) and no recent weight gain. HC participants had to be of normal weight (BMI > 18.5 kg/m2 if older than 18 years, or a BMI > 10th age-percentile if younger than 18 years), eumenorrhoeic, and without any history of psychiatric illness. For each group additional exclusion criteria were applied – most importantly a history of bulimia nervosa or binge eating, substance abuse, and neurologic or medical conditions (SM 1.3).
The study was approved by the local Institutional Review Board and all participants gave written informed consent (or their legal guardians, if underage).
Clinical assessment
To complement information obtained with the SIAB-EX, participants completed the Eating Disorder Inventory–2 (EDI-2), the Symptom-Checklist-90-revised (SCL90-R) and the Beck Depression Inventory II (BDI-II). Intelligence quotient (IQ) was estimated with short versions of the German adaptation of the Wechsler Adult Intelligence Scale (WIE; von Aster et al., Reference von Aster, Neubauer and Horn2006) for participants aged 16 years or older, or the German adaptation of the Wechsler Intelligence Scale for Children (HAWIK; Petermann and Petermann, Reference Petermann and Petermann2006) for participants aged 15 years or younger. Instead of BMI, we used the BMI standard deviation score (BMI-SDS) for statistical analyses since it provides an index of weight to height ratio that is corrected for age and gender (Kromeyer-Hauschild et al., Reference Kromeyer-Hauschild, Wabitsch, Kunze, Geller, Geiß, Hesse, von Hippel, Jaeger, Johnsen, Korte, Menner, Müller, Müller, Niemann-Pilatus, Remer, Schaefer, Wittchen, Zabransky, Zellner, Ziegler and Hebebrand2001).
Details on psychiatric, psychological and nutritional assessments of acAN patients including measurements of urine-specific gravity to gauge hydration status (Baron et al., Reference Baron, Courbebaisse, Lepicard and Friedlander2015) and serum leptin as an indicator of nutritional status (Föcker et al., Reference Föcker, Timmesfeld, Scherag, Bühren, Langkamp, Dempfle, Sheridan, de Zwaan, Fleischhaker, Herzog, Egberts, Zipfel, Herpertz-Dahlmann and Hebebrand2011) are described in SM 1.4.
Magnetic resonance imaging (MRI) acquisition
T1-weighted structural (1.0 mm3 isotropic voxel resolution) and diffusion-weighted images (2.4 mm3 isotropic voxel resolution, 32 diffusion sensitizing gradients, b = 1300 s/mm2) were acquired between 8 and 9 am after an overnight fast using standard sequences with a 3 T whole-body MRI scanner (TRIO; Siemens, Erlangen, Germany) equipped with a standard 12-channel head coil (details in SM 1.2).
Image processing and statistical analyses
Preprocessing
Diffusion-weighted images were quality controlled with a customized automated pipeline in DTIPrep (Oguz et al., Reference Oguz, Farzinfar, Matsui, Budin, Liu, Gerig, Johnson and Styner2014, no images had to be discarded) and then further processed with FSL's Diffusion Toolbox (FDT; University of Oxford Centre for Functional MRI of the Brain, http://www.fmrib.ox.ac.uk/). Datasets were corrected for eddy currents and head motion, non-brain tissue was stripped and diffusion tensors were fitted to each voxel. FSL's Tract-Based-Spatial-Statistics (TBSS) was used to generate voxel-wise FA maps for each participant and skeletonized with a minimum FA = 0.2 (Smith et al., Reference Smith, Jenkinson, Johansen-Berg, Rueckert, Nichols, Mackay, Watkins, Ciccarelli, Cader, Matthews and Behrens2006).
Statistical analyses
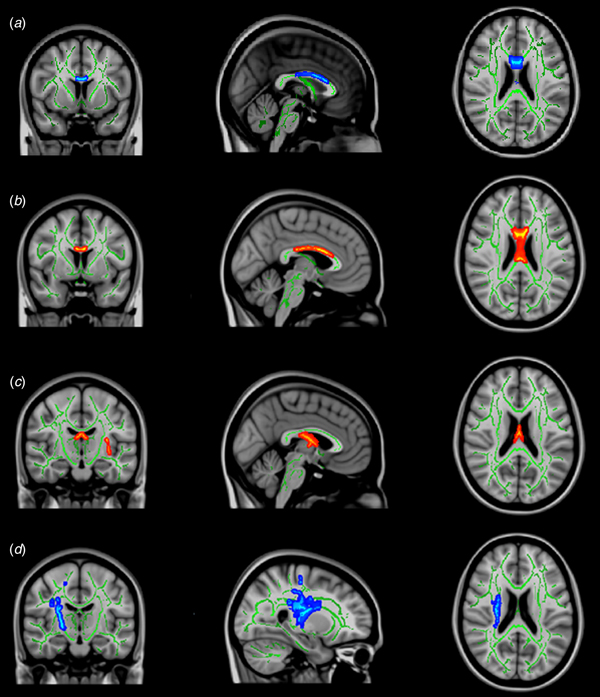
Independent samples t tests were performed to assess differences between acAN-Tp1 and HC (Fig. 1a), while in the longitudinal arm paired t test was used for differences between acAN-Tp1 and acAN-Tp2 (Fig. 1b-d). To correct for multiple comparisons we used FSL's ‘randomise’, a nonparametric permutation-based algorithm (Winkler et al., Reference Winkler, Ridgway, Webster, Smith and Nichols2014). Specifically, potentially significant clusters were identified using the threshold-free cluster enhancement method (Smith and Nichols, Reference Smith and Nichols2009). Then, voxels were reported as significant if they had a false positive rate α < 0.05, after whole-brain family-wise error correction (FWE). Anatomic localization of the clusters was based on WM regions of ‘Juelich Histological Atlas’ (Eickhoff et al., Reference Eickhoff, Stephan, Mohlberg, Grefkes, Fink, Amunts and Zilles2005). For each cluster showing a significant difference in FA, we extracted cluster size, localization, corrected p and t values. Then, p and t values were averaged across all voxels affiliated to the cluster to obtain a summary measure of diffusion properties in these regions (SM 2.2). Finally, clusters that showed significant FA-differences in the voxel-wise analysis served as ROI for the analyses of MD, AD and RD. This was done by intersecting the atlas region on the skeleton with the corresponding significant clusters. From the intersections, MD, AD and RD values were extracted and the difference between the two groups was then calculated in SPSS 23 (IBM Corp., USA).
Regions with a significant difference in FA from whole-brain TBSS analysis (p < 0.05 FWE corrected). For visualization purposes the suprathreshold clusters were thickened with tbss_fill (FSL). (a) Reduced FA in acAN-Tp1 compared with HC in the corpus callosum (489 voxels), coordinates (x, y, z in mm): 0, 8, 22; (b) Increased FA in acAN-Tp2 compared with acAN-Tp1 in the corpus callosum (685 voxels), coordinates (x, y, z in mm): −3, 4, 23; (c) Increased FA in acAN-Tp2 compared with acAN-Tp1 in the fornix (2111 voxels), coordinates (x, y, z in mm): −2, −15, 20; (d) Decreased FA in acAN-Tp2 compared with acAN-Tp1 in the right corticospinal tract (1801 voxels; 169 voxels), coordinates (x, y, z in mm): 26, −15, 20. Green: represents major white matter tracts with a minimum FA value of 0.2 across the sample. Red-yellow: significant clusters. Peak voxels, t-values and the clusters association on atlas regions can be found in SM 2.2. Abbreviations: FA, fractional anisotropy; TBSS, tract-based spatial statistics (FSL); FWE, family-wise error; acAN-Tp1, acute anorexia nervosa patients at timepoint 1 (baseline); acAN-Tp2, acute anorexia nervosa patients at timepoint 2; HC, healthy controls; SM, supplementary material.

Exploratory analyses
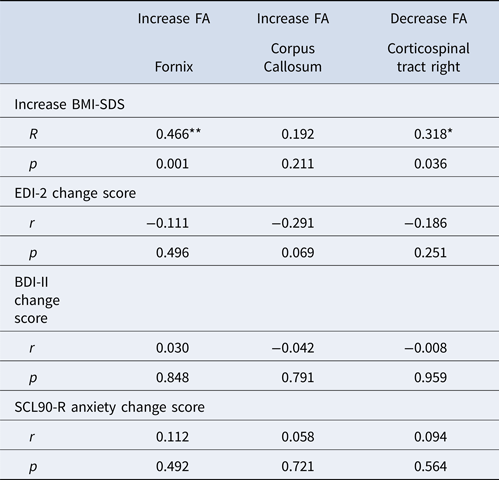
To further explore whether FA changes were significantly related to illness severity, we calculated correlations between mean FA values extracted from significant clusters with clinical variables using SPSS 23. Specifically, we correlated baseline FA values with BDI-II total score, EDI-2 total score, SCL90-R anxiety score and BMI-SDS in the patient group (SM 2.5 Table 6). Given the role of the corticospinal tract in motor functioning (Krakauer and Ghez, Reference Krakauer, Ghez, Kandel, Schwartz and Jessell2000) and that excessive physical exercise is common in AN (Ehrlich et al., Reference Ehrlich, Salbach-Andrae, Eckart, Merle, Burghardt, Pfeiffer, Franke, Uebelhack, Lehmkuhl and Hellweg2009; Gümmer et al., Reference Gümmer, Giel, Schag, Resmark, Junne, Becker, Zipfel and Teufel2015), we also explored relationships of FA and hyperactivity as measured with SIAB-EX (SM 2.5.1). For the longitudinal analysis, we calculated correlations between differences in FA values and differences in BDI-2 score, EDI-2 score, SCL90-R anxiety score and percentage increase of BMI-SDS from Tp1 to Tp2 (Table 1).
Spearman correlations between changes in FA in significant clusters and changes in clinical variables from acAN-Tp1 to acAN-Tp2

r = Spearman correlation coefficient, ** p < 0.01 (two-sided), * p < 0.05 (two-sided); acAN-Tp1, acute anorexia nervosa patients at timepoint 1 (baseline); acAN-Tp2, acute anorexia nervosa patients at timepoint 2; FA, fractional anisotropy; BMI, body mass index; BMI-SDS; BMI standard deviation scores; EDI-2, Eating Disorder Inventory-2; BDI-II, Beck Depression Inventory II; SCL90-R, Symptom-Checklist 90 revised subscale score for anxiety.
No correction for multiple testing was applied.
Results
Clinical and demographic values
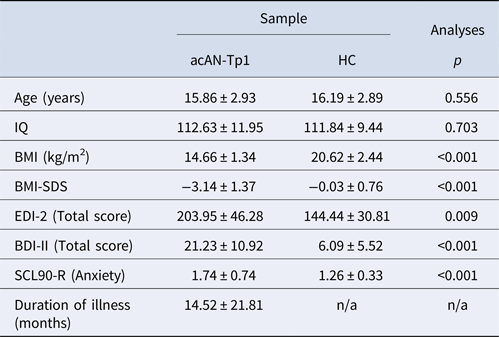
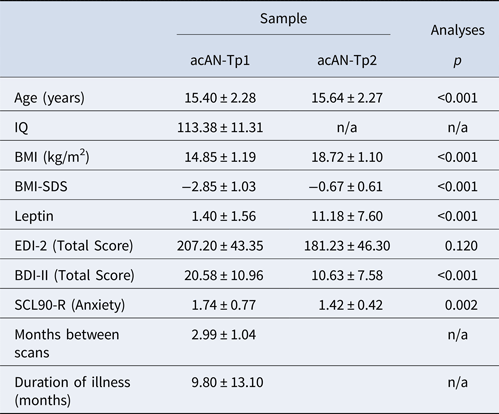
Clinical and demographic characteristics are summarized in Tables 2 and 3 (for an extended version see SM 2.1). No differences were found between acAN-Tp1 and HC in age and IQ. As expected, BMI and BMI-SDS were lower in acAN-Tp1 relative to HC, while EDI-2, BDI-2 and SCL90-R anxiety scores were higher (Table 1/SM Table 1). For the longitudinal data, we also found expected increases in BMI, BMI-SDS and decreases in EDI-2, BDI-II and SCL90-R anxiety scores when comparing acAN-Tp2 with acAN-Tp1 (Table 2/SM Table 2).
Demographic variables and clinical measures of the participants in the cross-sectional study arm (acAN-Tp1 and HC)

HC, healthy control; acAN-Tp1, acute anorexia nervosa patients at timepoint 1 (baseline); IQ, intelligence quotient, BMI, body mass index; BMI-SDS, BMI standard deviation scores; EDI-2, Eating Disorder Inventory-2; BDI-II, Beck Depression Inventory II; SCL90-R, Symptom-Checklist 90 revised subscale score for anxiety; SM, supplementary material.
Mean value and standard deviation (±) for each variable are shown. Additional information on the sample is given in SM Table 1. Group differences were tested using independent sample t tests.
Demographic variables and clinical measures in the longitudinal study arm (acAN-Tp1 and acAN-Tp2)
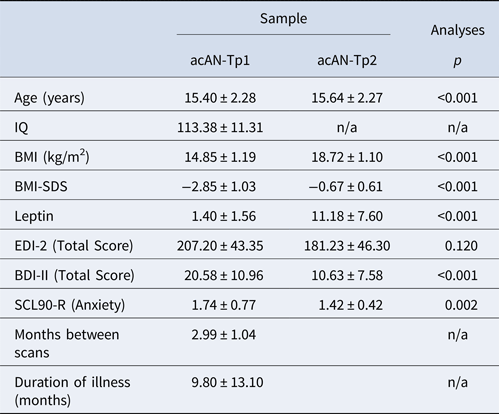
acAN-Tp1, acute anorexia nervosa patients at timepoint 1 (baseline); acAN-Tp2, acute anorexia nervosa patients at timepoint 2; IQ, intelligence quotient; BMI, body mass index; BMI-SDS, BMI standard deviation scores; EDI-2, Eating Disorder Inventory-2; BDI-II, Beck Depression Inventory II; SCL90-R, Symptom-Checklist 90 revised subscale score for anxiety; SM, supplementary material.
Mean values and standard deviation (±) for each variable are shown. Additional information on the sample is given in SM Table 2. Group differences were tested using paired t tests.
Cross-sectional comparison of FA
FA was significantly reduced in acAN-Tp1 relative to HC in a broad region of the corpus callosum (489 voxels, mostly corresponding to the body of the corpus callosum; Figure 1a). No WM regions showed higher FA in acAN-Tp1 compared with HC. In the contrast in acAN-Tp2 relative to HC, no significant differences were evident. The results of these basic cross-sectional group comparisons were all confirmed with re-analysis covarying for age (SM 2.3).
Longitudinal comparison of FA
Significant FA increases in acAN-Tp2 compared with acAN-Tp1 were localized in the fornix extending into the bilateral optic radiation (2111 voxels, Fig. 1c) as well as in a second cluster (685 voxels, Fig. 1b) which largely overlapped with regions of corpus callosum identified in the cross-sectional analysis. At the same time, we found two clusters (1801 voxels and 169 voxels, Fig. 1d) with reduced FA in acAN-Tp-2 which covered large parts of the right corticospinal tract (both clusters were combined in subsequent correlational analyses). Results of the basic longitudinal analyses were all confirmed in additional analyses covarying for age. However, an additional cluster with increased FA in acAN-Tp1 in the right superior longitudinal fascicle emerged (SM 2.3). Furthermore, an analysis accounting for the effects of time between the two scans on FA changes confirmed our initial results (SM 2.9).
It has been recently demonstrated that previous findings of altered fornix FA may be due to increased ventricular volume (Kaufmann et al., Reference Kaufmann, Baur, Hänggi, Jäncke, Piccirelli, Kollias, Schnyder, Pasternak, Martin-Soelch and Milos2017). To test the potential influence of ventricular size on FA changes in the fornix on our findings, we added the relative volume change of the third and the right and left lateral ventricles as covariates to the group comparison (SM 2.6). The same analysis was conducted for the corpus callosum (sum of the left and right lateral ventricles as covariates, SM 2.7). Results revealed that the variable reflecting ventricular volumes reduced the variance explained by timepoint, indicating a possible influence of cerebrospinal fluid (CSF) on FA values. Nonetheless, the main effect of timepoint remained a significant predictor of FA in the fornix and the corpus callosum (and ventricular volume was not significant in the model regarding corpus callosum).
Analyses of MD, AD and RD
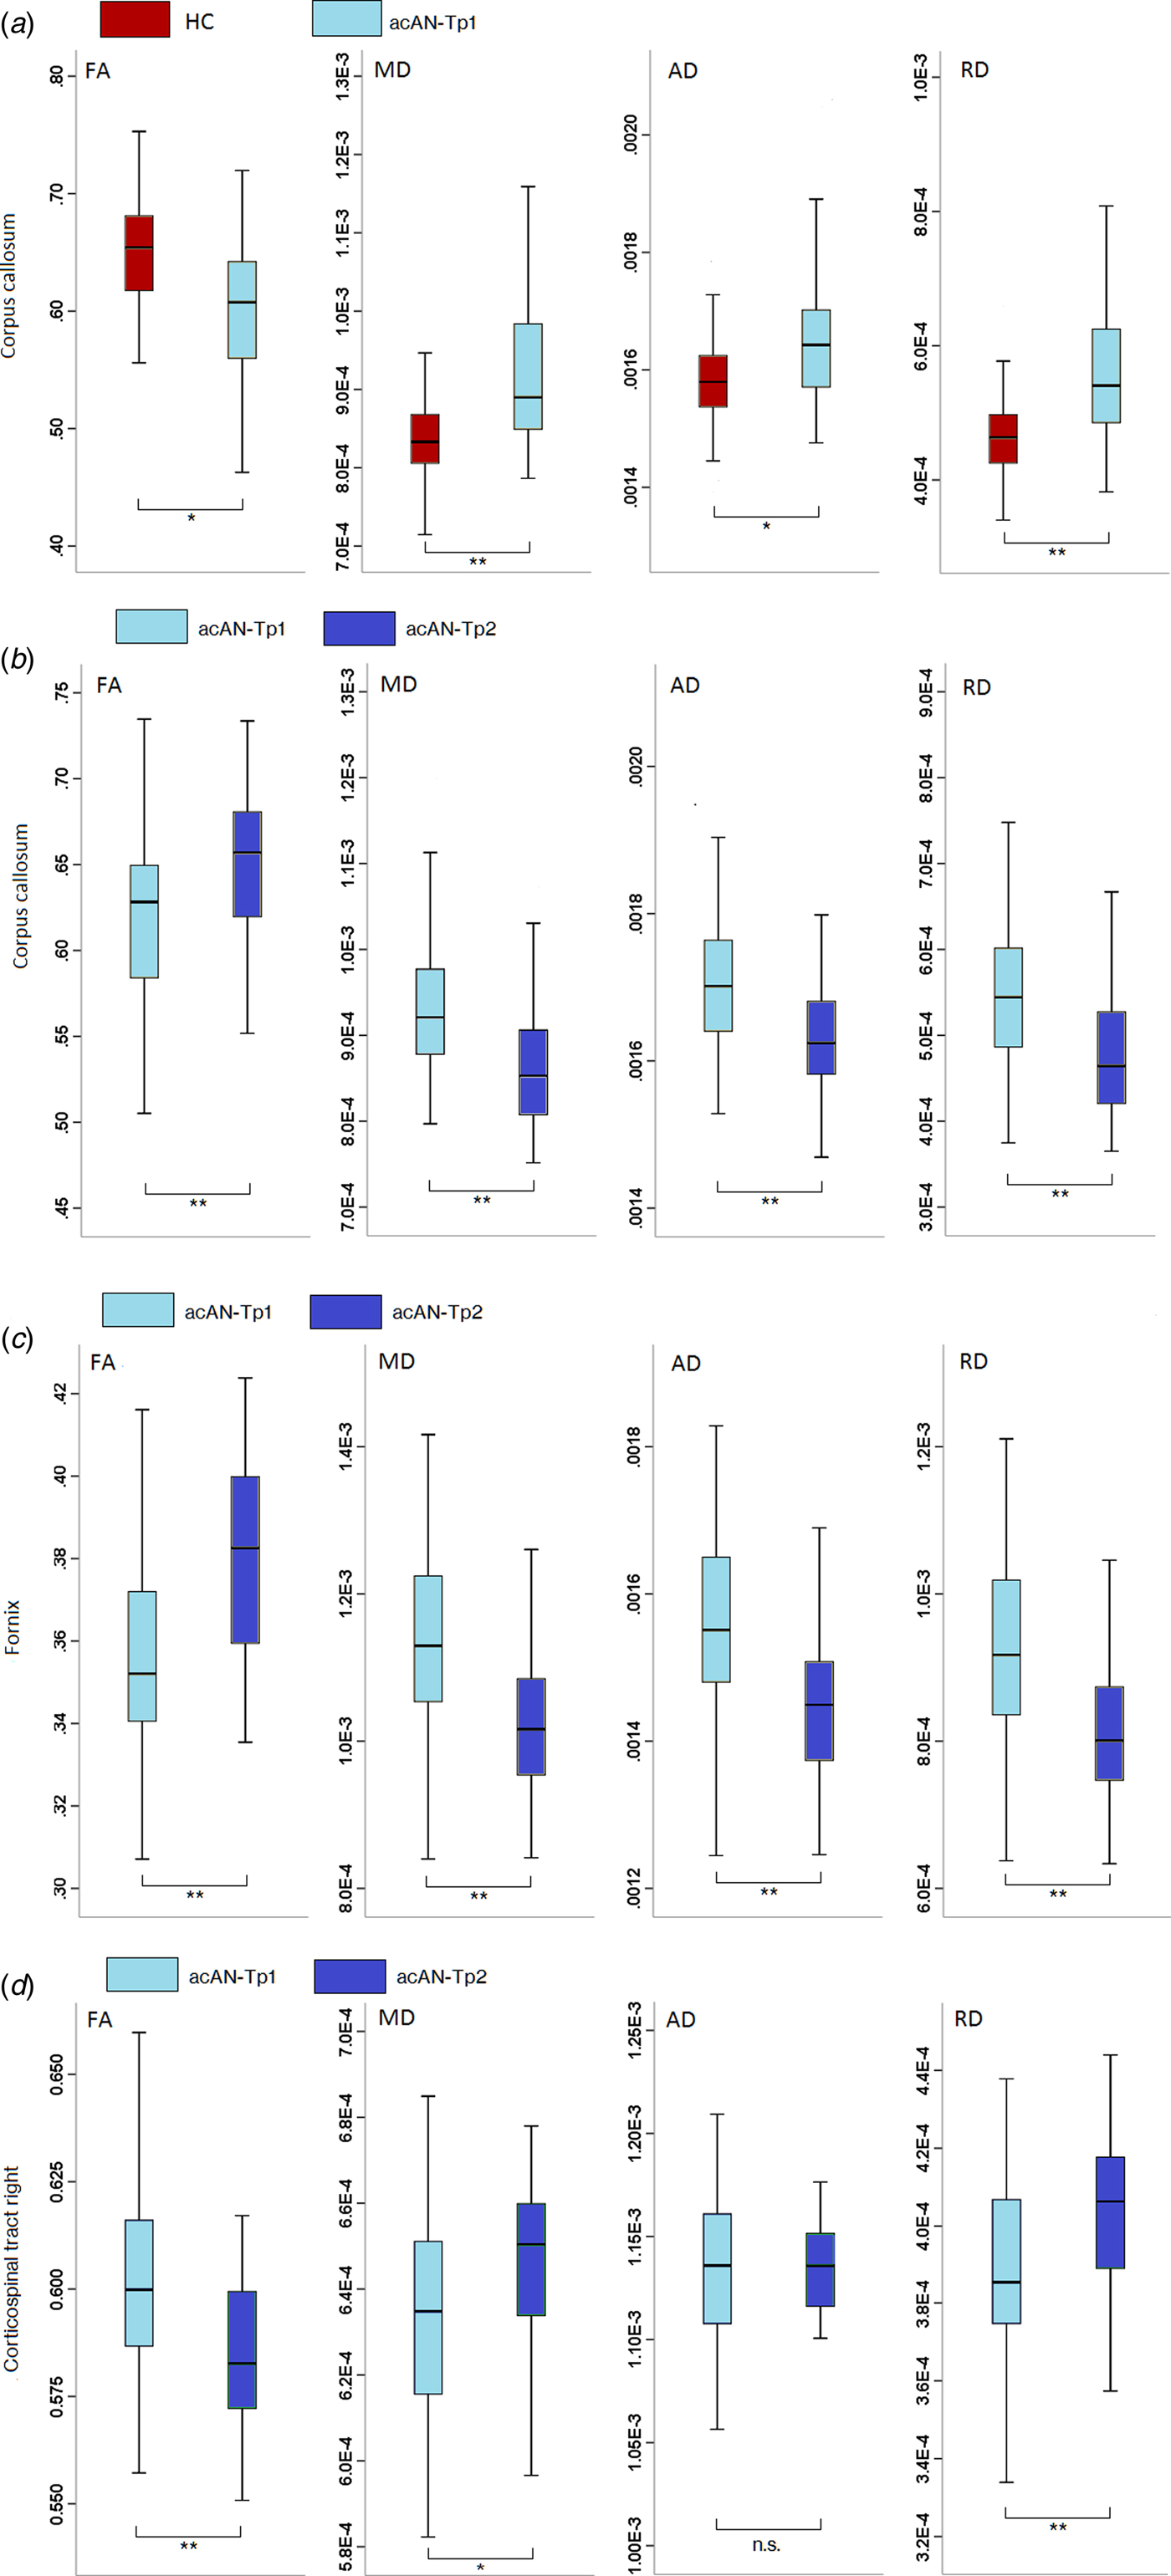
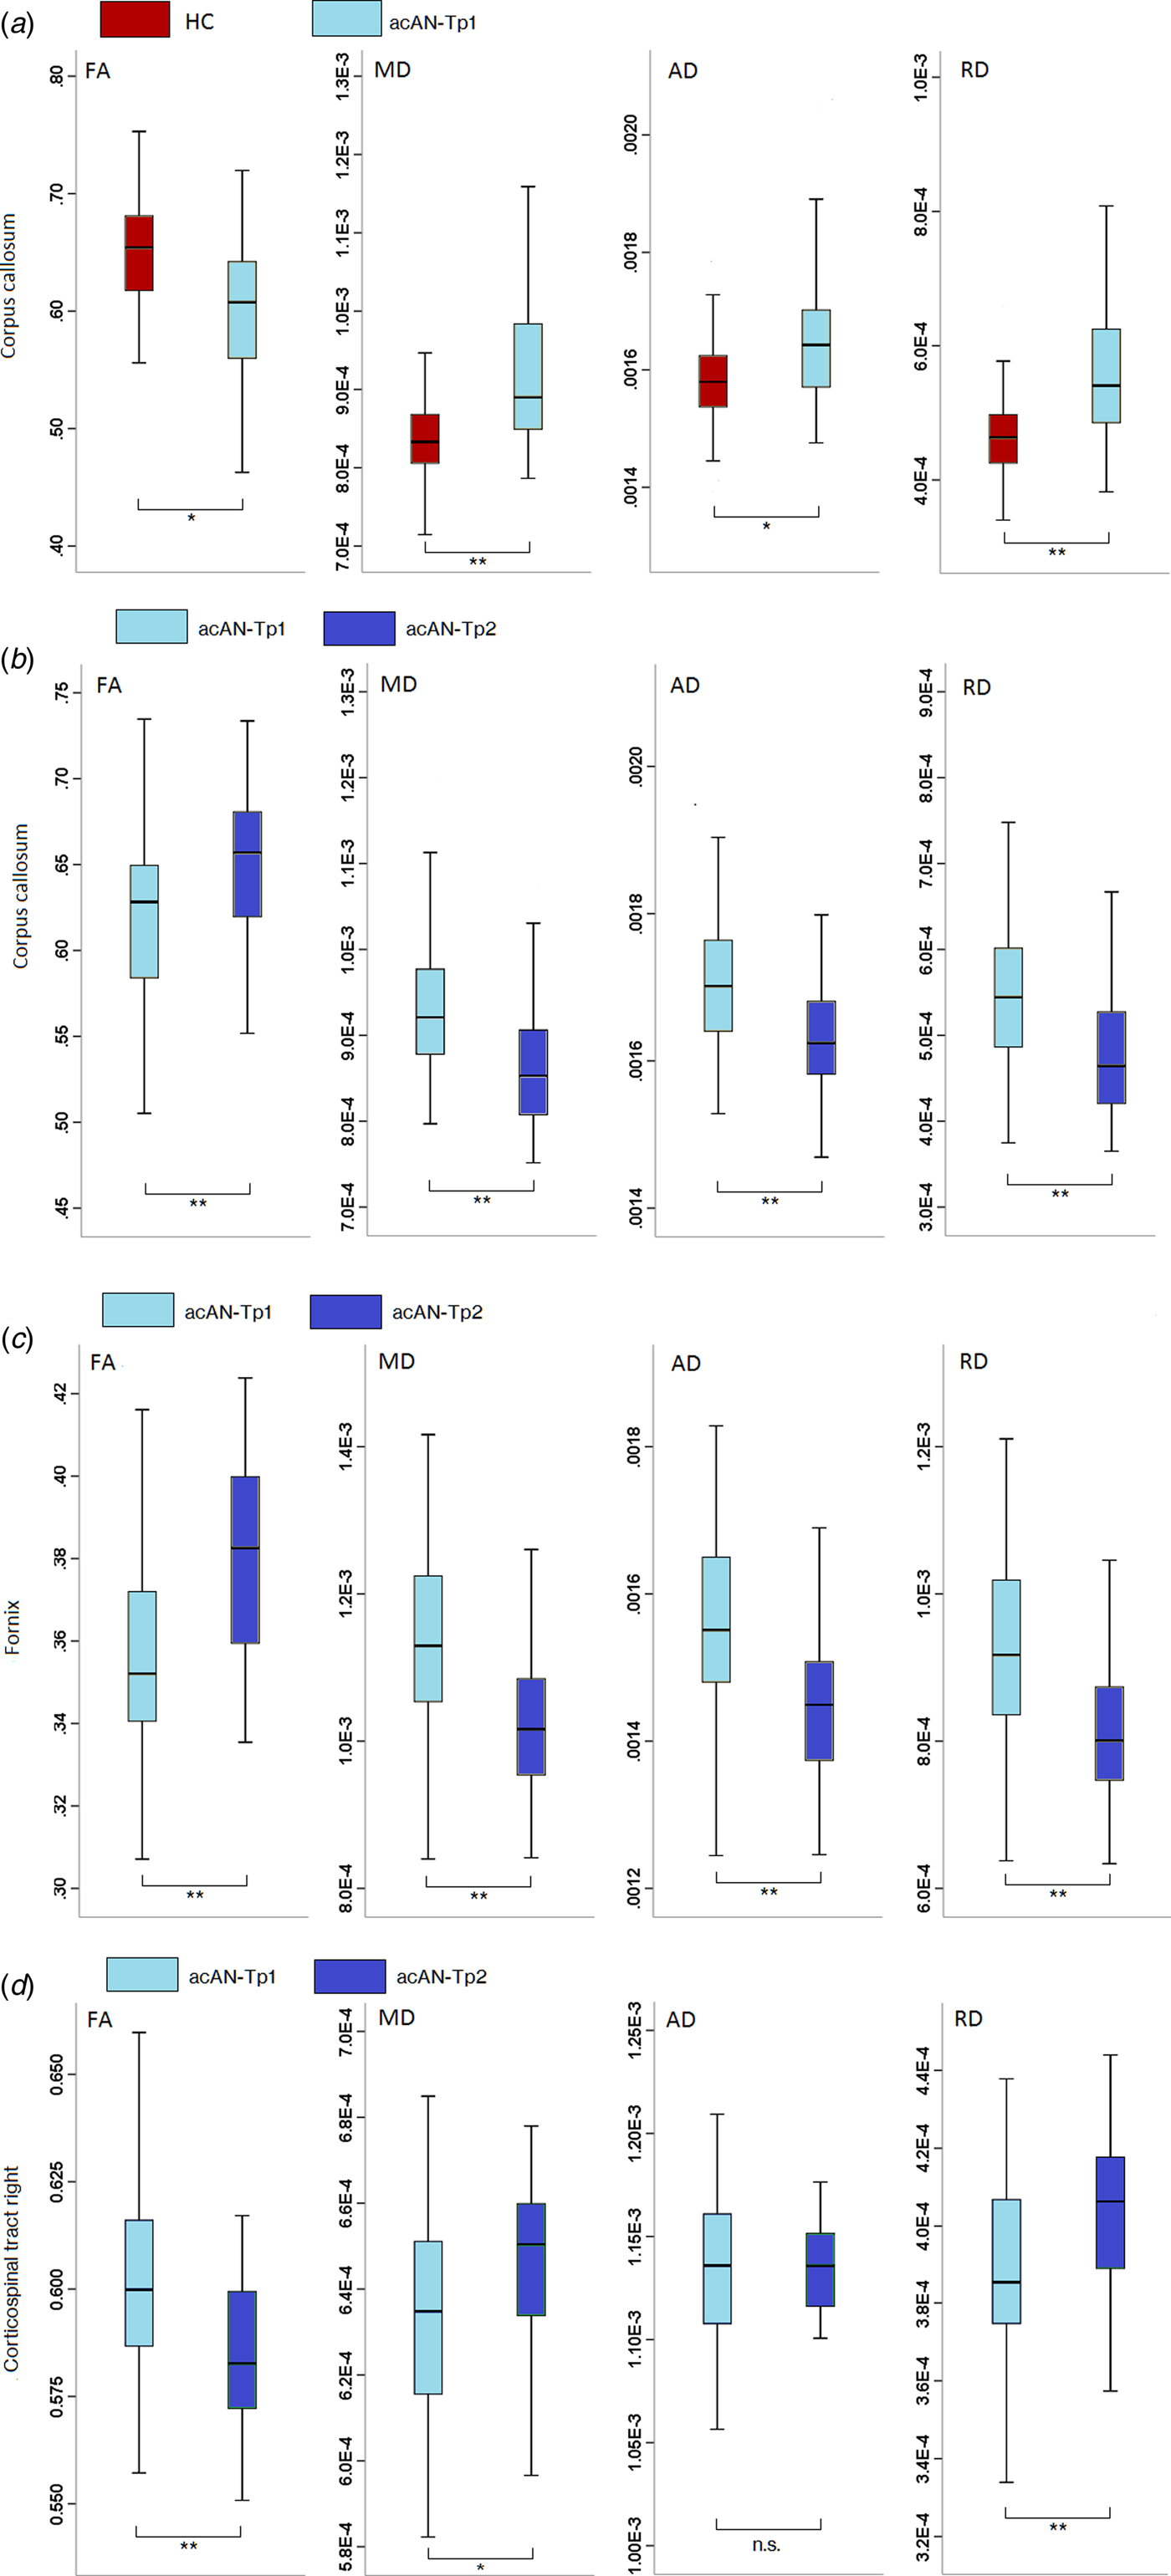
Clusters that showed significant FA differences in the acAN- Tp1-HC or acAN-Tp1-acAN-Tp2 contrast were subjected to further ROI analyses. For the cluster with reduced FA in the corpus callosum found in the cross-sectional study arm, MD, AD and RD values were significantly higher in acAN-Tp1 compared with HC (Fig. 2a). In the longitudinal study arm, diffusivity measures showed a similar pattern in the fornix (Fig. 2c) and the corpus callosum (Fig. 2b). In both regions, FA was increased in acAN-Tp2 v. acAN-Tp1, whereas MD, AD and RD were decreased. In the corticospinal tract, where FA was increased in acAN-Tp2 compared with acAN-Tp1, MD and RD (but not AD) were significantly decreased (Fig. 2d).
Boxplots show diffusivity measures’ eigenvalues with significant differences in FA (a) for HC v. acAN-Tp1 in the corpus callosum, (b) for acAN-Tp1 v. acAN-Tp2 in the corpus callosum, (c) for acAN-Tp1 v. acAN-Tp2 in the fornix and (d) for acAN-Tp1 v. acAN-Tp2 in the right corticospinal tract. * Significant within-group differences of the extracted measures: ** = P < 0.001 (two-sided), * = P < 0.05. Abbreviations: acAN-Tp1, acute anorexia nervosa patients at timepoint 1 (baseline); acAN-Tp2, acute anorexia nervosa patients at timepoint 2; HC, healthy controls; FA, fractional anisotropy; MD, mean diffusivity; AD, axial diffusivity; RD, radial diffusivity. Black horizontal lines represent the median of the values represented in each plot. Whiskers represent the minimum value and maximum value respectively.
Correlations with clinical measurements
We conducted a set of exploratory analyses to test for possible correlations between FA in the aforementioned significant clusters and crucial clinical variables. At baseline, FA values in the patient group showed no correlation with BMI-SDS, EDI-2 total scores, BDI-II total scores and SCL90-R anxiety scores (SM 2.5) or the extent of excessive physical activity measured with SIAB-EX (SM 2.5.1). In the longitudinal analysis, a positive association between BMI-SDS increase and FA changes in the fornix and the corticospinal tract was revealed (p < 0.01, two-sided, see Table 3).
Discussion
Despite a growing number of studies investigating gray and WM alterations in AN (see King et al., Reference King, Frank, Thompson and Ehrlich2017), there is still a relative lack of longitudinal studies which hold the potential to differentiate between state-related effects, e.g. due to acute undernutrition, and more enduring abnormalities which could be either predisposing factors (traits) or ‘scar-effects’ resulting from long-term illness. The findings presented here obtained from the largest known cross-sectional and longitudinal sample of young non-chronic AN patients studied with DTI suggest that WM microstructure alterations in AN are highly dynamic and critically dependent on weight status. While FA was regionally (corpus callosum, fornix) reduced in the state of acute undernutrition, we also observed higher FA in acutely ill patients in the corticospinal tract, a region integral to motor functioning (Krakauer and Ghez, Reference Krakauer, Ghez, Kandel, Schwartz and Jessell2000). All aforementioned alterations rapidly normalized with weight gain. This pattern of between- and within-group differences were also reflected by the results of an additional whole-brain analysis of MD (SM 2.4). As discussed below, these findings, despite some noteworthy limitations, add some much-needed clarity to the otherwise heterogeneous literature on WM microstructure in AN.
Indicating that weight restoration therapy reversed the altered microstructure observed in acAN at baseline, no differences in diffusion properties were evident when comparing short-term weight recovered patients with HC. Considered in light of our longitudinal observations, it thus seems likely that WM microstructure normalizes during weight restoration, providing further support for the notion that morphological brain changes in AN are largely state-dependent and may merely reflect a consequence of undernutrition. Based on the observed association between BMI-SDS increase during weight recovery and FA changes in the fornix and the corticospinal tract, it appears that changes not only in GM (Castro-Fornieles et al., Reference Castro-Fornieles, Bargalló, Lázaro, Andrés, Falcon, Plana and Junqué2009; Mainz et al., Reference Mainz, Schulte-Rüther, Fink, Herpertz-Dahlmann and Konrad2012; Bomba et al., Reference Bomba, Riva, Morzenti, Grimaldi, Neri and Nacinovich2015; Bernardoni et al., Reference Bernardoni, King, Geisler, Stein, Jaite, Nätsch, Tam, Boehm, Seidel, Roessner and Ehrlich2016), but also in WM are highly dynamic.
Our finding of decreased FA (and increased MD, RD and AD) in acAN in the state of undernutrition and normalized FA after partial weight restoration at follow-up in a largely overlapping region of corpus callosum is particularly noteworthy also because it solidifies and extends previous reports of altered WM microstructure in this region in acute AN (Frank et al., Reference Frank, Shott, Hagman and Mittal2013; Nagahara et al., Reference Nagahara, Nakamae, Nishizawa, Mizuhara, Moritoki, Wada, Sakai, Yamashita, Narumoto, Miyata, Yamada and Fukui2014; Travis et al., Reference Travis, Golden, Feldman, Solomon, Nguyen, Mezer, Yeatman and Dougherty2015; Cha et al., Reference Cha, Ide, Bowman, Simpson, Posner and Steinglass2016; Shott et al., Reference Shott, Pryor, Yang and Frank2016; Olivo et al., Reference Olivo, Wiemerslage, Swenne, Zhukowsky, Salonen-Ros, Larsson, Gaudio, Brooks and Schiöth2017). The corpus callosum is the main interhemispheric commissure involved in multimodal sensory and motoric signal processing (Fabri et al., Reference Fabri, Pierpaoli, Barbaresi and Polonara2014) and altered WM microstructure may contribute to the phenomenon of distorted body perception in AN (Gaudio et al., Reference Gaudio, Brooks and Riva2014; Reference Gaudio, Wiemerslage, Brooks and Schiöth2016; Gadsby, Reference Gadsby2017). Of note, differences were mainly found in the body of the corpus callosum – a WM region with a high density of large-diameter fibers with thick myelin sheaths (Aboitiz et al., Reference Aboitiz, Scheibel, Fisher and Zaidel1992; Mohammadi et al., Reference Mohammadi, Carey, Dick, Diedrichsen, Sereno, Reisert, Callaghan and Weiskopf2015). In line with this, we found reduced volumes of the corpus callosum in acAN-Tp1 compared with acAN-Tp2 and also a trend towards lower volumes in acAN-Tp1 compared with HC (SM 2.8).
Similarly, WM alterations in acute AN are frequently reported in the fornix (Kazlouski et al., Reference Kazlouski, Rollin, Tregellas, Shott, Jappe, Hagman, Pryor, Yang and Frank2011; Frank et al., Reference Frank, Shott, Hagman and Mittal2013; Nagahara et al., Reference Nagahara, Nakamae, Nishizawa, Mizuhara, Moritoki, Wada, Sakai, Yamashita, Narumoto, Miyata, Yamada and Fukui2014; Via et al., Reference Via, Zalesky, Sánchez, Forcano, Harrison, Pujol, Fernández-Aranda, Menchón, Soriano-Mas, Cardoner and Fornito2014; Travis et al., Reference Travis, Golden, Feldman, Solomon, Nguyen, Mezer, Yeatman and Dougherty2015). However, the current study is the first to observe a normalization in FA in this region with weight gain. The fornix, as part of the limbic system, may play a key role in AN-specific alterations in reward-regulating behavior patterns associated by a disturbed fronto-striatal circuitry (Cha et al., Reference Cha, Ide, Bowman, Simpson, Posner and Steinglass2016). However, it has recently been demonstrated (Kaufmann et al., Reference Kaufmann, Baur, Hänggi, Jäncke, Piccirelli, Kollias, Schnyder, Pasternak, Martin-Soelch and Milos2017) that DTI metrics in this region may be biased by CSF-induced partial volume effects (PVE) due to ventricular enlargement typically found in acute AN. Consistent with this possibility, ventricular volumes and fornix FA values were negatively correlated in acAN (but not HC, see SM 2.6 Table 7a) at baseline and after partial weight restoration. Similar to Kaufmann et al. (Reference Kaufmann, Baur, Hänggi, Jäncke, Piccirelli, Kollias, Schnyder, Pasternak, Martin-Soelch and Milos2017), the effect of weight restoration on fornix FA was notably reduced (albeit still significant) when adding the relative change in ventricular volume as a covariate in the longitudinal analysis (SM 2.6 Table 7b). For the corpus callosum, which might be also affected by PVE, we obtained similar albeit not significant results for the effects of ventricular volumes (SM 2.7 Table 8b). Hence, AN-related WM microstructural abnormalities in the fornix (and possibly also the corpus callosum) must be interpreted with caution and future studies should apply additional methods (such as covarying for free water) to verify whether altered WM microstructure in the vicinity of CSF spaces is an artifact or not.
When interpreting the aforementioned findings obtained in a sample of young AN patients, it should also be kept in mind that WM development may follow non-linear patterns from childhood to early adulthood (Lebel and Beaulieu, Reference Lebel and Beaulieu2011). It is possible that a decrease of FA in the acAN reflects stunted neurodevelopment subsequent to undernutrition rather than undernutrition in the first place. However, the rapid normalization of WM abnormalities with weight gain speaks against a neurodevelopmental origin.
Although the majority of previous DTI studies in AN have reported decreased FA in the acute state (King et al., Reference King, Frank, Thompson and Ehrlich2017), a few studies have found regional increases in acAN (Frank et al., Reference Frank, Shott, Hagman and Mittal2013; Travis et al., Reference Travis, Golden, Feldman, Solomon, Nguyen, Mezer, Yeatman and Dougherty2015; Cha et al., Reference Cha, Ide, Bowman, Simpson, Posner and Steinglass2016; Vogel et al., Reference Vogel, Timmers, Kumar, Nickl-Jockschat, Bastiani, Roebroek, Herpertz-Dahlmann, Konrad, Goebel and Seitz2016). We extend such findings by showing a normalization of initially increased FA in the right corticospinal tract in short-term weight recovered patients both longitudinally and relative to HC. As in Vogel et al. (Reference Vogel, Timmers, Kumar, Nickl-Jockschat, Bastiani, Roebroek, Herpertz-Dahlmann, Konrad, Goebel and Seitz2016), increased FA values were accompanied by decreases in MD and RD but not AD. This pattern may suggest a closer packing of myelinated axons in the WM which then impedes diffusion orthogonal to the fibers (Basser and Pierpaoli, Reference Basser and Pierpaoli2011). This may also be related to excessive physical exercise that is observed in up to 70% of the patients in this stage of the illness (Gümmer et al., Reference Gümmer, Giel, Schag, Resmark, Junne, Becker, Zipfel and Teufel2015). Such continuous physical training may lead to increased FA in the corticospinal tract. In line with this, Bernardoni et al. (Reference Bernardoni, King, Geisler, Stein, Jaite, Nätsch, Tam, Boehm, Seidel, Roessner and Ehrlich2016) found increased cortical thickness (CT) in a highly localized region of the right primary motor cortex in acAN-Tp1 relative to HC (in an overlapping sample, see SM 1.1) using customized FreeSurfer tools (Bernal-Rusiel et al., Reference Bernal-Rusiel, Greve, Reuter, Fischl and Sabuncu2013a, Reference Bernal-Rusiel, Reuter, Greve, Fischl and Sabuncu2013b). CT in the same region decreased following partial weight restoration (Bernardoni et al., Reference Bernardoni, King, Geisler, Stein, Jaite, Nätsch, Tam, Boehm, Seidel, Roessner and Ehrlich2016). However, a correlation between the extent of physical exercise (as measured by SIAB-EX, item #21) with FA values in the corticospinal tract in our study was not significant (see SM 2.5.1). Yet, future studies need to employ better measures to quantify physical activity in AN that take different forms of activity into account or rely on an objective quantification.
The interpretation of DTI parameters is based on the assumption of homogeneous unidirectional fibers within voxels (Wiegell et al., Reference Wiegell, Larsson and Wedeen2000). Some WM regions, such as the identified cluster in the corticospinal tract, however, contain fiber tracts that are oriented in different directions (crossings; Lee et al., Reference Lee, Park, Park and Hong2015). Therefore, an alternative, but equally speculative interpretation of decreased FA values in the corticospinal tract in acAN-Tp2 is a reduction in myelination of one of the crossing fiber tracts.
As noted in the introduction, DTI studies examining WM alterations in AN have produced considerably heterogeneous results. Differences between studies may be explained by a variety of factors including sample size, age of onset, illness duration/severity, AN subtype, psychiatric medication, MR sequence and different data processing pipelines (King et al., Reference King, Frank, Thompson and Ehrlich2017). The latter might explain the differences between the current results in the cross-sectional analysis and findings by Pfuhl et al. (Reference Pfuhl, King, Geisler, Roschinski, Ritschel, Seidel, Bernardoni, Müller, White, Roessner and Ehrlich2016). Instead of TBSS, Pfuhl et al. (Reference Pfuhl, King, Geisler, Roschinski, Ritschel, Seidel, Bernardoni, Müller, White, Roessner and Ehrlich2016) used a probabilistic tractography algorithm which averages anisotropy/diffusivity measures over the total volume of relatively large fiber bundles (Yendiki et al., Reference Yendiki, Panneck, Srinivasan, Stevens, Zöllei, Augustinack, Wang, Salat, Ehrlich, Behrens, Jbabdi, Gollub and Fischl2011). Although tract-wise summary measures are more easily to interpret regarding connectivity, localized WM alterations may be missed. Additionally, the method used by Pfuhl et al. (Reference Pfuhl, King, Geisler, Roschinski, Ritschel, Seidel, Bernardoni, Müller, White, Roessner and Ehrlich2016) may be more susceptible to registration errors and partial voluming compared with TBSS, which determines tract-central FA values with the center-of-gravity method (Smith et al., Reference Smith, Jenkinson, Johansen-Berg, Rueckert, Nichols, Mackay, Watkins, Ciccarelli, Cader, Matthews and Behrens2006). Since our data suggest that many WM alterations are state-related and closely associated with BMI, the length and degree of realimentation before scanning is another highly important factor to consider. Depending on the degree of realimentation [e.g. less than 96 h as in the current study v. after 1–2 weeks of medical stabilization (Frank et al., Reference Frank, Shott, Hagman and Mittal2013)] differing degrees of WM microstructure abnormalities can be expected.
The heterogeneity of the DTI literature in AN to date has also hindered the development of an understanding of the underlying mechanisms of WM changes in AN. Changes in hydration status may (Streitbürger et al., Reference Streitbürger, Möller, Tittgemeyer, Hund-Georgiadis, Schroeter and Mueller2012) or may not (Meyers et al., Reference Meyers, Kolind and MacKay2016) affect brain structure, by causing a shift of fluid between intra- and extracellular spaces. Some AN patients restrict their fluid intake or engage in polydipsia to ‘cheat the scale’. To address this possible bias, we assessed hydration by measuring urine specific gravity immediately prior to scanning in the majority of patients at baseline but found no evidence of de- or hyperhydration in our sample (SM 1.4). However, urine specific gravity may not sufficiently reflect the hydrational status (Evrard et al., Reference Evrard, da Cunha, Lambert and Devuyst2004). Another possible underlying mechanism of WM changes in AN may be related to reduced lipid content in the brain in acAN (Shih, Reference Shih2017). Lipids (including fatty acids) are a major component of myelin, which itself affects brain structure (Piomelli et al., Reference Piomelli, Astarita and Rapaka2007). Lipids are produced endogenously, but essential fatty acids have to be supplied with the diet (Yehuda et al., Reference Yehuda, Rabinovitz, Mostofsky, Mostofsky, Yehuda and Salem2001). Severe undernutrition may affect myelin integrity which could potentially promote increased RD (and decreased FA). This may have far-reaching consequences in adolescence and early adulthood, where the neurodevelopmental process of myelination may be disrupted.
Our findings have to be considered in the light of the following limitations. First, although the results of the critical acAN-Tp1 v. acAN-Tp2 longitudinal analyses and acAN-Tp2 v. HC cross-sectional analyses support the conclusion of rapid reversal and normalization of WM alterations in AN following partial weight restoration, replication of these findings could be underlined with longitudinal measurements of age-matched HC. However, voxelwise TBSS measurements have been reported to have a good reliability (Jovicich et al., Reference Jovicich, Marizzoni, Bosch, Bartrés-Faz, Arnold, Benninghoff, Wiltfang, Roccatagliata, Picco, Nobili, Blin, Bombois, Lopes, Bordet, Chanoine, Ranjeva, Didic, Gros-Dagnac, Payoux, Zoccatelli, Alessandrini, Beltramello, Bargalló, Ferretti, Caulo, Aiello, Ragucci, Soricelli, Salvadori, Tarducci, Floridi, Tsolaki, Constantinidis, Drevelegas, Rossini, Marra, Otto, Reiss-Zimmermann, Hoffmann, Galluzzi and Frisoni2014; Madhyastha et al., Reference Madhyastha, Mérillat, Hirsiger, Bezzola, Liem, Grabowski and Jäncke2014), which was also the case for our own longitudinal data (SM 2.10; Fröhner et al., Reference Fröhner, Teckentrup, Smolka and Kroemer2017). Second, although TBSS attempts to overcome registration errors by mapping the tract in the vicinity of the FA skeleton to the FA skeleton, fornix has been identified as susceptible to errors in registration in studies of neurodegenerative diseases. Registration errors could also play a role in AN studies due to changes in ventricle size (Keihaninejad et al., Reference Keihaninejad, Ryan, Malone, Modat, Cash, Ridgway, Zhang, Fox and Ourselin2012). Third, this study does not address alterations in underlying neurocircuits. Future longitudinal studies should therefore also examine brain connectivity, e.g. using fiber tracking. Multimodal imaging data (Travis et al., Reference Travis, Golden, Feldman, Solomon, Nguyen, Mezer, Yeatman and Dougherty2015; Cha et al., Reference Cha, Ide, Bowman, Simpson, Posner and Steinglass2016; Frank et al., Reference Frank, Shott, Riederer and Pryor2016; Zhang et al., Reference Zhang, Leow, Zhan, GadElkarim, Moody, Khalsa, Strober and Feusner2016) may facilitate further insights in the underlying pathophysiological mechanisms of structural brain changes in AN. Advanced quantitative MRI could help to clarify whether WM abnormalities persist at a more microscopic level (Tofts, Reference Tofts2004; King et al., Reference King, Frank, Thompson and Ehrlich2017). Fourth, our findings may be specific to relatively young and non-chronic patients and the observed rapid changes may not be found in an older cohort with a longer duration of illness. Fifth, since we focused on short-term weight rehabilitation, future studies should include additional follow-up timepoints after long-term recovery to examine how the illness affects brain development in adolescents.
Taken together, we found that altered microstructural properties, namely region-specific decreases but also increases in FA, in AN patients normalized rapidly during nutritional therapy. These findings parallel the patterns in GM (e.g. CT) and underline that structural brain alterations associated with the disorder are highly dynamic and more likely to represent consequences of starvation (state) than preexisting anomalies (traits; Bernardoni et al., Reference Bernardoni, King, Geisler, Stein, Jaite, Nätsch, Tam, Boehm, Seidel, Roessner and Ehrlich2016) or WM degeneration as seen in old age (Salat et al., Reference Salat, Tuch, Greve, van der Kouwe, Hevelone, Zaleta, Rosen, Fischl, Corkin, Rosas and Dale2005). This knowledge has potential to give hope to patients (Bang et al., Reference Bang, Treasure, Rø and Joos2017; MacDuffie and Strauman, Reference MacDuffie and Strauman2017) and care-givers and may help clinicians to convey the healing power of psychotherapy and (relatively fast) weight gain in AN.
Supplementary material
The supplementary material for this article can be found at https://doi.org/10.1017/S003329171800212X
Acknowledgements
The authors thank the medical students, research assistants and clinicians who assisted with participant recruitment and data collection and thank all participants for their time and cooperation. The authors also thank the Center for Information Services and High Performance Computing (ZIH) at TU Dresden for generous allocations of computer time. This work was supported by the Deutsche Forschungsgemeinschaft (EH 367/5-1, EH 367/7-1 and SFB 940) and the Swiss Anorexia Nervosa Foundation. SM received funding from the European Union's Horizon 2020 research and innovation programme under the Marie Sklodowska-Curie grant agreement No 658589 and was supported by the Deutsche Forschungsgemeinschaft, Grant Number: MO 2397/4-1.
Conflict of interest
In the last 2 years, Dr Roessner has received lecture fees from Eli Lilly, Janssen-Cilag, Medice, and Novartis and was a member of advisory boards of Eli Lilly and Novartis. All other authors reported no biomedical financial interests or potential conflicts of interest.
Ethical standards
The authors assert that all procedures contributing to this work comply with the ethical standards of the relevant national and institutional committees on human experimentation and with the Helsinki Declaration of 1975, as revised in 2008.