Introduction
Surficial deposits in the McMurdo Dry Valleys (MDV) of Antarctica provide a valuable record of Neogene and Quaternary climate history. Average global temperatures during the Neogene were warmer than today, and understanding the Antarctic climate during this period may provide scenarios for predicting future climate change. One problem in understanding past processes affecting the MDV is the lack of surficial deposits that have been reliably dated. As a result, a complex relative stratigraphy exists that is constrained by only a few stratigraphic markers. Localized tephra ranging in age from 1–20 Ma have been found throughout the MDV (Marchant et al. Reference Marchant, Denton, Sugden and Swisher1993a, Reference Marchant, Denton, Swisher and Potter1996, Reference Marchant, Mackay, Lamp, Hayden and Head2013, Lewis et al. Reference Lewis, Marchant, Baldwin and Webb2006, Lewis & Ashworth Reference Lewis and Ashworth2016). Although these place critical constraints on climate history (Sugden et al. Reference Sugden, Marchant, Potter, Souchez, Denton, Swisher and Tison1995, Marchant et al. Reference Marchant, Mackay, Lamp, Hayden and Head2013), detailed geochemical data for these tephra have not been published. Tephra can be precisely dated, but their ages only have real significance to the stratigraphy if they represent an original, undisturbed primary deposit.
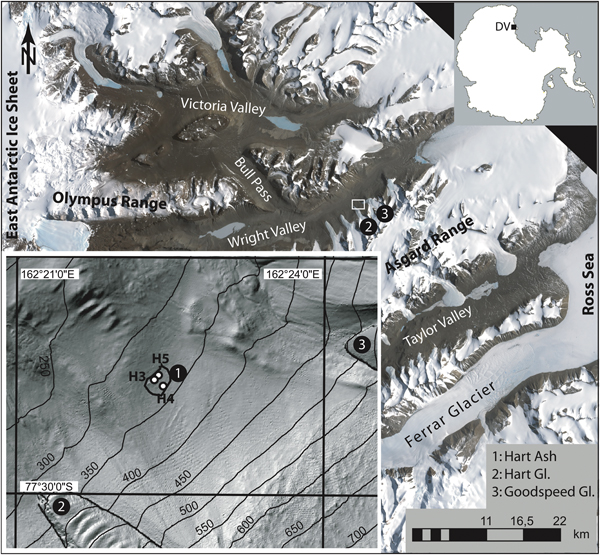
A stratigraphically important tephra deposit in the Wright Valley is the Hart Ash, which has been mapped in three distinct locations in the east-central Wright Valley (Hall et al. Reference Hall, Denton, Lux and Bockheim1993). We examined the largest of the three deposits. This deposit covers c. 12 000 m2 and is located on a gently sloping surface between the Hart and Goodspeed glaciers (77.4959°S, 162.3725°E; Fig. 1). Hall (Reference Hall1992) reported a K–Ar age of 3.9 ± 0.3 Ma for the glass shards in this tephra, which was inferred to be an in situ fall-out deposit. This age of the Hart Ash has been used in numerous studies to establish relative age constraints by stratigraphic correlation (Claridge & Campbell Reference Claridge and Campbell2008) or to make inferences about past climate stability (Marchant et al. Reference Marchant, Denton, Swisher and Potter1996, Prentice & Krusic Reference Prentice and Krusic2005, Levy et al. Reference Levy, Cody, Crampton, Fielding, Golledge and Harwood2012). Despite the importance of this deposit, no detailed studies of this tephra have been published.
Map of the Dry Valley (DV) region, showing the location and extent of the Hart Ash and the soil profiles. Inset at the lower left is a digital elevation model of the region between Goodspeed and Hart glaciers (Gl) with at a resolution of 2 m. Contour lines are in metres above sea level. The extent of volcanic ash (enclosed black line) is based on surface hardness while walking with GPS tracker. The ripple features (inset) are artefacts of Lidar imaging.
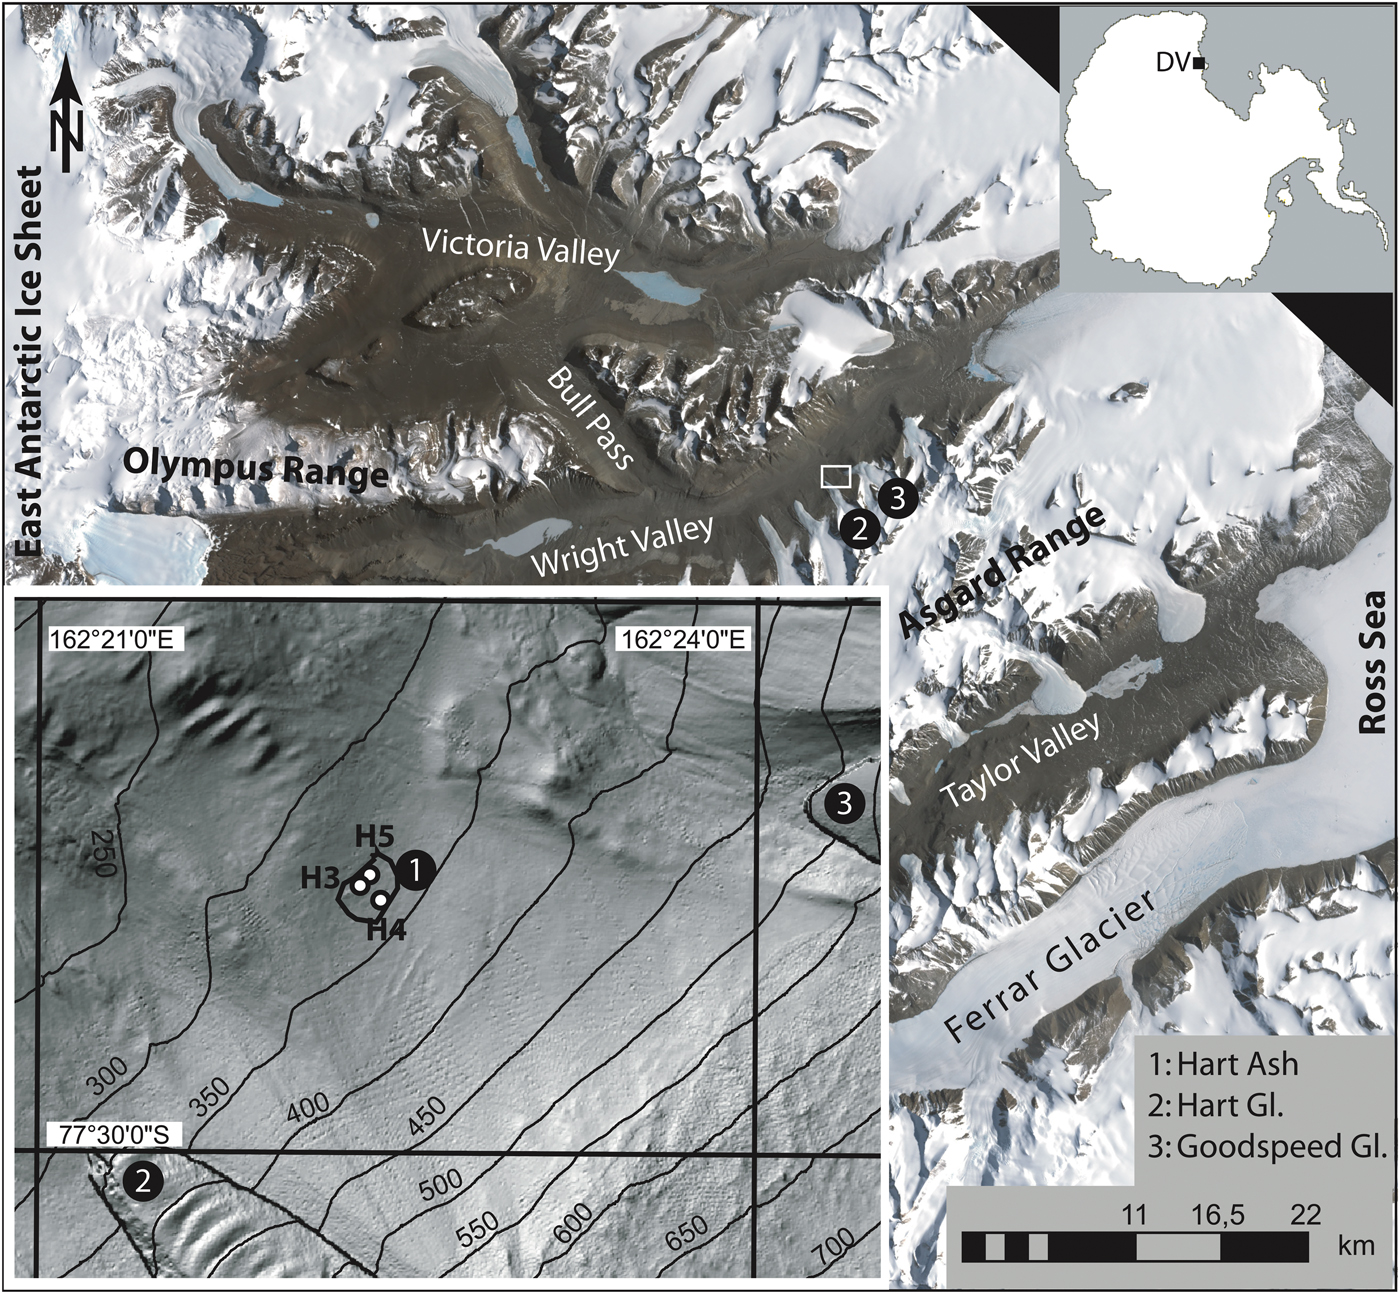
In this paper, a detailed description is given of the Hart Ash from three soil profiles. Visual descriptions, grain size analyses, chemical analyses of glass shards, and 40Ar/39Ar ages of feldspars are used to better understand the origin and emplacement history of this deposit. Our data show that the Hart Ash comprises two chemically distinct, unmixed, phonolitic tephra of which only part of one can be considered a primary fall-out deposit. Our 40Ar/39Ar age for the Hart Ash is 2.97 ± 0.02 Ma or c. 1 Ma younger than the 3.9 Ma age reported by Hall (Reference Hall1992). Although the Hart Ash is the most important Pliocene marker in the MDV, this case study also shows that the mode of tephra deposition remains unclear, indicating that they should not be used as an isochron.
Methods
Three soil pits c. 10 m apart were excavated down to the top of the ice-cemented sediments (Figs 1 & 2). The profiles (named H3, H4 and H5) were described visually and samples were taken at 1 cm intervals in the 2006 Antarctic field season. Contamination of samples with overlying material was avoided by sampling from top to bottom whilst carefully removing the overlying material at each interval.
Grain size analysis
Grain size was measured on the < 2 mm fraction using a Beckman Coulter LS 13 320 Laser Diffraction Particle Size Analyzer at the University of Washington. Repeated analysis of the particle size standards F-110 (reference mean: 135 µm) and 5 µm Minusil (top size: 5 µm) ensured data quality (Schiller Reference Schiller2007). The volume percentages of particle sizes were calculated on the basis of an optical model for garnets with the software Beckman Coulter LS version 4.21. All grain size statistics were calculated with GRADISTAT version 4.0 (Blott & Pye Reference Blott and Pye2001) ignoring particles > 2 mm in size. As a result, the mean grain sizes of samples other than pure tephra are biased to variable degrees towards smaller grain sizes. However, because the grain size analysis was primarily used as a qualitative tool to distinguish between tephra and detrital sand, this bias has no impact on data interpretation.
Elemental analysis of volcanic glass
Tephra were characterized using major and trace element analyses of volcanic glass shards in four samples (see Supplemental Data Table S1 found at http://dx.doi.org/10.1017/S0954102019000129). These samples are representative of the distinct tephra layers found in the three profiles (i.e. H5 at 10 cm, H3 at 10 cm and 100 cm and H4 at 70 cm depths). Analyses were made on the grain size fraction of between 200 and 500 µm.
Major element analysis
Major element concentrations in the glass shards were determined with a JEOL 733 electron microprobe analyser (EMPA) at Victoria University of Wellington. Microprobe analysis of the glass shards was complicated by high sodium concentrations and the unstable nature of the glass material under the electron beam. To minimize Na loss, all glass shards were analysed with a focused, scanning beam at 4 nA beam current, 15 kV acceleration voltage and 20 µm beam diameter. This approach resulted in totals between 95% and 100%. A result of using a low beam current approach is a low count rate, which may partly be responsible for the scatter in the analyses as represented by the two-standard deviation of replicate analyses (2 SD).
Major element chemistry was performed on feldspar separates from H5-10 to characterize samples for 40Ar/39Ar dating. Feldspars were analysed on a Cameca SX100 electron microprobe at the New Mexico Bureau of Geology with a 15 kV acceleration potential, 10 nA probe current and 10 µm beam diameter (see Supplemental Data Fig. S1 found at http://dx.doi.org/10.1017/S0954102019000129).
Trace element analysis
In situ trace element analysis of the volcanic glass shards was performed with an Agilent 7500CS ICP-MS coupled to a New Wave 193 nm deep ultraviolet laser operated at a spot size of 25 µm and a repetition rate of 5 Hz at the Victoria University geochemistry lab. Each sample analysis was bracketed by a measurement of the United States Geological Survey (USGS) calibration standard BCR-2G. A single analysis consisted of 40 background scans across the selected isotope range followed by up to 42 scans whilst ablating the sample. Only parts of the analysis with stable ion counts were used in the data calculations and all data were subjected to a 3 SD outlier rejection scheme. Absolute trace element concentrations in the glasses were calculated by secondary normalization to Ti concentrations measured by EMPA on the same glass shard as the respective laser ablation inductively coupled plasma mass spectrometry (LA-ICP-MS) analysis.
Reproducibility of the trace element data was based on multiple analyses of the USGS standard BHVO-2 G and was < 5% for most elements and < 10% for nearly all elements (Table S1). At least five glass shards from each tephra layer were analysed by LA-ICP-MS and, where possible, two analyses were carried out on each shard. Shards that were significantly different in the same sample were excluded from the dataset. The criteria for excluding data were based on the Zr/Y and Nb/Zr ratios. None of the excluded data was equivalent to analyses of any other sample from the deposit, and it is presumed that these excluded analyses were influenced by the ablation of inclusions or phenocrysts in the glass shards.
40Ar/39Ar dating
Three samples of the Hart Ash were dated, but only two (H5-9 and H5-10) gave meaningful results. Samples H5-9 and H5-10 are from depths of 9 cm and 10 cm, respectively, in profile H5 (Fig. 2). Tephra samples were washed and sieved from the size fraction of 106 to 47 µm to remove large detrital contaminations and particles too fine to analyse. The samples were then acid etched in ~15% HF for 20 min to remove carbonate and adhering glass from the feldspars. Clean crystals were centrifuged for 15 min in heavy liquid (D = 2.58 g/cm3) to float sanidine crystals. Samples were then loaded into copper packets and placed in a six-hole irradiation tray with Fish Canyon sanidine (FC-2 age = 28.2 Ma) (Kuiper et al. Reference Kuiper, Deino, Hilgen, Krijgsman, Renne and Wijbrans2008) as the fluence monitor. All samples were run as multi-crystal aliquots (~40 crystals) to increase signal size and were laser step heated with a CO2 laser at the New Mexico Geochronology Research Laboratory, and the extracted gas was analysed on a Thermo-Fisher ARGUS VI mass spectrometer. However, to remove xenocrystic contamination in some samples, we had to date single crystals.
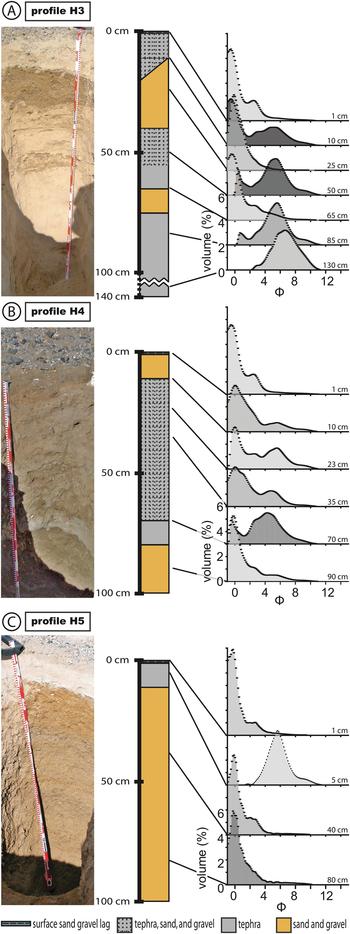
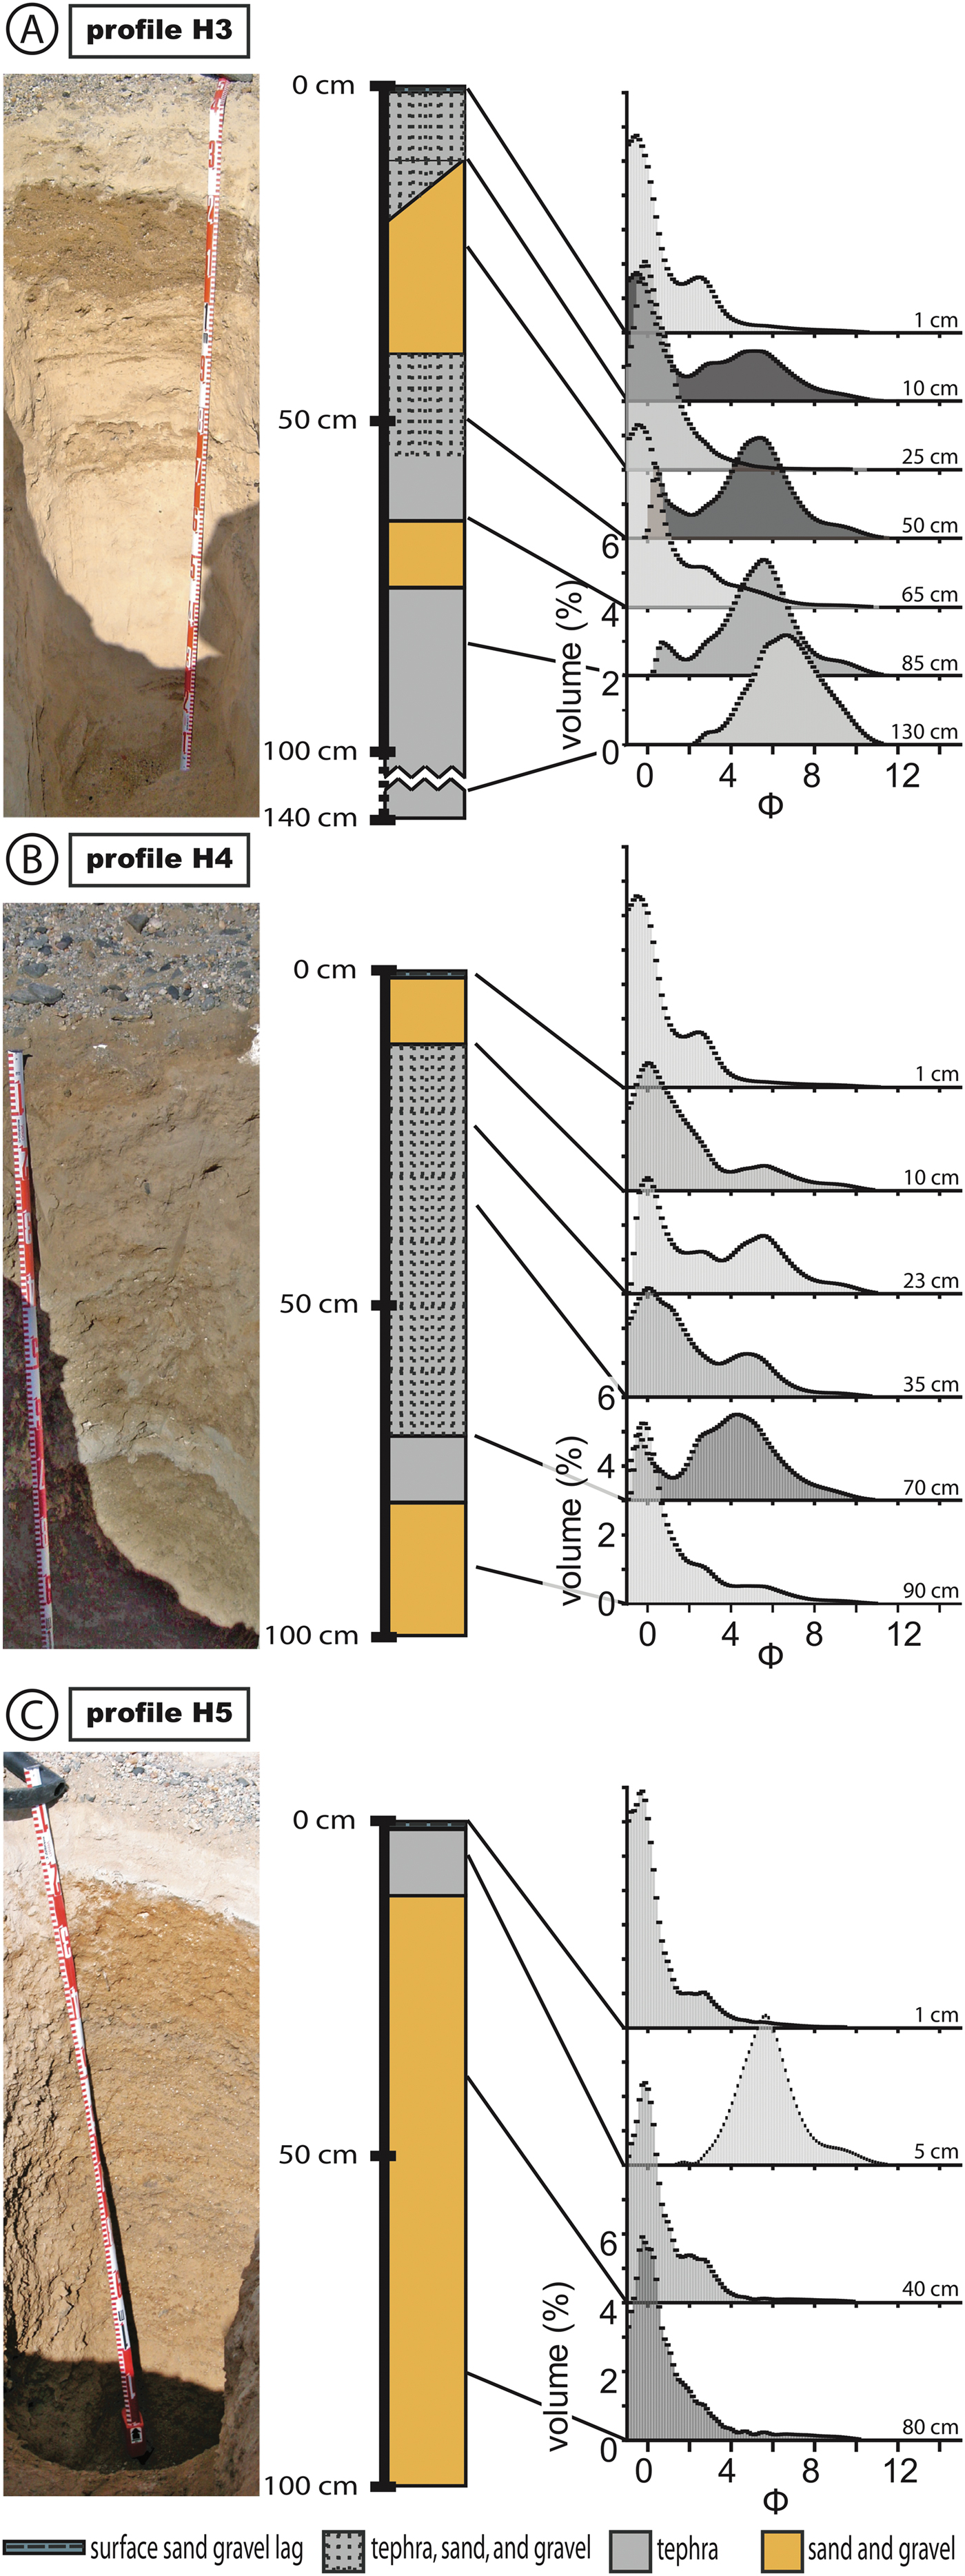
Description and grain size summary of the soil profiles a. H3, b. H4, and c. H5. The stratigraphic columns show the occurrence of tephra, sand and gravel as seen in the photograph for each profile. The tephra at the top of H5 provided the new radiometric age reported in this paper. Grain-size data are for selected samples from each profile (ϕ = –log2 [D/1 mm], where D = grain size in mm). Detailed profile descriptions may be found in the supplemental material.
Results
Profile descriptions and tephra distribution
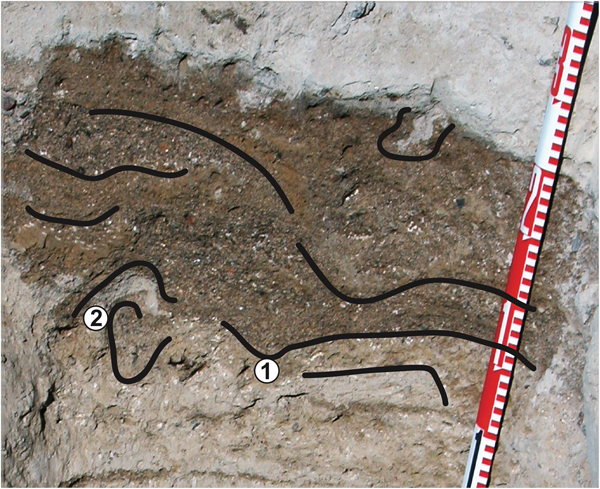
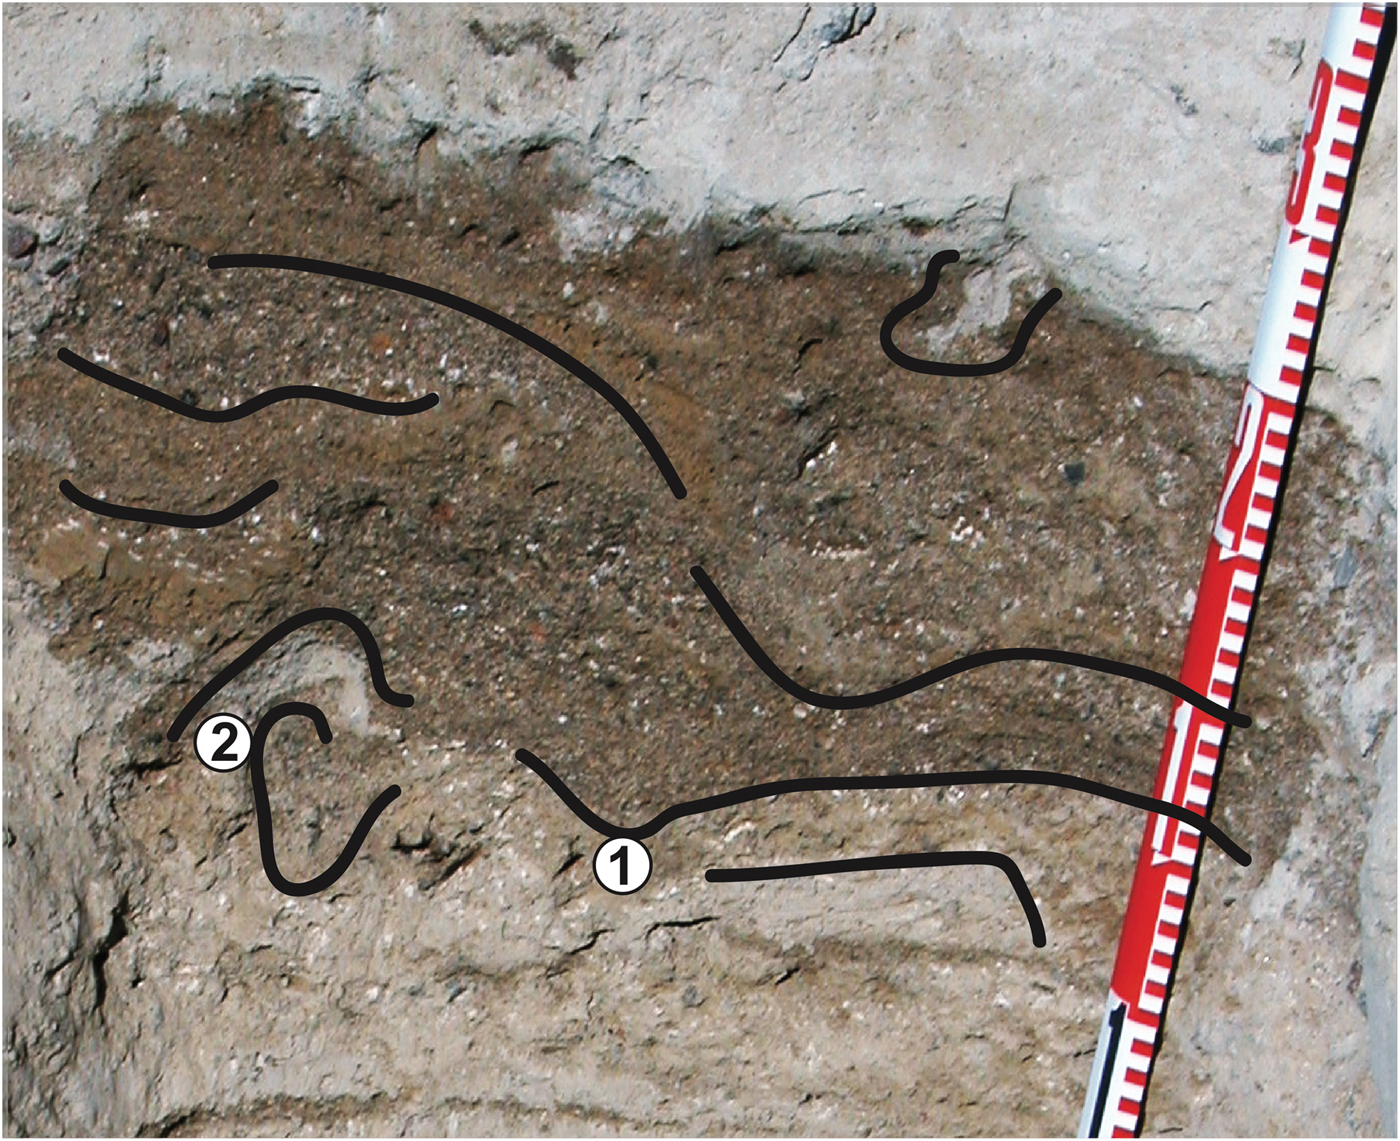
We identified tephra in the three profiles by their distinct modal grain size (silt ~20 µm, 6 ϕ) as compared with the sandy (> 64 µm, < 4 ϕ) sediment (Fig. 2). Profile H3 contained the most complex stratigraphy (Fig. 2a). Here, tephra with little detrital sand is found at between 140 and 80 cm depths, which represents a minimum thickness for this tephra. This > 70 cm-thick tephra is largely homogeneous, white–brown in colour and nearly gravel-free (< 0.5 wt%). From 80 to 70 cm, it is less homogeneous and interbedded with stringers of fine sand. An approximately 10 cm-thick brown sand layer, which has a wavy top and bottom contact, overlies this tephra layer. Overlying this sand is a yellowish–brown sandy tephra, which can be divided into a 10 cm-thick lower part containing no sand stringers and a 10–15 cm-thick upper part with sand stringers. The bimodal grain-size distribution shows this mixture with fine tephra and sand modes (Fig. 2a). The gradational transition to the overlying, brown, 20–30 cm-thick sand layer shows soft-sediment deformation at the basal contact (Fig. 3). Covering this sand with a relatively sharp contact is a yellow, salt-cemented tephra, which is bimodal with silt (tephra) and coarse sand modes.
Enlarged section of profile H3 showing soft-sediment deformation (1) and injection (2) of the underlying soft sediment (tephra). Fine and coarse sand stringers are accentuated with black lines.
In profile H4, tephra occurs at between 80 and 70 cm depths as a greyish–white, c. 10 cm-thick layer with a wavy, but relatively sharp basal contact (Fig. 2b). Above this relatively pure tephra, the proportion of detrital sand increases upwardly for c. 60 cm and changes the colouration of this tephra–sand–gravel mixture to yellowish–brown. This transition in colour varies from sharp to gradational. The lower parts of the mixed layer are bimodal with tephra and coarse sand. Towards the top, a medium-grained sand accompanies these modes. The top 10 cm of profile H4 is free of tephra, but it is strongly salt-cemented.
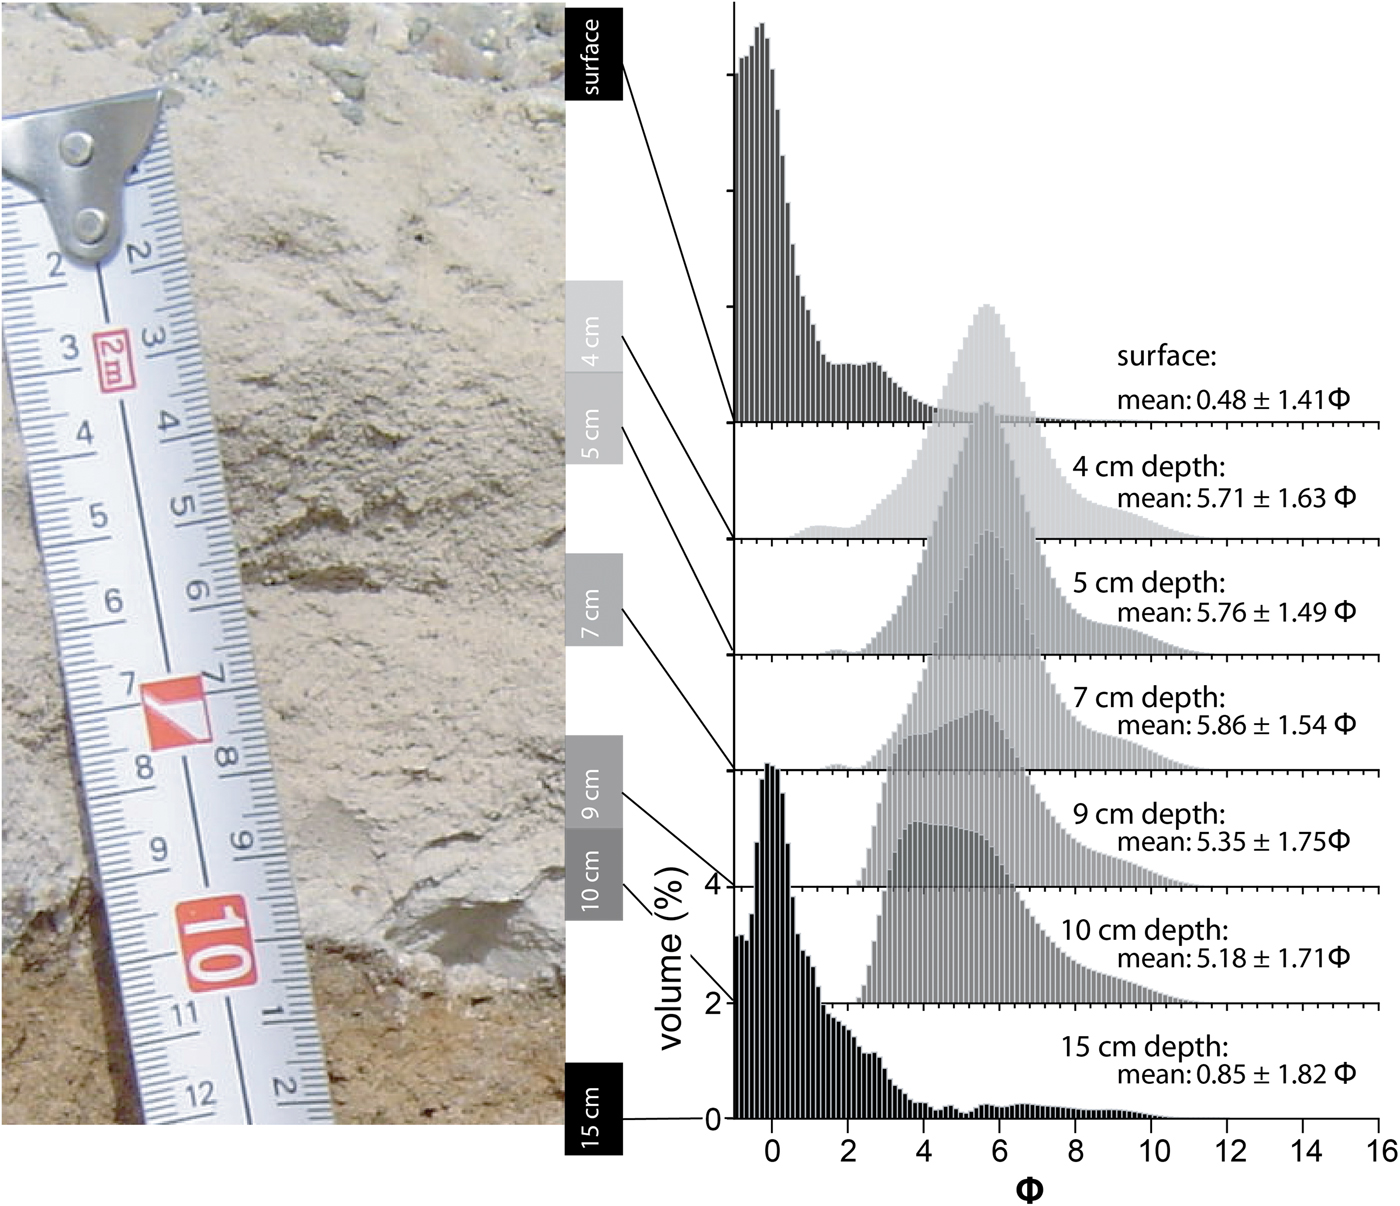
Profile H5 is c. 120 cm deep, and from the bottom up to 11 cm below the surface it consists of a homogeneous, strongly salt-cemented, reddish–brown deposit of gravelly coarse sand (Fig. 2c). At 11 cm depth is a 1 cm-thick layer of sand and gravel mixed with minor amounts of tephra. This gravel–sand layer is covered by 10 cm of white tephra with a mode of 5.64 ϕ, which is clearly distinguished from the > 2 mm sand fraction with a mode of −0.48 ϕ (Fig. 4). This tephra is free of particles > 1 mm (sand mode) and therefore has no bias in the grain-size statistics. The tephra is covered by gravel and sand, which is similar to the surface layers in the other profiles.
Enlarged photograph showing the tephra layer in profile H5. The detailed grain-size distribution shows an increase in mean size towards the base, reflecting more rapid air settling of coarser particles than fine particles during eruption.
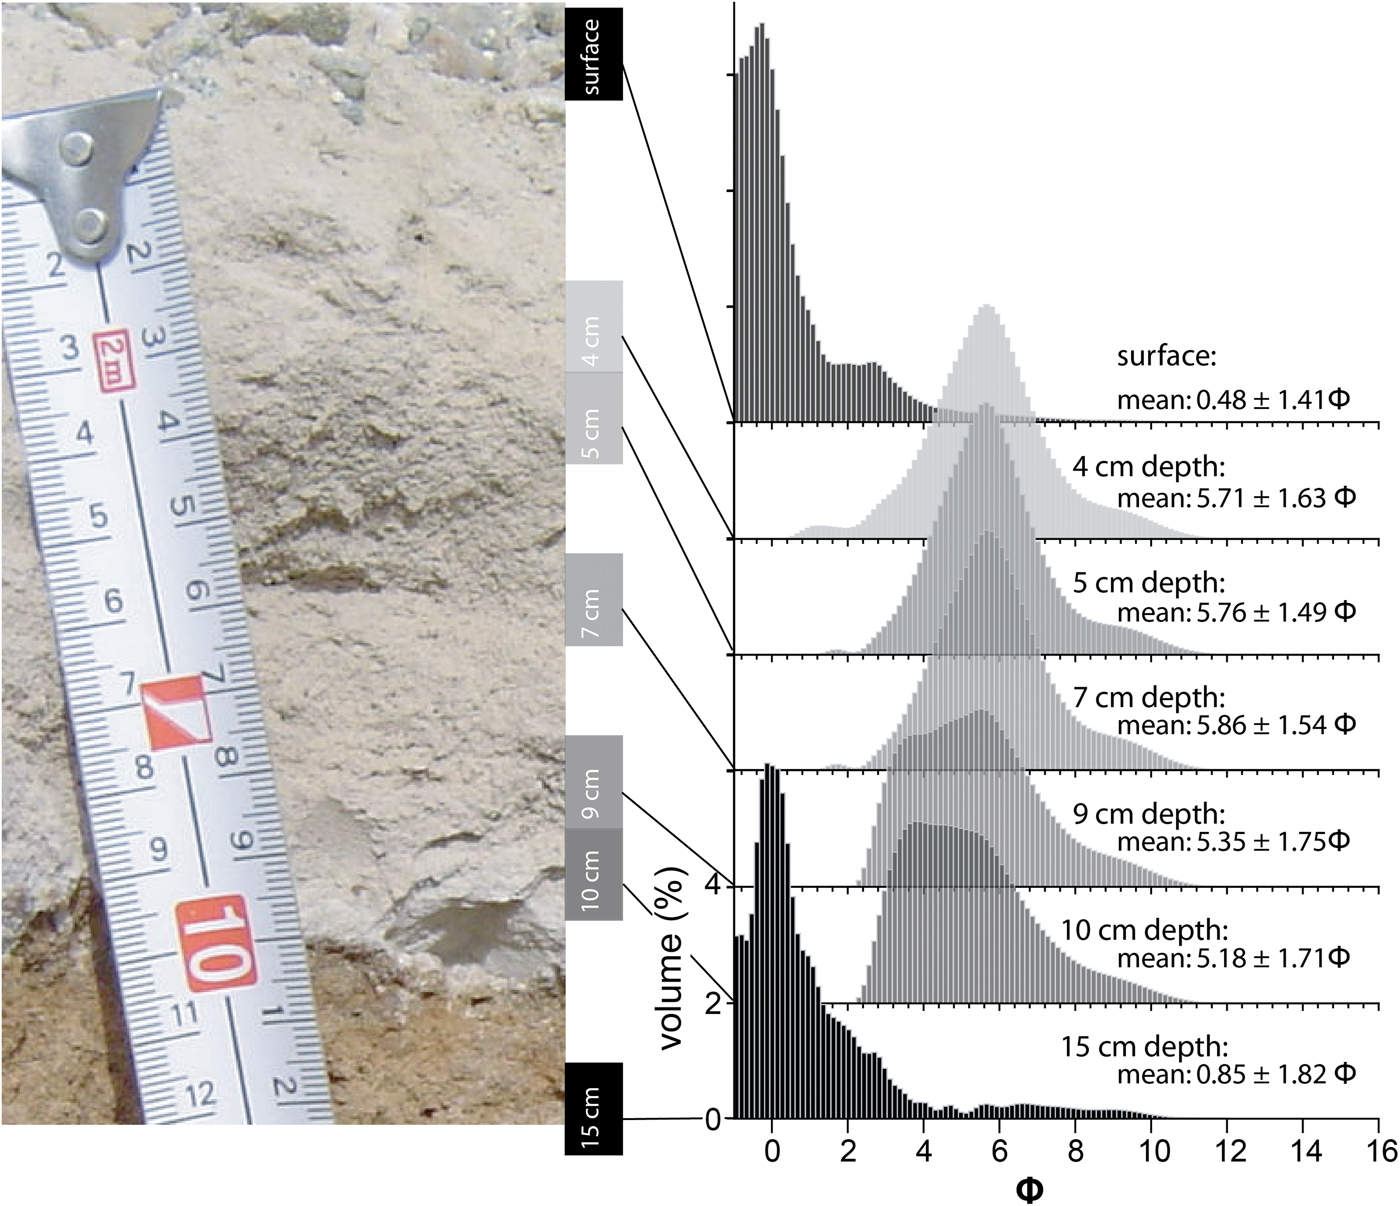
On close inspection, the tephra in H5 (0–10 cm depth) contains particles of fine sand to coarse silt and has a poorly sorted, unimodal distribution (Fig. 4). The mean grain size in the upper part of the tephra is 5.78 ϕ (samples at 4, 5 and 7 cm depth) and decreases downwards to 5.18 ϕ (sample at 10 cm depth). The coarsening downwards trend has little influence on sorting.
Glass chemistry
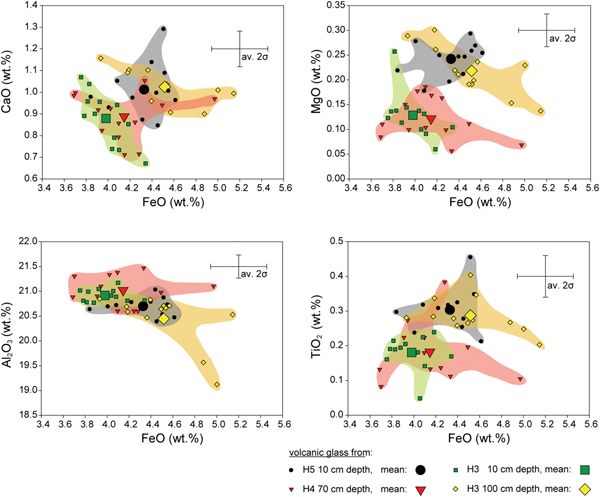
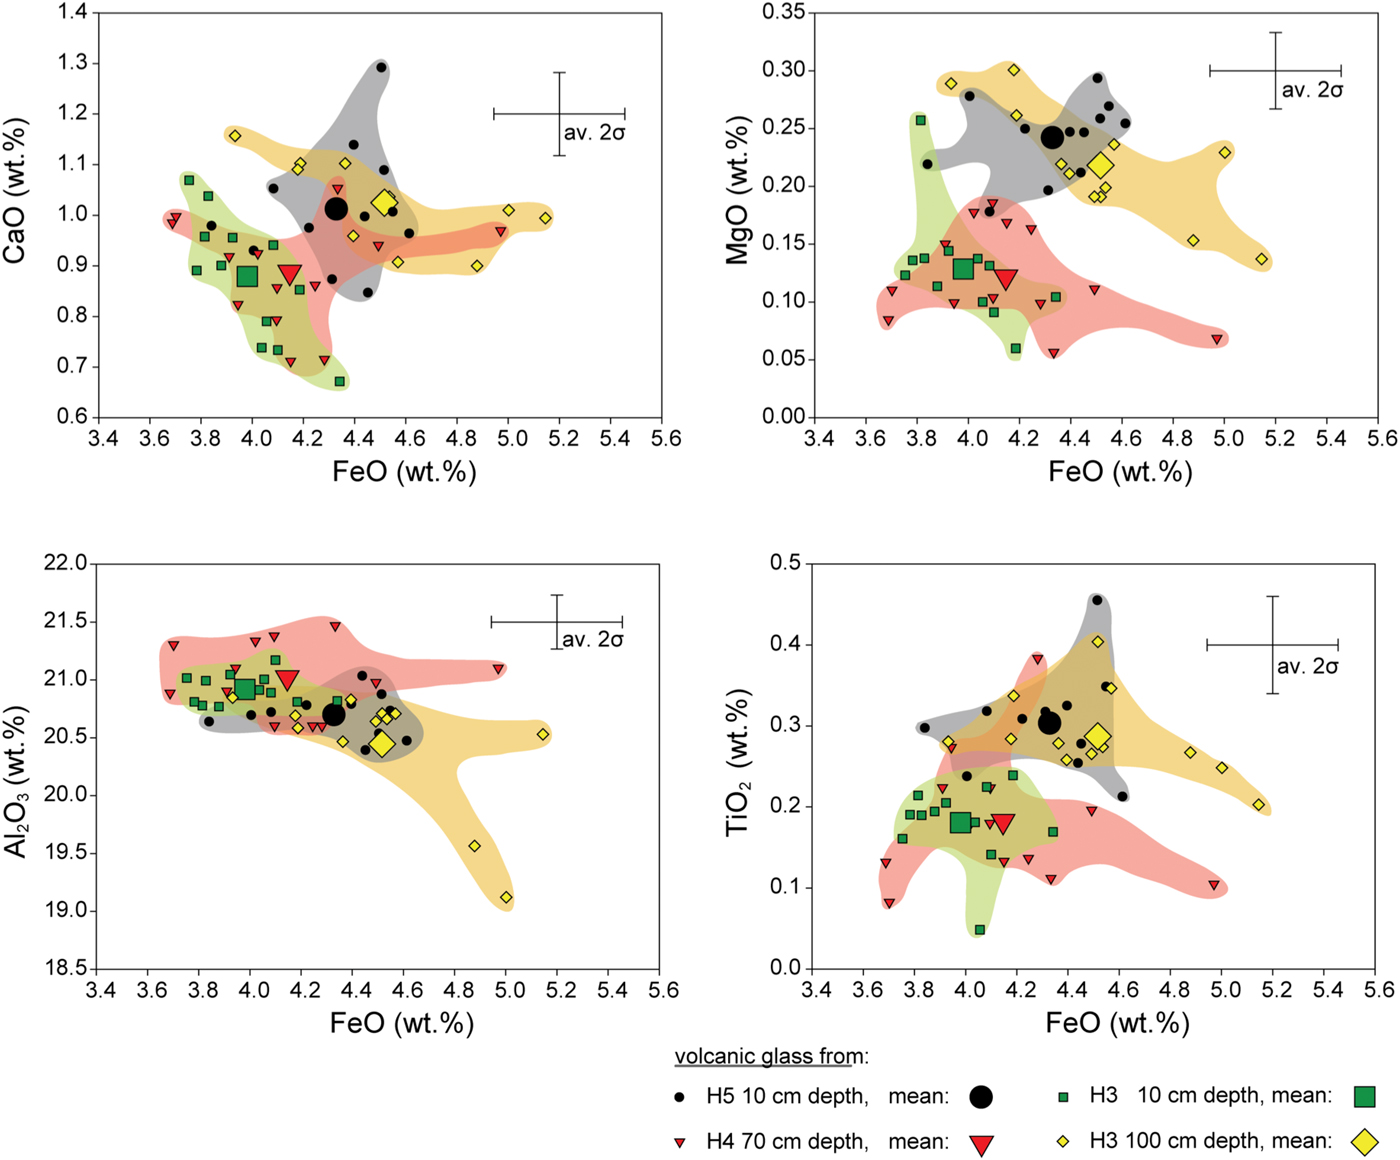
To better understand the volcanic source of the Hart Ash and the stratigraphic relationship of tephra, we geochemically characterized glass shards in the four distinct tephra layers in the three profiles (Table S1). Major and trace element data show two distinct populations of tephra (Figs 5 & 6). These groups are based on CaO, MgO, TiO2, Al2O3 and FeO concentrations, which are all sensitive to fractional crystallization of evolving magmas. Samples H5 10 cm and H3 100 cm form one group, while samples H4 70 cm and H3 10 cm form a second group (Fig. 5). However, these two populations of tephra are better defined by the trace element data.
Major element plots showing CaO, MgO, Al2O3 and TiO2 vs FeO of four tephra in profiles H3, H4 and H5. Two groups of tephra compositions can be broadly distinguished: H5 10 cm, H3 100 cm and H4 70 cm, H3 10 cm.
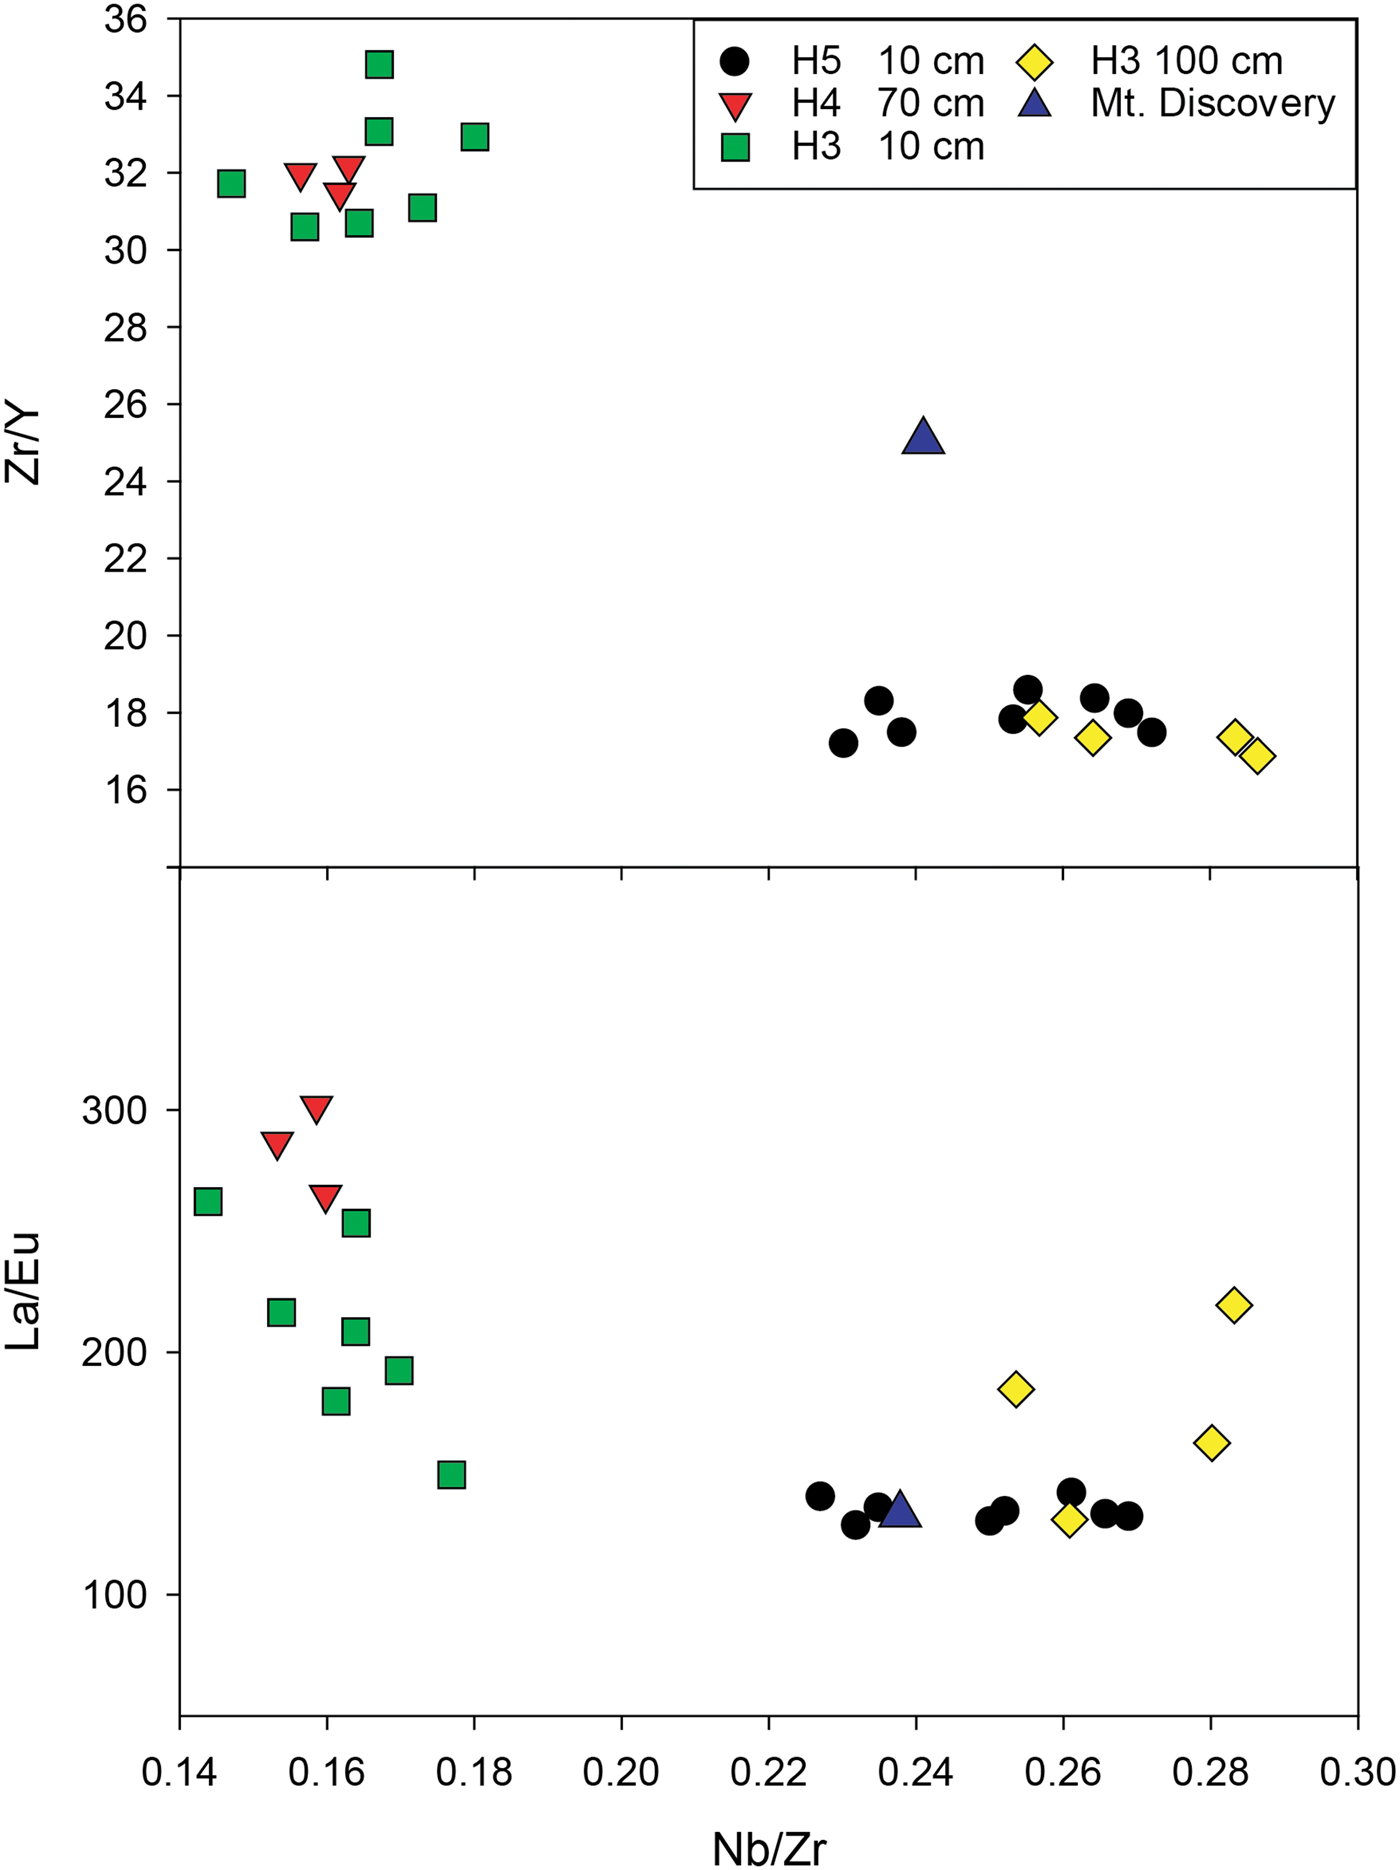
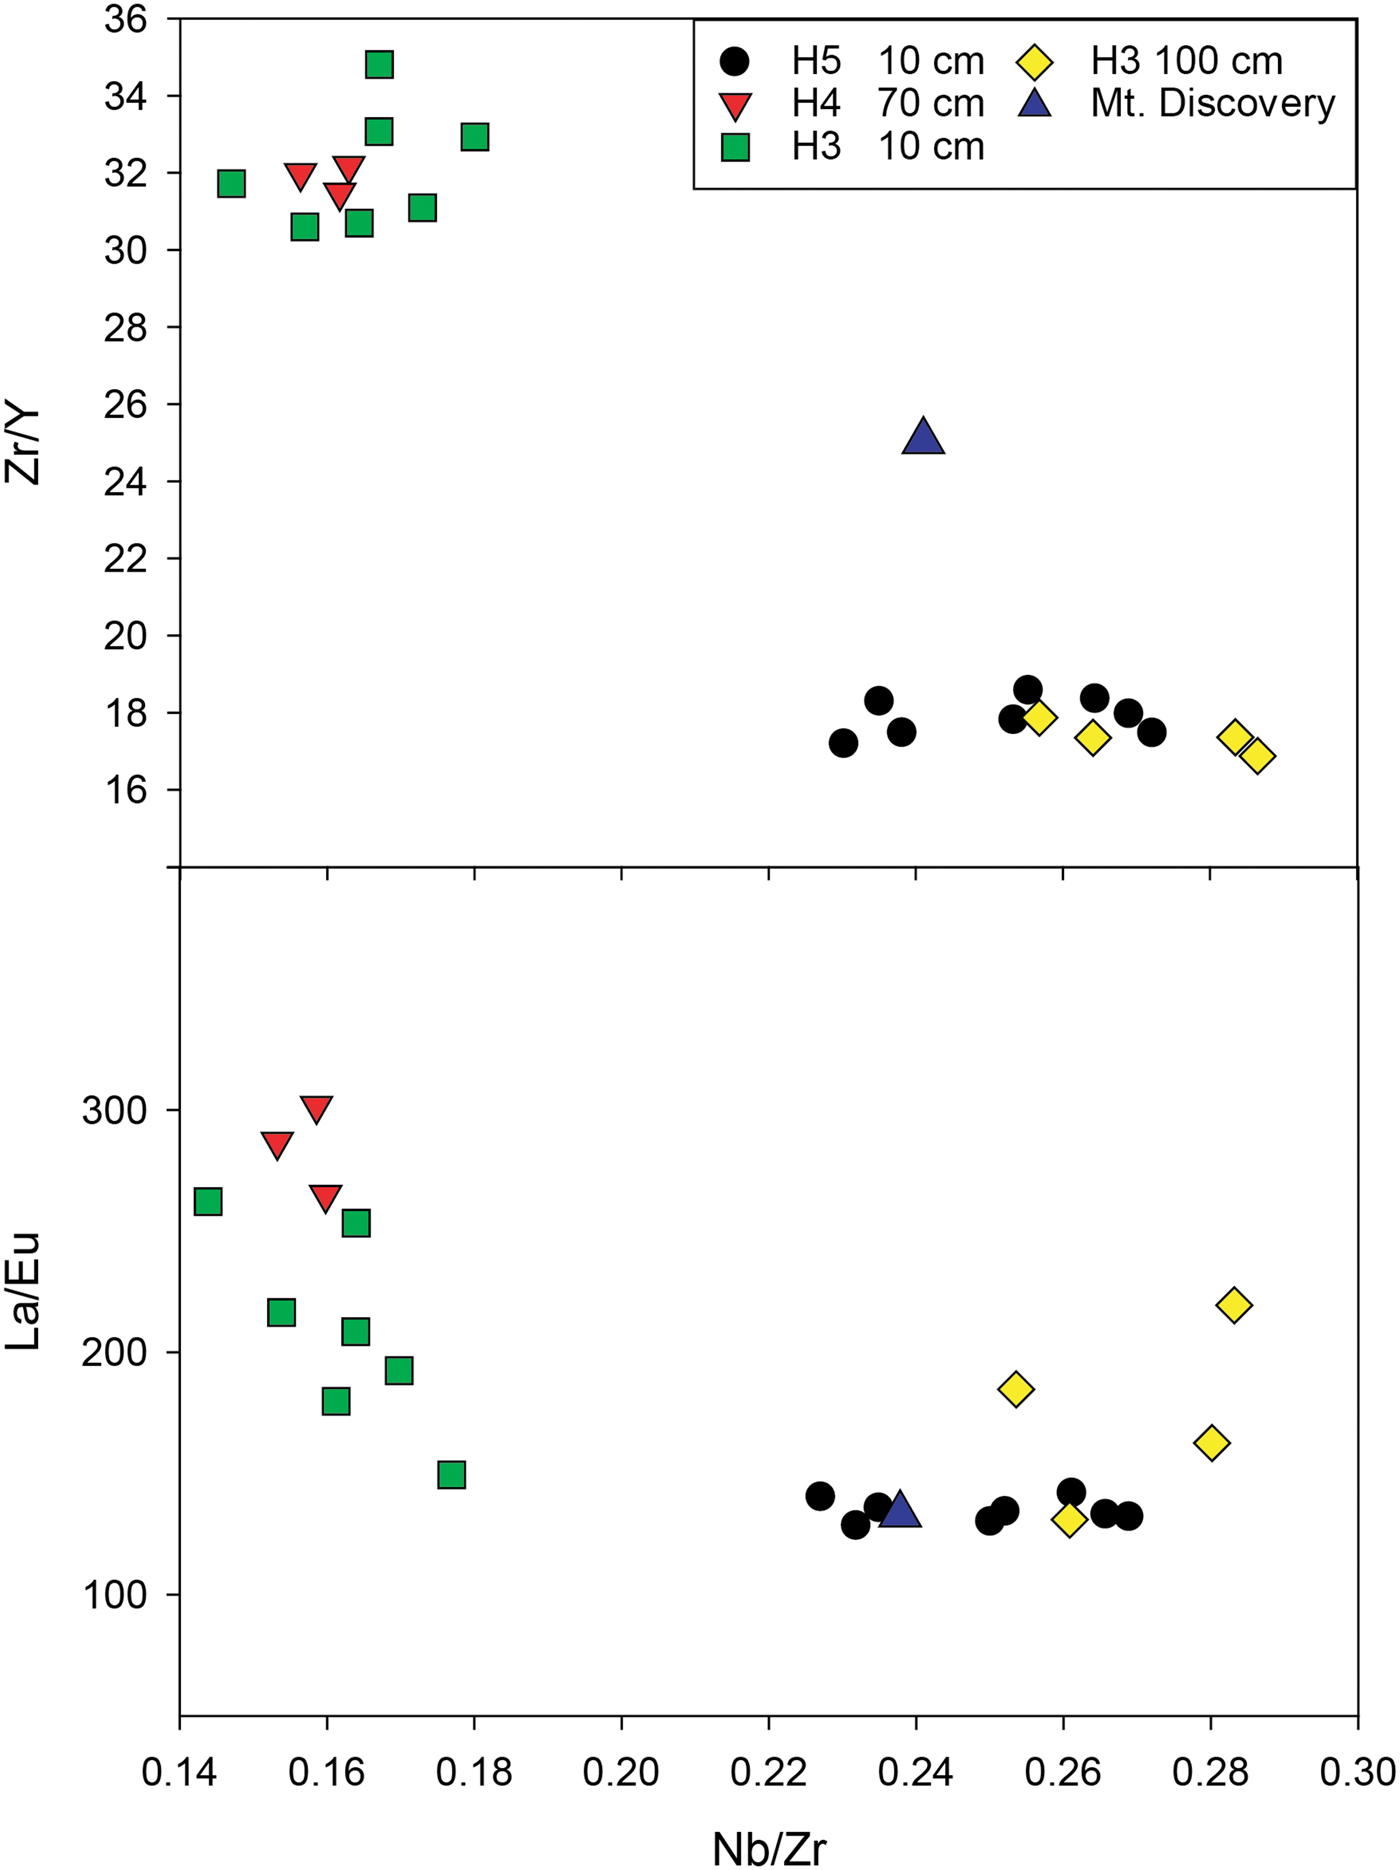
Rare earth elements (REEs) show a good separation of the two groups (H4 70 cm, H3 10 cm and H5 10 cm, H3 100 cm) of tephra (Fig. 6 and Supplemental Data Fig. S2 found at http://dx.doi.org/10.1017/S0954102019000129). Glass shards in all four samples are relatively enriched in light REEs (LREEs) compared with heavy REEs (HREEs) ([La/Yb]n = 12.0–14.3). In addition, they are enriched in LREEs compared with chondrite abundances (Fig. S2).
Plots showing selected trace element ratios for the glass shards. Two tephra are distinct and do not overlap with the Mount Discovery phonolite. Estimated uncertainties in the ratios based on standard analyses are Zr/Y = 5.1%, Nb/Zr = 0.25% and La/Eu = 9.0% (2 SD).
40Ar/39Ar ages
Sample H4-70 did not produce a meaningful age for the Hart Ash because many feldspar crystals were > 400 Ma (Supplemental Data Fig. S3 found at http://dx.doi.org/10.1017/S0954102019000129). Palaeozoic granitoids are widespread in the Wright Valley and the probable source of these contaminants is old feldspars (Cox et al. Reference Cox, Turnbull, Isaac, Townsend and Smith2012).
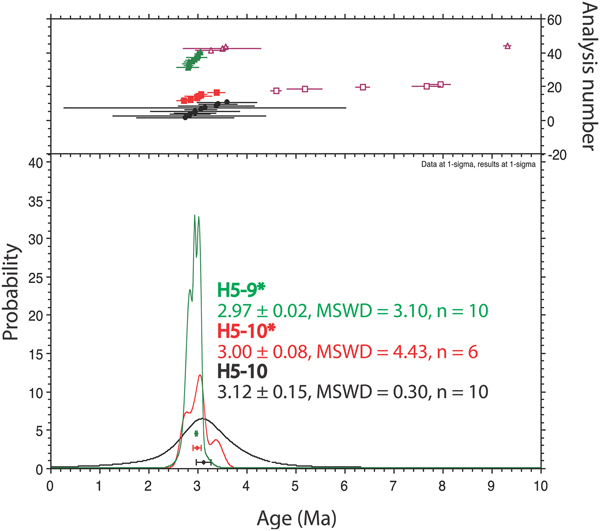
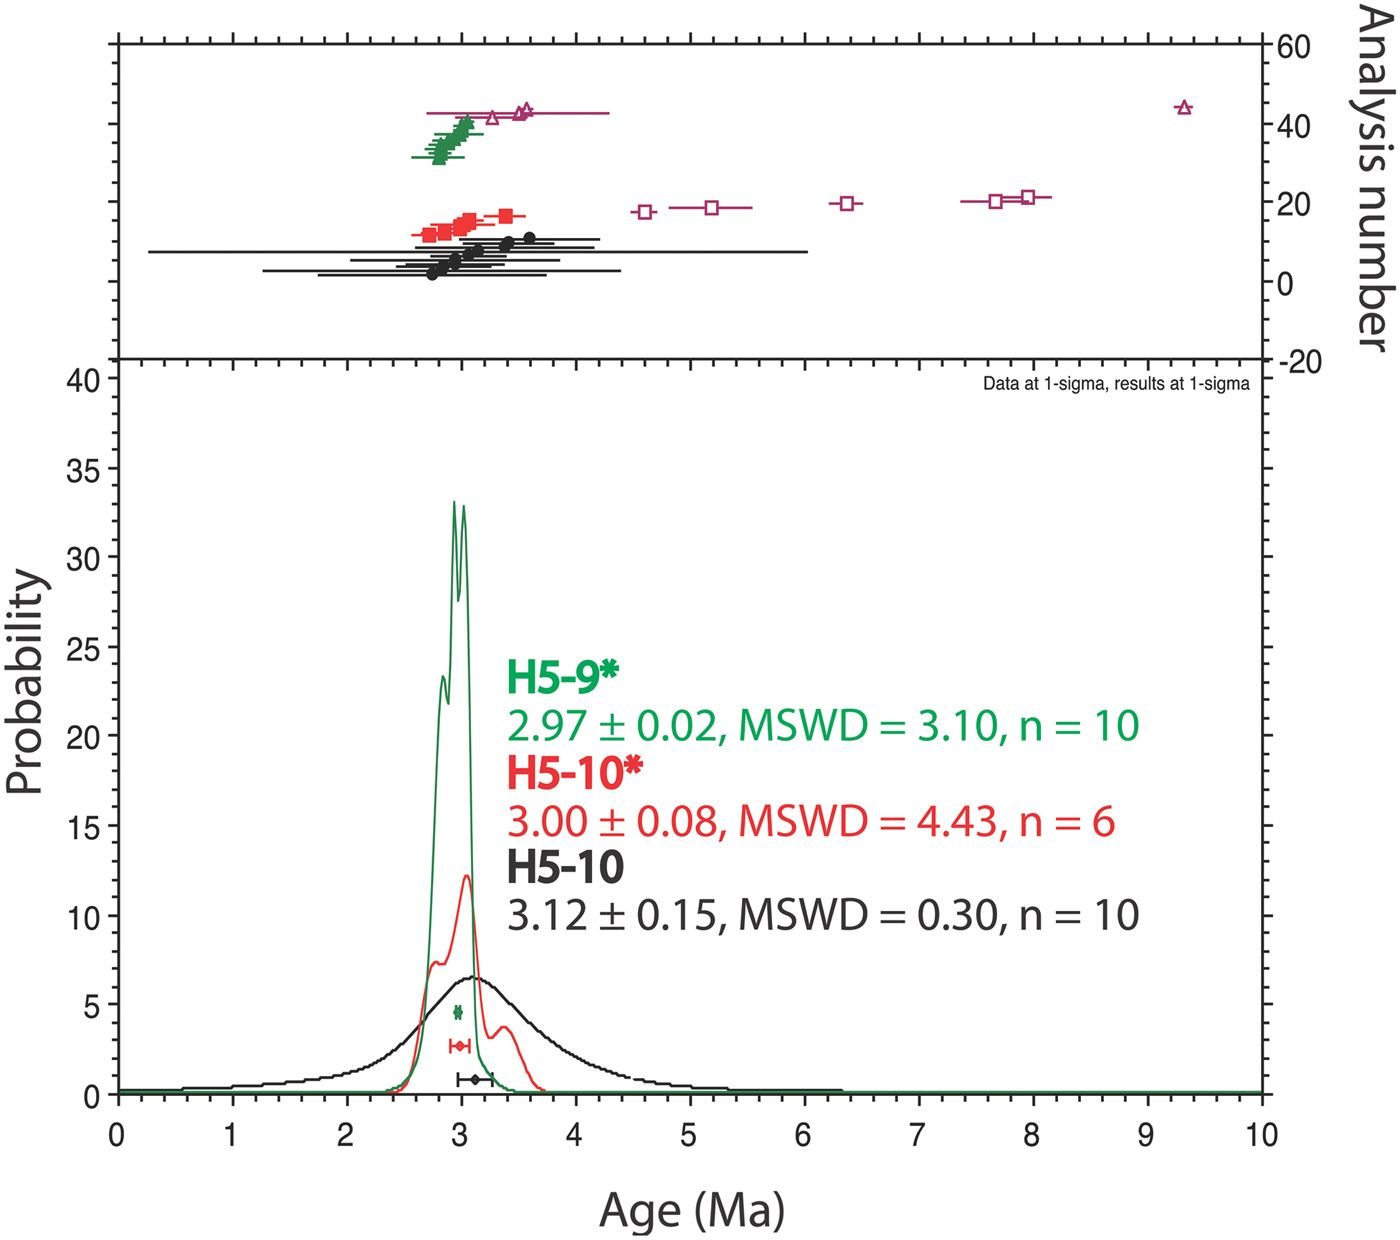
Ten single crystal ages for sample H5-9 gave an ideogram age of 2.97 ± 0.02 Ma (mean squared weighted deviation (MSWD) = 3.10) with a few older and younger outlier ages (Supplemental Data Fig. S4 found at http://dx.doi.org/10.1017/S0954102019000129). Single crystal ages for sample H5-10 were analysed in two separate irradiations, and these gave ideogram ages of 3.12 ± 0.15 Ma (n = 10, MSWD = 0.30) and 3.00 ± 0.08 Ma (n = 6, MSWD = 4.34) (Supplemental Data Fig. S5 found at http://dx.doi.org/10.1017/S0954102019000129). All three age determinations overlap when considering the uncertainty of the ages (Fig. 7). The best estimate for the age of the Hart Ash is given by sample H5-9, which has the lowest uncertainty and gives an age of 2.97 ± 0.02 Ma. Although robust, this is considered to be the maximum age because of the potential for xenocrystic contamination.
Ideogram comparison of 40Ar/39Ar ages from sediment profile H5. Two sample depths produced meaningful ages from two different dating attempts. The first (H5-10) dated single feldspar crystals. The second attempt dated both H5-10* and H5-9* and involved c. 40 crystals per aliquot to improve precision. However, some of these crystals contained xenocrysts, and these points are not used in the final age. Data points are shown at 1 σ errors and the final age given with 2 σ errors.
Discussion
Two tephra populations
Major and trace element chemistries clearly show two populations of tephra in the Hart Ash (Figs 5, 6 & Fig. S2). Furthermore, the lower concentrations of CaO, MgO, TiO2 and FeO in the H4 70 cm, H3 10 cm group suggest that this tephra is more chemically evolved than the tephra from the H5 10 cm, H3 100 cm group.
High LREE/HREE ratios are typical of intraplate alkaline magmas (Fig. 5; Panter et al. Reference Panter, Kyle and Smellie1997). All samples also have distinct negative europium anomalies (Eu/Eu* = 0.19–0.27), which result from progressive fractional crystallization of feldspar in the parental magmas. The chemical similarities of these two tephra populations suggest that they share a common source that had undergone slightly different degrees of magmatic evolution. As shown by their strong depletion in Ba, Sr and Ti, Hart Ash tephra are chemically more evolved than anorthoclase-rich phonolites from Mount Erebus (Fig. 5b).
Two populations of tephra are also evident from the Zr/Y, La/Eu and Nb/Zr ratios (Fig. 6). Variability of La/Eu ratios in the glasses reflects inhomogeneity in the erupted material because La/Eu increases as the fractional crystallization of feldspar progresses due to preferential removal of Eu2+ from the magma by feldspar as compared with the trivalent REEs. Of all the tephra samples, H5 10 cm is the most homogeneous, and this may be related to possible in situ preservation where vertical mixing has not occurred.
Source of the Hart Ash tephra
Major element abundances were used to identify possible tephra sources. In general, the major element chemistry of the volcanic glasses is similar and, based on total alkalis (K2O + Na2O = 16 wt%) and silica (SiO2 ≈ 56 wt%) content, they are classified as phonolitic. Thus, the local cinder cones in the Wright and Taylor valleys that have been dated to < 5 Ma and have produced basanitic magmas (Kyle Reference Kyle1990) are not sources of the Hart Ash. Other phonolite-producing volcanoes found in Marie Byrd Land and northern Victoria Land are too distant (> 1500 and > 350 km, respectively) to be possible sources.
A potential nearby source for phonolites is the Erebus volcanic province (EVP) where various volcanic centres have been active since 24 Ma and have erupted a range of lava types (basanite to phonolite/trachyte) during their lifespan (Kyle Reference Kyle1990, Martin et al. Reference Martin, Cooper and Dunlap2010). Phonolite lavas with major element chemistries similar to the glass in the Hart Ash have been reported from Minna Bluff and Mount Discovery, which are volcanic centres that lie c. 120 km south of Wright Valley (Kyle Reference Kyle1990). However, because Minna Bluff was not active 3 Ma (Ross et al. Reference Ross, McIntosh and Dunbar2012, Ross Reference Ross2014), the Mount Discovery volcanic centre is the most probable source of the Hart Ash in the EVP.
REE patterns for Hart Ash tephra are similar to those of phonolites from Mount Discovery. Tephra from H5 10 cm and H3 100 cm have comparable Nb/Zr and La/Eu ratios to Mount Discovery phonolites (Fig. 6). Although the Zr/Y ratios of the Hart Ash tephra differ significantly from known Mount Discovery phonolites (Wright & Kyle Reference Wright and Kyle1990), similarity in the age, chemistry and proximity of this volcanic centre make it the most probable source of the Hart Ash.
Differences in chemistry between Mount Discovery rocks and Hart Ash tephra may be artefacts of different analytical approaches. Hart Ash data were acquired on single glass shards that exclude contributions from phenocryst phases, whereas the Mount Discovery data were acquired by X-ray fluorescence analysis of bulk samples (Wright Reference Wright1987). Bulk compositions can differ depending on the concentration and composition of phenocryst phases in the tephra. Eruptions from different vents could also lead to the observed variations in the trace elements.
Stratigraphic correlation and emplacement of the Hart Ash tephra
To summarize the stratigraphy of the three profiles, tephra in H3 occurs in a c. 10 cm-thick layer with a mixture of sand and gravel directly below the surface gravel lag. Two other layers with decreasing sand content occur at c. 35–60 cm and > 70 cm depths (Fig. 2a). Profile H4 has a thick layer of tephra–debris mixture from c. 10 cm below the surface down to 70 cm depth, where c. 10 cm of relatively pure tephra is found (Fig. 2b). In contrast, the tephra in profile H5 occurs as a 10 cm-thick layer below the surface gravel lag and rests on gravels that are similar in size and composition to those on the surface (Fig. 2c). This observation led Hall et al. (Reference Hall, Denton, Lux and Bockheim1993) to interpret the gravels as a palaeodesert pavement.
From previous work, criteria used to identify in situ tephra deposits in the MDV include: 1) the survival of pristine glass shards (Hall et al. Reference Hall, Denton, Lux and Bockheim1993, Marchant & Denton Reference Marchant and Denton1996), 2) the preservation of underlying desert pavement (Marchant et al. Reference Marchant, Denton, Sugden and Swisher1993a, Reference Marchant, Swisher, Lux, West and Denton1993b), and 3) the absence of non-volcanic components in the tephra (Marchant et al. Reference Marchant, Denton, Sugden and Swisher1993a, Marchant & Denton Reference Marchant, Denton, Swisher and Potter1996). However, none of these criteria is unequivocal for in situ preservation. A more robust signature, obtained from detailed grain size analysis of tephra, is the preservation of a gradation in grain size due to differential settling in the atmosphere (Koyaguchi Reference Koyaguchi1994) or the presence of crystal lag deposits. Detailed grain-size analysis also helps relate the distance from the volcanic source and quantifies the amount of the non-volcanic component.
The grain size of the H5 tephra coarsens downwards, and it is free of particles of > 1 mm. This downwards coarsening in grain size is best explained by the different settling speeds of particles out of the air column, which is typical for tephra-fall deposits. As such, this is the only tephra in the profiles where in situ preservation is demonstrated, and this is especially important for using the age of the tephra as a fixed datum for stratigraphic reconstructions.
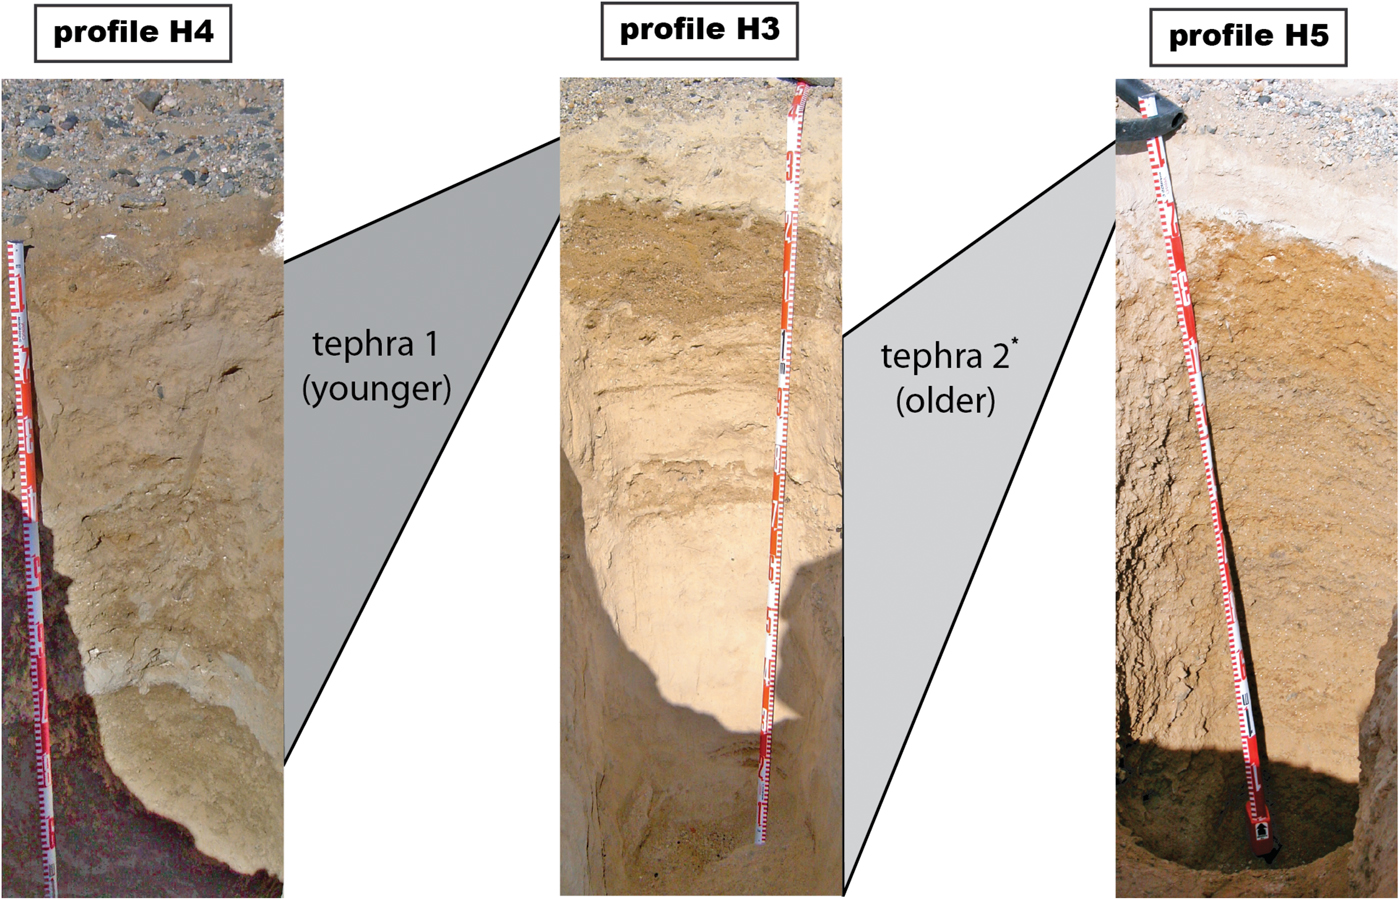
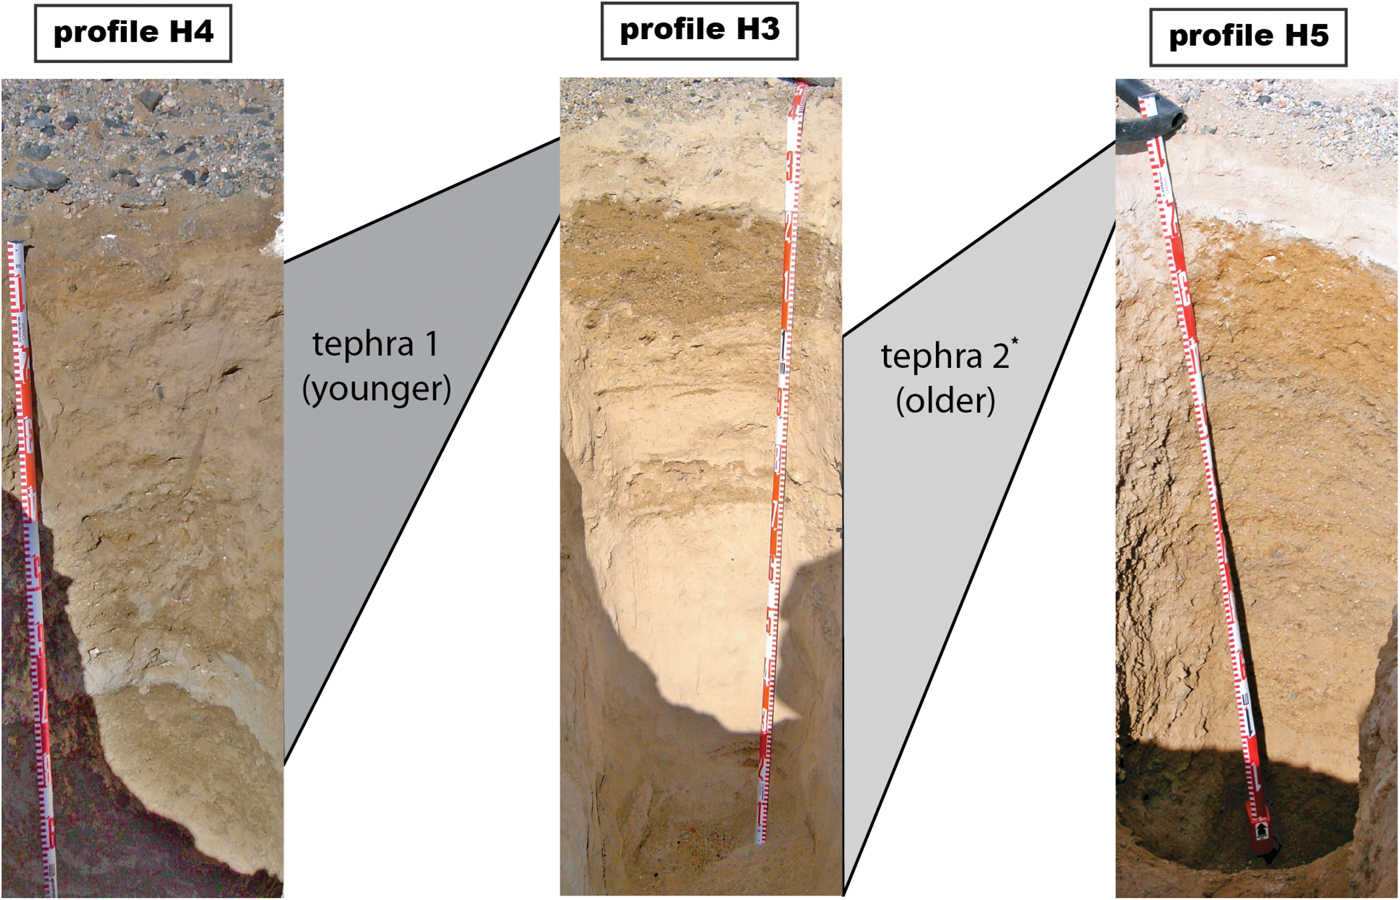
Chemical characterization of glass shards in the tephra horizons allows for the establishment of a relative stratigraphy, which is not a straightforward correlation (Fig. 8). The oldest horizon is found at the base of profile H5, where it is overlain by a 10 cm-thick tephra that appears to be an in situ fall-out deposit (Figs 2c, 4 & 8). Thus, we dated the older of the two tephra. Chemically, this older tephra is also present at the bottom of profile H3, where it is > 60 cm thick. The thickness and sand content of this tephra in profile H3 indicate that it was redeposited. The effects of mobilization and reworking are evident from its gradual transition into overlying sand (Fig. 2a). Capping this sand layer in H3 is a 10 cm-thick tephra that is chemically similar to the tephra in H4, where it is c. 70 cm thick and contains variable amounts of sand. Despite the sharp contact with the underlying sediment in both profiles, this tephra is not in situ, but based on its preservation and low content of sand and gravel, it was probably redeposited shortly after initial fall-out deposition. Clearly, we could not recognize the complexity of this stratigraphic correlation without the geochemical information.
Stratigraphic correlation of the chemically distinct tephra deposits in profiles H3, H4 and H5. Detailed profile descriptions may be found in the supplemental material. *Dated tephra in this study.
Sedimentary structures found in the sand and tephra layers of profile H3 give clues to the environmental conditions under which the tephra were redeposited. The lower tephra (H3, 40–140 cm) has minor amounts of detrital contamination, which increases towards the top of the layer. This mostly occurs in the form of thin sand stringers, but there is also a 10 cm-thick sand layer. The thickness and appearance of this tephra-rich horizon is best explained as windblown accumulation in a sheltered location. The upper tephra in H3 changes significantly in thickness across the face of the excavation. This observation suggests that the upper tephra in H3 is part of a deposit that was filling a depression or channel that had already led to the preservation of the lower tephra. Preservation and protection from erosion of the lower tephra in H3 occurred in the form of a 20–30 cm-thick sand layer. The contact between tephra and sand shows soft-sediment and injection structures, which are normally ascribed to loading during rapid deposition (Fig. 3). In addition, the sand layer has features of turbulent flow, which are best explained by rapid deposition through slumping of a water-saturated sediment.
Possible sources of water at the Hart Ash site are rain and snowmelt. Rain is improbable if local climate conditions at the time of tephra deposition were similar to those of today. However, evidence from 10Be in profile H5 (Schiller et al. Reference Schiller, Dickinson, Ditchburn, Graham and Zondervan2009) indicates that the climate prior to tephra deposition may have been warmer than that of the present. In addition, evidence from sediment cores (McKay et al. Reference McKay, Browne, Carter, Cowan, Dunbar and Krissek2009) and glacial morphology (Prentice et al. Reference Prentice, Bockheim, Wilson, Burckle, Hodell, Schlucher and Kellogg1993) suggests that the climate in the Pliocene was warmer than that of the present. The probable outcome of a warm Pliocene climate was an increase in precipitation and snow accumulation. Hence, a plausible source of water could be snowmelt induced by a tephra-darkened snow surface, which would cause abnormally high amounts of runoff, resulting in water-saturated, unstable sediment. Repeated slumping and creep of water-saturated soils would produce a complex stratigraphy of tephra and sand layers, thereby protecting the tephra from wind erosion. Because slumping occurs locally, tephra deposits could not be preserved over a wide area. For the Hart Ash, this scenario suggests that separate slumping events followed the deposition of the two tephra and resulted in their preservation. If this preservation mechanism is correct, then it also suggests that each tephra deposit event was closely followed by an episode of reworking. Thus, the age of a single tephra deposit might have some chronological significance to the underlying sediment.
Despite clear evidence of sediment reworking in profiles H3 and H4, the tephra in H5 appears to be largely in situ. We interpret its small, restricted grain size as a distal bimodal stratification of an eruption in a downwind direction. Bimodal tephra deposits are common, and a clear separation in the profile diminishes with distance from the source (Pyle Reference Pyle1989, Wiesner et al. Reference Wiesner, Wetzel, Catane, Listanco and Mirabueno2004). The lack of particles larger than 2 ϕ in the lower part of the tephra indicates a distal source. However, its thickness (10 cm) indicates a relatively proximal source, and this suggests that the fall-out may have been syndepositionally modified to concentrate or thicken the tephra in some way.
The distribution of volcanic ash over continental areas is highly complex due to changing wind fields, sheltering effects of the ground and variable phases of eruption (Watt et al. Reference Watt, Pyle, Mather, Martin and Matthews2009). Fine-grained tephra layers typical of distal deposits commonly have a thickness of a few millimetres to centimetres. With this in mind, interpreting the 10 cm-thick H5 tephra as a fall-out deposit seems unusual because it is 120 km distant from Mount Discovery, the most probable source. In addition, this tephra is only preserved in a very small area, which possibly results from erosion and slumping. While the initial deposit may have covered a wide area, it is not clear how a phonolitic eruption from the EVP, 120 km distant, could have produced a primary deposit 10 cm thick, covering thousands of square kilometres. Eruptive deposits from the EVP are not extensive, and only minor amounts of tephra are locally preserved (Kyle Reference Kyle1990, Martin et al. Reference Martin, Cooper and Dunlap2010).
The eruptive style of Mount Discovery and the physical characteristics of the H5 tephra present a significant conflict. Strong sedimentological evidence suggests this tephra is in situ, yet some form of reworking seems necessary to produce a 10 cm-thick deposit from a distal source. One possibility is localized reworking and concentration of tephra within different parts of the Wright Valley. This remobilization could happen several years after the initial eruption, as was seen after the Eyjafjallajökull eruption in 2010 (Liu et al. Reference Liu, Cashman, Beckett, Witham, Leadbetter, Hort and Guðmundsson2014). Localized preservation of the Hart Ash tephra seems to require rapid burial after deposition with subsequent erosion of overlying sediment to the present day, where the tephra is now fortuitously exposed at the surface. Unfortunately, the aerial extent of the tephra is unknown and we do not have the data to resolve these conflicting observations.
Implications of the new age
Our new, precise 40Ar/39Ar age is younger by c. 1 million years than the Hall (Reference Hall1992) age, which was too old either because of xenocrystic contamination or excess argon in the glass. The new date represents a maximum age for surface features in the Wright Valley. We suggest that stratigraphic work using the Hall (Reference Hall1992) age be re-evaluated using the new age.
Several papers using the Hall (Reference Hall1992) age have overestimated relative age constraints. For example, Schiller et al. (Reference Schiller, Dickinson, Ditchburn, Graham and Zondervan2009) used the tephra layer in profile H5, which stratigraphically is the oldest tephra, to make inferences about relative differences in local climate conditions before and after tephra deposition. This work relied on the previous Hart Ash age of 3.9 Ma (Hall Reference Hall1992) and underestimated the timing of changes in local climate conditions. Similarly, Morgan et al. (Reference Morgan, Putkonen, Balco and Stone2010) used the Hart Ash as a datum to study past erosion rates and found a significant component of inherited in situ 10Be in the debris underlying the tephra. This indicated lower than expected erosion rates prior to tephra deposition because of the 3.9 Ma age used to correct for decay. However, if this tephra was significantly younger than the Hart Ash age by c. 1 Ma, no such difference could be observed. Future studies need to use our new precise age for the Hart Ash when modelling palaeoenvironmental conditions in the Dry Valleys.
In a comprehensive review of the Late Neogene climate and glacial history for southern Victoria Land, Levy et al. (Reference Levy, Cody, Crampton, Fielding, Golledge and Harwood2012) found that prior to 3.4 Ma conditions were 4°C warmer than preindustrial levels. Between 3.4 and 1.5 Ma, they found that conditions became cold and dry, similar to the present polar environment in the area. However, the Hart Ash rests on soil developed under warm, wet conditions prior to 3 Ma. Our new age estimate suggests that the transition from mud-rich to sandy dimicts must postdate 3 Ma, when fully cold and dry conditions developed. This confirms the Levy et al. (Reference Levy, Cody, Crampton, Fielding, Golledge and Harwood2012) finding, but it makes the transition from a subpolar to a polar climate younger than 3 Ma.
Conclusion
Numerous researchers have used the Hart Ash and its previously reported age as a time marker for the Neogene climate history of Wright Valley. Our detailed study shows that this age is incorrect and that there are two distinct tephra at the main Hart Ash site. Both tephra have phonolitic compositions, which are broadly consistent with a source from the Mount Discovery volcanic centre. These tephra may be close in age, but the previously reported age cannot be correlated to either tephra. The complex stratigraphy of tephra and sediments found in our soil profiles suggests rapid burial and slumping of water-saturated soils. However, we found that the stratigraphically oldest tephra has a maximum age of 2.97 ± 0.02 Ma. Although the thickness of this tephra and its distance from a source suggest a degree of reworking, it has little contamination and, for stratigraphic purposes, probably should be considered in situ.
Our case study of the Hart Ash shows that tephra in the MDV cannot be considered as reliable stratigraphic markers without detailed characterization, and that they may eventually need to be re-evaluated. Tephra deposits ranging in thickness from millimetres to metres and in age from 1–20 Ma have been found throughout the MDV. Although most of these are thought to originate mainly from Mount Morning and Mount Discovery, much of the detailed geochemistry and sedimentology of the deposits, which could add information to the eruptive history of the EVP, are lacking. We hope our work will stimulate more detailed geochemical work on tephra in the MDV. If enough of the visible tephra are well characterized, it may be possible to use cryptotephra on many of the surficial deposits to better understand the palaeoclimate of Antarctica.
Acknowledgements
We thank Gretchen Williams for help in the field and Ron Sletten for use of analytical facilities at the University of Washington. Antarctica New Zealand provided logistical support for the fieldwork. Phil Kyle was instrumental in getting the samples dated at the New Mexico Bureau of Geology and Mineral Resources. He also provided three excellent reviews of the manuscript. Thanks also to Richard Levy for a constructive review.
Author contributions
M. Schiller carried out most of the analyses and wrote the original manuscript. W.W. Dickinson oversaw the project and pulled together the final draft manuscript. N.A. Iverson dated the samples at the New Mexico Institute of Mining and Technology and J.A. Baker provided the analytical expertise at Victoria University.
Supplemental material
One supplemental table and five figures will be found at found at http://dx.doi.org/10.1017/S0954102019000129.
Details of data deposit
Supplementary data include tables and plots of elemental concentrations from microprobe analyses. Detailed methods and results of the 40Ar/39Ar dating are discussed and multi-crystal laser fusion ideograms are provided. An Excel spreadsheet is available so that analytical data can be extracted and used by interested researchers. Detailed descriptions of the profiles are also included.