Implications
This study suggests that selection for traditional finisher traits will likely not have a significant impact on sow lactation feed intake, contradicting limited earlier work. However, selection for increased lactation feed intake is possible, as it is heritable and variable, although it is a sex-limited trait that also incurs additional recording costs. Unfortunately, feed intake during lactation is also genetically and phenotypically associated with increased body size in the developing gilt and primiparous sow, suggesting that it will also be genetically correlated with mature size, an attribute that is generally considered undesirable to increase.
Introduction
The genotype of modern commercial sows is the product of breeding programmes in dam lines that have historically focused predominantly on growth, percent lean, efficiency and reproductive traits (Hermesch, Reference Hermesch2006). Relatively recently, selection criteria have been expanded to accommodate additional aspects of reproductive output, such as sow re-breeding performance or longevity and piglet mortality, to combat observed detrimental trends in these fitness traits, which have gradually become apparent in many production systems. Sow longevity in particular is lowly heritable and its expression is sex-limited and late in life, making it difficult to obtain response to selection. A better understanding of the suite of sow development traits may facilitate further development of selection strategies to address sow longevity issues (Tholen et al., Reference Tholen, Bunter, Hermesch and Graser1996a; Serenius and Stalder, Reference Serenius and Stalder2006) and potentially other fitness-related traits such as piglet mortality.
A key unresolved issue is to what extent selection for finisher traits has contributed to correlated outcomes for the sow herd, and by what mechanisms. A current hypothesis is that modern sows have higher nutrient requirements than their predecessors, approximately proportional to the improvement in production traits, and when these requirements are not met lifetime sow performance will be adversely affected (Eissen et al., Reference Eissen, Kanis and Kemp2000; Lawlor and Lynch, Reference Lawlor and Lynch2005; Bergsma et al., Reference Bergsma, Kanis, Verstegen and Knol2008). Previous research has shown that improved feed efficiency in finishers is correlated with lower finisher feed intake under ad libitum feeding (Gilbert et al., Reference Gilbert, Bidanel, Gruand, Caritez, Billon, Guillouet, Lagant, Noblet and Sellier2007; Hoque and Suzuki, Reference Hoque and Suzuki2008; Kanis, Reference Kanis1990), although this correlation tends to be less unfavourable when finishers are performance tested under a restricted feeding regime (Hermesch et al., Reference Hermesch, Luxford and Graser1999). If lower lactation feed intake occurs as a correlated response to selection for finisher traits, this could potentially increase nutritional deficiency during lactation, contributing to increased sow losses through the pathway of low feed intake (Knauer et al., Reference Knauer, Stalder, Serenius, Baas, Berger, Goodwin and Mabry2007, Bergsma et al., Reference Bergsma, Kanis, Verstegen and Knol2008). A genetic predisposition to inappetence might also alter a sow's ability to recover body condition stores during gestation, or reduce their ability to maintain intake under adverse environmental conditions, but there appears to be no published results for gestational feed intake data or sensitivity of intake to environmental stressors in sows.
Sow lactation intake is a heritable trait (Van Erp et al., Reference Van Erp, Molendijk, Eissen and Merks1998; Hermesch, Reference Hermesch2007; Bergsma et al., Reference Bergsma, Kanis, Verstegen and Knol2008; Bunter et al., Reference Bunter, Smits, Luxford and Hermesch2008). However, there are few estimates of the genetic correlation between feed intake in finishers and during lactation. The very high estimate of 0.92 ± 0.50 between these feed intake traits reported by Van Erp et al. (Reference Van Erp, Molendijk, Eissen and Merks1998) was very inaccurate, given the standard error, and was estimated using data for terminal line animals via indirect pedigree links. More recently, Bunter et al. (Reference Bunter, Tull and Luxford2007b) reported that finisher intake of an individual recorded as a gilt was a poor phenotypic predictor of their feed intake as a sow during lactation, implying relatively low genetic and/or residual correlations between the two traits. A preliminary estimate of the genetic correlation in an incomplete subset of data used in this study was unexpectedly −0.26 ± 0.33 (Bunter et al., Reference Bunter, Luxford and Hermesch2007a) and clearly <1. There are no known published estimates of the genetic correlation between feed intake of the growing gilt and its subsequent longevity as a sow, as growing gilts are rarely recorded for feed intake.
Regardless of whether there has been an undesirable correlated response in lactation feed intake due to selection, for which convincing evidence is lacking, the detrimental implications of low lactation feed intake on sow longevity or piglet performance at the phenotypic level are well known (Koketsu et al., Reference Koketsu, Dial, Pettigrew and King1996; Eissen et al., Reference Eissen, Kanis and Kemp2000; Anil et al., Reference Anil, Anil, Deen, Baidoo and Walker2006; Hermesch, Reference Hermesch2007). Consequently, it has been suggested that lactation feed intake should be included as a selection criteria in modern breeding programmes (Eissen et al., Reference Eissen, Apeldoorn, Kanis, Verstegen and de Greef2003). In the study of Bergsma et al. (Reference Bergsma, Kanis, Verstegen and Knol2008), correlations indicated that sows with high genetic merit for lactation feed intake exhibited lower weight, fat and protein losses during lactation. The expectation was that reduced weight and fat losses would lead to a greater propensity to re-breed, and this was indeed observed phenotypically under ad libitum feeding during lactation. However, the accompanying estimates of genetic correlations between lactation feed intake and sow re-breeding performance were very unfavourable (rg = −0.60). A similar result was obtained by Bunter et al. (Reference Bunter, Lewis and Luxford2009) but only when parameters were estimated from the subset of data from ‘healthy’ sows, which have increased expression of appetite during lactation. Hermesch et al. (Reference Hermesch, Jones and Bunter2008) estimated the more expected favourable genetic and phenotypic correlations between lactation intake and sow longevity using data from a different population with lower average intake levels.
With regard to maternal (reproductive) and terminal (compositional) changes within the modern genotype of sow and the limited concurrent changes in sow housing and management, it is perhaps surprising that little is known genetically about the time between selection of gilts and their breeding, and the correlations with other traits associated with longevity. It is the aim of this study to examine the genetic and phenotypic associations between finisher performance and the attributes of the gilt pre-mating, focussing on growth, fatness and feed intake traits, with the ultimate aim of better understanding how these traits were associated with lactation feed intake and survival to the second parity.
Material and methods
Project data – animals
Data from two pure-bred nucleus maternal lines (Primegro Genetics™) known to differ in both average body composition as finishers and reproductive performance as sows were recorded for post-selection characteristics and their primiparous gestation and farrowing outcomes. The two lines were of Large White and Landrace origin and housed in the same module within the same site. The litters obtained from these animals were largely pure bred derived using artificial insemination supplied from a single boar stud. Within the project data, there were 3604 individual gilts at selection generated from 216 sires. Additional performance data from unselected cohorts, and historical performance and reproductive records (all animals born after 2003 within these lines) were also available for analyses. The full pedigree contained 60 870 animals generated from 705 sires overall. Only performance data from gilts were used in this study.
Project data – traits
Dam line females are not routinely recorded for feed intake traits. Therefore, commencing from mid-2006 to February 2008, all gilts were performance tested until 20 weeks of age when selection was performed, all selected females commenced feed intake testing and all females subsequently reaching 29 weeks of age were recorded for weight and fatness. Project females that successfully farrowed in parity 1 were then recorded for lactation feed intake.
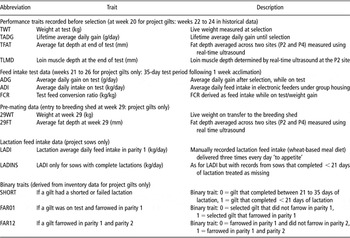
The data used in this study are outlined in Table 1. Performance test traits, upon which selection is partially based, included lifetime average daily gain (TADG, g/day) along with fatness (TFAT, mm) and loin muscle depth (TLMD, mm). Additional performance traits recorded on the selected gilts only included average daily feed intake (ADI, kg/day), average daily gain (ADG, g/day) while on feed intake test and the resultant feed conversion ratio (FCR, kg/kg), calculated as ADI/ADG. Historically, age at the end of testing has decreased from 24 weeks to 22 weeks as selection has generated improved trends in growth rate. In this study, gilts were performance tested only until 20 weeks to ensure that they could be adequately accommodated in group-housed electronic feeders, allowing maximum expression of appetite. Selected gilts were then recorded for feed intake and growth rate under ad libitum feed delivery over a 5-week period (from 21 to 26 weeks) following an acclimation period of 1 week. Pre-mating weight (29WT, kg) and fatness (29FAT, mm) were recorded before entry into the breeding facility at ∼29 weeks of age.
Trait abbreviations and definitions

P2 = approximately 6.5 cm from the dorsal midline, at the level of the posterior edge of the head of the last rib; P4 = 10 cm below tail based on the outside centre of the ham.
Fat depths (TFAT, 29FAT) were an average of subcutaneous measurements taken at two sites: the P2 site, which is ∼6.5 cm from the dorsal midline, at the level of the posterior edge of the head of the last rib (Greer et al., Reference Greer, Mort, Lowe and Giles1987); and the P4 site, which is ∼10 cm below the tail base, positioned on the centreline of the ham (M. Tull, personal communication). The P4 site is important for assessing overfatness in carcase grading; however, based on observations across species, this deposition site might also be indicative of physiological and reproductive maturity (Schneider, Reference Schneider2004).
Lactation feed intake was subsequently recorded for project sows that farrowed. The targeted lactation length was 30 (±2.5) days with twice weekly weaning. Therefore, feed intake was recorded daily throughout the entire lactation period for each sow, but only records up to day 35 lactation were used to calculate the average daily lactation feed intake (LADI), as sows lactating longer than this were generally rearing a new litter of piglets and had an altered feeding schedule. Feed delivery during lactation was ‘to demand’ for individual sows to maximise expression for feed intake during lactation, within operational constraints of a three times daily feed delivery. A second trait definition for LADI (LADINS) excluded LADI records for sows that were dried off or weaned early, generally for sow or piglet health reasons. However, some sows simply had incomplete records also.
Complete inventories were available for project females. Therefore, age at test and mating(s), gilt gestational treatment, lactation length and whether the gilt was medicated during gestation or the suckling period were known. Using the inventory of known dates, two binary survival traits were derived, These traits included the event of a shortened lactation (i.e. a lactation that lasted < 21 v. ≥ 21 days), which was represented by a binary trait (SHORT). In addition, survival from selection (i.e. at 20 weeks of age) until first farrowing (FAR01) and survival from the first to second farrowing (FAR12), where in each case a successful farrowing event takes a value of one. The FAR12 trait was defined differently to our previous work (Bunter et al., Reference Bunter, Lewis and Luxford2009; Lewis and Bunter, Reference Lewis and Bunter2009) as it included the information on the gilts that were transferred between modules, for which a successful farrowing was subsequently confirmed.
Data preparation and analysis
Data preparation and preliminary investigations were performed using SAS (SAS, 1999) software. Animals without pedigree were removed, and errors corrected where possible. For continuous variables, trait distributions were examined using the UNIVARIATE procedure to identify and remove outliers. Generally, records outside 1.5 × the interquartile range from the mean were considered outliers. However, production trends and changes to test systems over time were accommodated by considering trait distributions within time periods. Knowledge of management practices was also used to establish outliers.
Significant fixed effects (P < 0.05) were identified separately for each trait. Seasonal effects, described as year/month of test (TYM; 21 and 177 levels for project and all females, respectively) or farrowing year/month (FYM; 21 and 61 levels) and line of sow (L; two levels) were included in models for all traits. Treatments specifically applied during gestation (GTMT; four levels) included two dietary treatments (A and B) applied only to gilts that conceived at first mating; the remaining re-mated gilts were allocated to another class (C), and there was also a null treatment (H) for historical data. Treatment was considered significant only if treatment A significantly differed from treatment B, as treatment C could alternatively be accommodated through fitting an age covariate.
On the basis of results from previous analyses (Bergsma et al., Reference Bergsma, Kanis, Verstegen and Knol2008; Bunter et al., Reference Bunter, Smits, Luxford and Hermesch2008; Lewis and Bunter, Reference Lewis and Bunter2009), eight alternative models were investigated for LADI. In addition to FYM and L (model 1), expanded models fitted the number of piglets at day 1 (ND1) after fostering (model 2) and lactation length (LACL; model 3) as linear covariates. As an alternative to ND1, the number of piglets remaining at day 10 (ND10) was also considered with and without ND1 as a linear covariate for LADI (models 4 and 5). However, not all sows had ND10 accurately recorded. Covariates were centred to accommodate unknown values for some sows. In addition, sow medication events (SM; two levels = yes/no, model 6), failed or shortened (<21 days) lactation length (ST; two levels = yes/no, model 7) or both SM and ST (model 8) were then added as additional class effects for LADI, with solutions for LACL re-estimated within classes of ST for models 7 and 8.
Systematic and random effect models were developed and parameter estimates obtained using ASReml (Gilmour et al., Reference Gilmour, Cullis, Welham and Thompson2005), which estimates variance components under a linear mixed model by residual maximum likelihood. Univariate analyses were used to confirm preliminary models and obtain solutions for systematic effects, and to obtain initial estimates of genetic parameters under an animal (continuous traits) or sire (binary traits) model. Common litter effects were investigated for all traits and included in the final model if significant based on the log likelihood ratio test. The logit link function was used to obtain parameter estimates on the underlying scale for binary traits (SHORT, FAR01 and FAR12). Genetic and phenotypic correlations between traits were estimated using a series of bivariate analyses within ASReml using the trait-specific models from univariate analyses (model 3 for LADI). A sire model was used for bivariate analyses involving at least one binary trait, using the logit link function for the binary trait only.
Results
Characteristics of the data
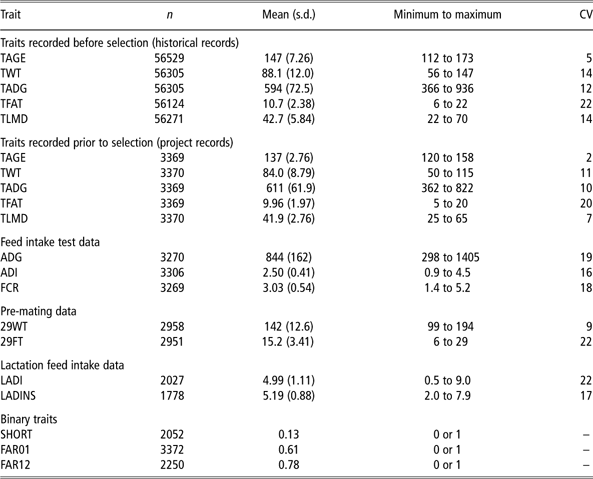
The average age of gilts at the end of the finisher performance test was 137 days for project animals and 147 days when the additional historical records were included (Table 2). At this age, the project gilts weighed 84 kg and had fat depths of 9.16 mm and 10.8 mm at the two measurement sites (P2 and P4). The average weight and fatness was 88 kg and 10.7 mm, including cohorts and historical data. Preceding selection, the growth rate of gilts was 611 g/day (project animals) or 595 g/day including historical data, illustrating that project gilts were leaner and faster growing than their contemporaries and historical counterparts. Rapid rates of growth (844 g/day) under ad libitum feeding during the subsequent post-finishing feed intake test period (26 weeks) were followed by slowed growth (824 g/day) in the pre-mating (26 to 29 weeks) period following altered management. Within this post-selection holding period, gilts were not reboxed, but were fed a different diet and kept in smaller groups. The coefficient of variation (CV) for rate of growth increased from 12% for TADG to 18% for ADG recorded between weeks 21 and 26, to 31% between weeks 26 and 29 (data not shown). The average weight and fatness of gilts at 29 weeks was 142 kg and 15.2 mm, respectively (Table 1), whereas averages at day 110 of gestation were 224 kg and 19.3 mm, respectively (data not shown).
Raw data (after editing) characteristics for recorded sows
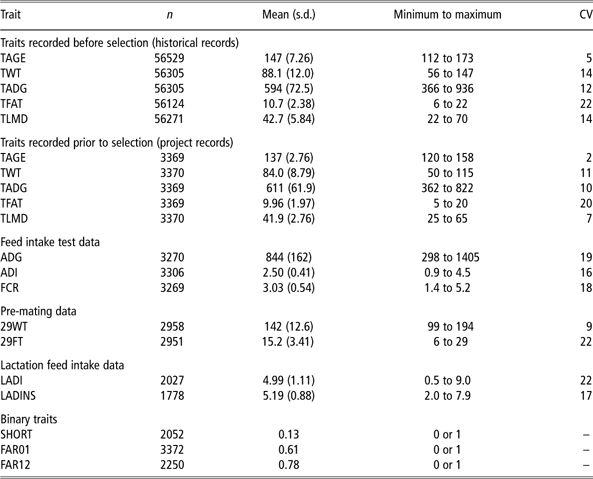
TAGE = test age in days.
See Table 1 for other detailed trait definitions.
The percentage of selected project gilts that farrowed in parity 1 was 61%. The relatively large reduction in numbers between selection and farrowing was partly because a higher percentage than normal of gilts were selected initially to ensure adequate number of gilts were sound at 29 weeks after the period of rapid growth allowed in the electronic feeders. In all, 32% of gilts were removed before mating and 68% were mated at least once.
Gilts approximately doubled ad libitum feed intake from 2.5 kg/day (maximum 4.5 kg/day) after finishing to ∼5 kg/day (maximum = 9.0 kg/day) during lactation. In the same data, gilts with no recorded medication events (putatively indicating good health) had a higher average, and lower variability of, lactation feed intake than medicated gilts (see Bunter et al., Reference Bunter, Lewis and Luxford2009). Variability of LADI (CV = 22%) was larger than variability of ADI (CV = 16%); although when records for the sows that had shortened lactations were removed (LADINS), this variability was at similar level (CV = 17%). The percentage of primiparous sows that had shortened or failed lactations (SHORT) was 13%. Of these, many were culled without the opportunity to re-breed. Approximately 78% of sows that farrowed in parity 1 also farrowed in parity 2.
Systematic effects
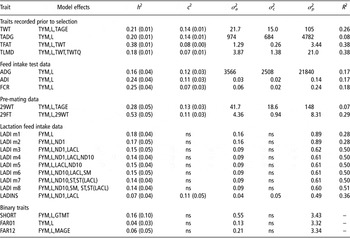
Season and month alone accounted for 2% (29WT) to 12% (TWT) of the observed variation in the production traits (data not shown) compared with 28% of the variation in LADI (model 1; Table 3). After season, line differences accounted for only 1% (FCR) to 2% (29WT) of the variation in the data across all traits, including LADI. On the basis of least squares means from the full model (Table 3), L2 sows were heavier and fatter than L1 sows at both 20 and 29 weeks of age (88.7 v. 86.8 kg and 143.3 v. 140.8 kg; 10.8 v. 10.5 mm and 15.4 v. 15.0 mm). In contrast to expectations based on weight and fatness, L1 sows ate significantly more during the post-finishing period (2.55 v. 2.45 kg/day). L differences were also noted for other production traits in this study but this is not discussed further. Age at recording was a significant linear covariate for TWT and 29WT, whereas weight at recording was fitted as a linear covariate for TFAT, TLMD (+quadratic term) and 29FT. Regression coefficients for TWT and 29WT on age at testing were 0.79 and 0.62 kg/day, consistent with the reduction in growth rate after 26 weeks. Regression coefficients for fatness on weight declined from 0.10 mm/kg live weight to 0.09 mm/kg at 20 and 29 weeks, showing a reduced rate of fat deposition in the period immediately before mating.
Estimates of heritability (h 2) and common litter (c 2) effects with accompanying additive genetic (σ 2a), common litter (σ 2c) and phenotypic (σ 2p) variances, from univariate analysesFootnote *

‘mn’ refers to alternative (n) models used for LADI.
Factor1(factor2) refers to factor 2 being nested within factor 1.
TYM = on test seasonal effect year/month; L = line; TAGE = age in days at test; TWTQ = quadratic form of TWT; FYM = seasonal effect of year/month; ND1 = number of piglets alive at day one of lactation; LACTL = lactation length in days; ND10 = number of piglets alive at day ten of lactation; SM = If sows were medicated during parturition or lactation; ST = SHORT; GTMT = gilt feed treatment; MAGE = mating age in days.
* The proportion of variation explained by the fixed effects in the model (R 2) is also shown.
See Table 1 for detailed definition of main traits.
In contrast to results for ADI, there was no significant difference between the L1 and L2 (P = 0.24) for lactation intake (LADI; model 3), whereas line differences were significant (L2: 5.22 kg/day v. L1: 5.14 kg/day, P = 0.03) for LADINS. For every additional piglet that was present on day 1 after cross-fostering (ND1), sows ate 0.03 kg/day extra (model 3). The regression coefficient for ND1 was 0.04 kg/day for LADINS. When the number of piglets at ND10 is fitted in place of ND1 (model 4), the regression coefficient was almost twice as large, at 0.07 kg/day per pig, increasing to 0.08 kg/day for LADINS (data not shown). However, for comparable models (e.g. models 5 v. 3), ND10 was only slightly more informative than ND1 for LADI.
After fitting season and line, lactation length was the largest contributor to variation in LADI, explaining 22% of the observed variation for LADI (models 3 v. 1; Table 3). However, lactation length explained only 1% of the variability for LADINS (data not shown). For every extra day the sow lactated, feed intake increased 0.08 kg/day for LADI, or 0.05 kg/day for LADINS. Medication events (SM), as a proxy for sow health, explained 4% and 2% of variation in LADI and LADINS. Gilts receiving medication ate less during lactation (−0.15 kg/day, model 6). However, there was no improvement in model R 2 from fitting SM if the number of piglets nursed and lactation length were already in the model (models 6 v. 5). Finally, expanding models to nest regression coefficients for lactation length within ST (models 7 and 8) and accommodate health status explained no further variation in LADI compared to model 3.
The gilt feeding treatment was part of another study and results are not reported in detail here. Briefly, dietary treatment (A v. B) significantly affected gilt weight before farrowing (data not shown) but did not significantly affect LADI. Gilts in treatment B more frequently had shortened lactations (P < 0.01), but this treatment effect did not carry over at a significant level to FAR12. Age at first mating was a significant covariate for FAR12 (solution = −0.0074).
Overall, model coefficients of determination (R 2) were much lower for ADI (17%) than the values of 28% to 52% for LADI. There was also a marked difference in the R 2 values for 29WT (7%) v. TWT (26%) and 29FT (29%) v. TFAT (38%) under comparable models. LADI under model 3 was comparable with LADINS, and the R 2 reduced from 50% to 36% was solely due to records from the SHORT litters being removed.
Estimates of heritability and common litter effects
All traits recorded before farrowing were moderately to highly heritable and had significant common litter effects. Relative to estimates for the same performance traits recorded at younger ages (TWT and TFAT), heritabilities for weight and fatness were marginally (WT29) to substantially (29FT) higher and accompanied by increases in phenotypic variation (Table 3). ADG (21 to 26 weeks) was less heritable than TADG, but genetic variation for ADG was higher.
Heritability estimates for lactation feed intake varied with the model for estimation and the trait definition (LADI v. LADINS) used, but did not significantly differ between models 1 to 8 because of a relatively large standard errors. Under the basic model (model 1), the heritability estimate for lactation feed intake was moderate (0.18 ± 0.04). A small reduction in heritability (model 3: 0.15 ± 0.05) accompanied a substantial reduction in phenotypic variation with models that accounted for lactation length. Model 3 was the most appropriate for further analyses because of its relative simplicity and the high R 2 value. In contrast to ADI, common litter effects were not significant for LADI, but were significant for LADINS.
Survival from selection to farrowing in parity 1 (FAR01) was not a heritable trait. In contrast, SHORT and FAR12 were heritable (0.16 ± 0.10 and 0.06 ± 0.05, respectively) but with large standard errors. Common litter effects were not fitted for the binary traits.
Correlations between traits
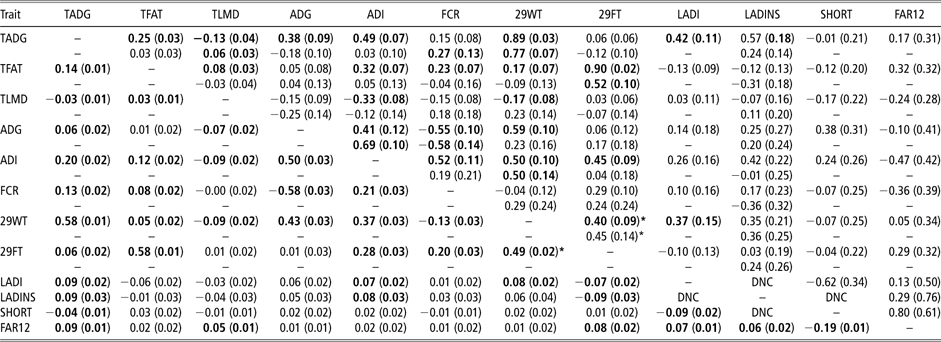
The genetic (rg) correlation between TWT and TADG was 1, and thus correlations between TWT and the other traits are redundant and are not presented in Table 4. The within-trait genetic correlations for weight and fat depths at finishing and at week 29 were positive and very high (0.89 ± 0.03 and 0.90 ± 0.02, respectively), whereas corresponding phenotypic (rp) correlations were ∼0.60. Genetic correlations between weight and fatness were higher at 29 weeks (rg = 0.40 ± 0.09) than in finishers (rg = 0.25 ± 0.03), accompanied by a comparable increase in phenotypic correlations (0.14 ± 0.01 at finishing v. 0.49 ± 0.02 at 29 weeks). Growth before selection (TADG) was moderately (0.38 ± 0.09) genetically correlated with growth in the electronic feeders (ADG), whereas the phenotypic correlation between these traits was much lower (0.06 ± 0.02). Although early growth (TADG) had a small positive genetic correlation with FCR (0.15 ± 0.08), a significant negative genetic correlation (−0.55 ± 0.10) was estimated between ADG and FCR.
Estimates of genetic (above diagonal), common litter (second row, above diagonal) and phenotypic (below diagonal) correlations between traits, from bivariate analyses
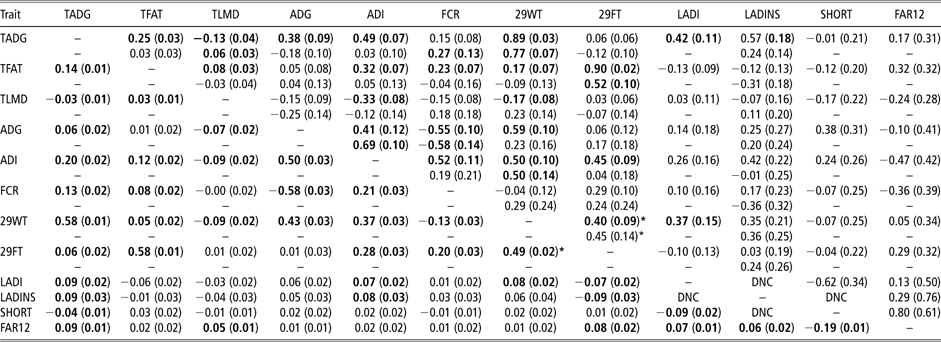
DNC = Did not converge.
Bold values signifies that the estimate is at least two times the error and thus significantly different from 0.
*WT29 was dropped for the bivariate analysis of WT29 with 29FT.
See Table 1 for detailed definition of main traits.
ADI measured in the electronic feeders had significant genetic correlations with TADG (0.49 ± 0.07) and TFAT (0.32 ± 0.07), along with ADG (0.41 ± 0.12) and FCR (0.52 ± 0.11). Genetic correlations remained high between ADI and 29WT or 29FT (0.50 ± 0.10 and 0.45 ± 0.09). Phenotypic correlations were in the same direction but of smaller magnitude. ADI was also positively correlated with lactation feed intake, more so when data for sows with complete lactations were considered (0.26 ± 0.16 and 0.42 ± 0.22 for LADI and LADINS, respectively). However, genetic correlations between ADI and LADI or LADINS were significantly lower than 1 and corresponding phenotypic correlations were positive but of low magnitude (∼0.08). TADG and 29WT were the only traits to have genetic correlations with lactation feed intake that were significantly larger than 0 (0.42 ± 0.11 and 0.37 ± 0.15 for TADG and 29WT with LADI; 0.57 ± 0.18 and 0.46 ± 0.21 with LADINS). In contrast, the genetic correlations between fatness at 29 weeks and lactation intake traits were low and negative but did not differ from 0, and phenotypic correlations were of similar magnitude and direction.
The heritability estimate of SHORT was dramatically decreased in the bivariate analysis with FAR12, and the standard error of the estimated genetic correlation is very large, making this estimate unreliable. Most estimates of genetic and phenotypic correlations between SHORT and other traits were low and did not exceed their standard error in magnitude. However, negative genetic and phenotypic correlations between SHORT and LADI indicate that lactation intake and the probability of a shortened lactation were inversely associated. Genetic correlations between FAR12 and other traits varied in magnitude and direction and were generally accompanied by large standard errors. Although no genetic correlations were significantly larger than 0, correlations between FAR12 and TFAT/ADI were of a large magnitude (0.32 ± 0.32 and −0.47 ± 0.42, respectively). Phenotypic correlations between FAR12 and TADG, TLMD, 29FT, LADI and LADINS were low and positive, differing significantly from 0. Phenotypic correlations were not fully consistent with the corresponding estimates of genetic correlations, with the exception of TADG, 29FT, LADI and LADINS. The negative phenotypic correlation between FAR12 and SHORT litters, expected from the strategy of culling primiparous sows with failed lactations, contrasted with the positive genetic correlation between these traits.
There were few significant correlations between traits for common litter effects (Table 4). The positive correlations found were similar to the genetic correlations identified. There was only one significant negative correlation identified between FCR and ADG (−0.58 ± 0.14), and this was also consistent with the estimate of the genetic correlation.
Discussion
With the exception of Bunter et al. (Reference Bunter, Smits, Luxford and Hermesch2008), which was a preliminary analysis of these data, no other studies have presented genetic parameters for post-selection and pre-breeding gilt traits in context with their production performance and feed intake as a finisher and their subsequent lactation feed intake as a sow. Considering that pre-farrowing body composition is thought to be an important factor for both sow longevity (Tholen et al., Reference Tholen, Bunter, Hermesch and Graser1996b) and piglet mortality (Grandinson et al., Reference Grandinson, Rydhmer, Strandberg and Solanes2005), and sow condition before mating can have a significant effect on condition before parturition (Guillemet et al., Reference Guillemet, Dourmad and Meunier-Salaun2006), it is important that these associations are explored.
On average, LADI of primiparous sows was almost double their intake as finisher gilts. As feed delivery immediately before farrowing was of similar volume to the earlier levels of ADI, a large and rapid change in intake occurs between non-lactating and lactating states. In these data, the ability of primiparous sows to achieve this adaptation in intake during lactation was influenced by seasonal effects and also pre- and post-farrowing health issues, along with farrowing outcomes (see Bunter et al. Reference Bunter, Tull and Luxford2007b). Variation in lactation length itself generally reflected the impact of environmental and physiological stressors (such as a difficult farrowing and health or locomotion issues) within the farrowing environment. Therefore, for sows successfully achieving the targeted lactation length (i.e. those sows with records for LADINS), these effects are less likely and the relative variability in lactation feed intake returns to levels seen pre-mating. Apart from diet and the impact of farrowing events, the other main difference between the farrowing and growing pig environment is the rapidly changing nutritional requirements that come with the progression of lactation. For example, ADI of growing pigs tends to increase linearly with weight over time (McCracken, Reference McCracken1980), whereas lactation intake develops in a non-linear pattern over the lactation period (see Hermesch, Reference Hermesch2007; Lewis et al., Reference Lewis, Hermesch and Bunter2010 and this study; data not shown). This effect was indirectly illustrated by fitting ND10 as a covariate for LADINS, where ND10 provided additional information on the sow's feed intake resulting from demands later in lactation. Lactation intake increased with ND10, and a small increase in the heritability (0.07 to 0.10) of LADINS was observed when ND10 was fitted to the model.
After season, the primary source of variability in lactation feed intake was lactation length, followed by genetic variation among individual sows. Of note, the sow lines re-ranked between ADI and LADI, showing that ranking for finisher intake was not necessarily reflected by ranking for lactation intake. On the basis of results overall, it seems likely that some of the reported phenotypic associations between low lactation intake and sow longevity result from unrecorded health-related reductions in intake. The thresholds reported by some researchers (Koketsu and Dial, Reference Koketsu and Dial1997; Hermesch and Jones, Reference Hermesch and Jones2007) at which sow longevity is compromised, relative to ADI of normal finishing gilts in this study (2.5 kg/day) and unrestricted ADI of pregnant sows (between 5.4 and 8.29 kg/day, depending on diet; van Barneveld et al. Reference van Barneveld, Vandepeer and Brooke2007), are very low. Lactation feed intakes in particular were more strongly affected than ADI by seasonal effects. This implies that intake of lactating sows was more sensitive than intake of finishers to seasonal effects (such as elevated temperatures), suggesting that environmental control in the farrowing shed is of increased importance to maintain intake levels during lactation. This agrees with the findings of Becker and Misfeldt (Reference Becker and Misfeldt1995).
Nevertheless, lactation intake was generally a moderately heritable trait. Compared with Bergsma et al. (Reference Bergsma, Kanis, Verstegen and Knol2008), who reported estimates of 0.30 and 0.14 for total lactation intake recorded under ad libitum or restricted feeding of multiparous sows, estimates of heritability for lactation feed intake traits of primiparous sows in this study were similar to the heritability estimate under restricted feeding. The lower heritability in this study under ad libitum feed delivery might be because the data are only from parity 1 sows. Compared with multiparous sows, smaller sow size and an increased rate of complications affecting farrowing outcomes and lactation initiation are characteristic of primiparous sows, which affect lactation feed intake levels (Bunter et al., Reference Bunter, Lewis and Luxford2009), and which might also contribute to lower heritability for LADI of primiparous sows through limiting expression of their genetic potential. In support of this, common litter effects for LADINS were positively correlated with common litter effects for sow weight, suggesting that some of this effect arose through variation in sow size, and positive genetic correlations between sow size and lactation intake were ultimately estimated in this population (Bunter et al., Reference Bunter and Lewis2010). Finally, Hermesch (Reference Hermesch2007) also reported a lower heritability estimate for average lactation feed intake of primiparous (0.17 ± 0.09) compared with second parity (0.28 ± 0.11) sows from a separate Australian population, which also seems to confirm this possibility. Overall, parameter estimates for lactation intake were affected by the models and data (trait definition) used, particularly with respect to the phenotypic variance and genetic correlations between lactation intake and weight or ADI. However, standard errors of parameter estimates were relatively large, and thus it could not be demonstrated that the changes to the genetic correlations between LADI or LADINS and other traits were significant. Moreover, heritability estimates were similar despite changes in variance.
The significant heritability estimate for SHORT indicates that there is also genetic variation for lactation length in primiparous sows. Removing short lactation length data for LADI (= LADINS) was subsequently accompanied by a reduction in genetic variation and heritability for LADINS relative to LADI. This was also apparent even when a common litter effect was not fitted for LADINS. Lactation failure has also been observed to be heritable (0.7, when defined as disturbed milk production) by some researchers (Rydhmer, Reference Rydhmer2000; Rydhmer et al., Reference Rydhmer, Johansson, Eliasson-Selling and Persson2001). However, other researchers, usually with data dominated by multiparous sows, have indicated that lactation length was not heritable in their data (Bergsma and Hermesch, personal communication), and thus their parameter estimates are seemingly less affected if models include or exclude lactation length. This might be related to the differences between studies in parities represented in the data. For example, sows recorded for lactation intake in this study have a much lower incidence of shortened lactations in their second parity. Therefore, lactation length is defined by management strategies in later parities, rather than by forced reductions in lactation length. It could also be postulated that some of the additional genetic variation seen within LADI v. LADINS represents genetic variation in how the gilt can cope with new physiological and environmental stressors (McGlone et al., Reference McGlone, Stansbury, Tribble and Morrow1988; Mosnier et al., Reference Mosnier, Dourmad, Etienne, Le Floc'h, Pere, Ramaekers, Seve, Van Milgen and Meunier-Salaun2009). In combination, these results suggest that some caution is required in interpreting the information content of lactation feed intake data unless feed delivery practices, environmental conditions and individual sow health status are known.
Key to the proposal that selection for lean growth efficiency will reduce sow lactation intake, as a correlated response to reduced intake in finishers, is the genetic correlation between ADI and LADI. In these data, the genetic correlation between these traits was significantly <1 for both LADI and LADINS, with estimates of 0.26 ± 0.16 and 0.42 ± 0.22. In an additional analysis using a multivariate model including TFAT and TADG (to account for historical selection) along with ADI and LADI, the genetic correlation between ADI and LADI remained essentially unchanged (0.24 ± 0.15). This indicates that any prior selection for increased growth and reduced fat had no influence on the estimates of correlations between ADI and LADI. In addition, the genetic correlations between LADI or LADINS and post-finishing FCR or fatness were not strong. These results do not support a strong impact of selection for finisher traits in maternal line sows on the expression of lactation feed intake. However, the general tendency was for estimates of the genetic correlation between ADI and LADI to be highest when only data were used from sows that met their targeted lactation length. This suggests that in the absence of significant health events during lactation, the genes (or gene expression levels) controlling regulation of appetite are more similar between the different physiological states.
The genetic correlations between lactation feed intake and performance traits were generally not strong, with the exception being the relationship between lactation feed intake and weight traits. Genetic correlations indicated that increasing the physical size of the gilt, as implied generally by increased weight, is associated with increased feed intake of both finishers and lactating sows. Heavier gilts at selection and mating had greater intake after selection, as would be expected, and also higher intake in their first lactation, but with downregulation during lactation at the phenotypic level for fatter sows. The latter phenomenon has been observed previously in pigs (Estienne et al., Reference Estienne, Harper, Barb and Azain2000) but appears largely environmental in origin, as genetic correlations between sow fatness and lactation feed intake were generally low (−0.13 ± 0.09 and −0.10 ± 0.13, Table 4). The study conducted by Bergsma et al. (Reference Bergsma, Kanis, Verstegen and Knol2008) had very similar results for fatness (genetic correlations = −0.08 and 0.03; phenotypic correlations = −0.13 and −0.15), although their results were more ambiguous for weight (genetic correlations = 0.18 and −0.43; phenotypic correlations = −0.04 and −0.11).
Altogether, these results suggest that lactation intake in the first parity (at least) is limited by sow size and capacity but has only weak genetic associations otherwise with body composition. Using a mouse model, Rauw et al. (Reference Rauw, Hermesch, Bunter and Gomez-Raya2009) demonstrated previously that between selection line differences existed in both mature size and lactation intake but, although growth and lactation intakes were positively associated, dam body size at maturity did not influence lactation intake within a line. In the current data, sows were not mature, and thus the potential development of a disassociation between mature size and lactation intake will need to be established using data from later parities. An increase in physical size following selection for higher lactation feed intake could contribute to counterproductive outcomes, with possibly increased overlays in the farrowing house (Wallenbeck and Rydhmer, Reference Wallenbeck and Rydhmer2008), less-efficient feed usage through increased sow herd maintenance requirements and overall increased welfare problems (Lopez-Serrano et al., Reference Lopez-Serrano, Reinsch, Looft and Kalm2000; McGlone et al., Reference McGlone, Vines, Rudine and DuBois2004). An association between large sow size and increased capacity for lactation intake might explain the unfavourable genetic correlation between lactation feed intake and sow re-breeding (used as a proxy for longevity) that was reported by Bergsma et al. (Reference Bergsma, Kanis, Verstegen and Knol2008). In this study, a small but favourable correlation between lactation intake and survival to the next parity was observed.
Estimates of heritabilities and correlations between performance test and feed intake traits in growing pigs were as expected and consistent with other studies (Rothschild and Bidanel, Reference Rothschild and Bidanel1998; Hermesch, Reference Hermesch2004; Hermesch et al., Reference Hermesch, Jones and Bunter2008), and thus are not discussed in detail here. Of note, genetic correlations between ADI and sow weight or fatness before mating were moderate (∼0.50 ± 0.10), indicating that finisher intake is strongly correlated with both finisher growth and the development of the gilt before mating. However, high genetic correlations for weight or fatness between weeks (20, 26 and 29) within trait, which were expected, were often accompanied by much lower phenotypic correlations, indicating that there is a lot of re-ranking among individuals for phenotype occurring in the relatively short period of time between selection and mating. As the measurement error is expected to be relatively similar for these records, this potentially suggests that changes to group size, housing and feed, and probably the attainment of puberty, differentially disrupts weight gain of individual gilts before mating. The general pattern of increasing weight and fatness masked the enormous variability among gilts in their development after selection. For example, in these data, the 10 percentile extremes for weight and fat gain after selection and before mating were 45.5 v. 70 kg and 2 v. 9 mm, respectively, and at the bottom end included gilts with minimal weight gain (4.5 kg) and an undesirable fat loss (−4 mm). Thus, a similar pre-mating phenotype may be arrived at in very different ways, and presumably this has implications for future gilt performance. This potentially explains the relatively poor predictive capacity of absolute finisher and post-finisher performance traits for sow longevity (Tholen et al., Reference Tholen, Bunter, Hermesch and Graser1996b; Serenius and Stalder, Reference Serenius and Stalder2004) or indeed lactation feed intake (Bunter et al., Reference Bunter, Tull and Luxford2007b) at the phenotypic level, as there are substantial changes to individual sow phenotypes in the intervening period.
A review (Serenius and Stalder, Reference Serenius and Stalder2006) examining seven previous studies showed the average heritability for stayability to be 0.13 (estimated using survival analysis and linear models), slightly higher than results from this study (0.06 ± 0.05) well. In a later paper (Engblom et al., Reference Engblom, Lundeheim, Schneider, Dalin and Andersson2009), heritability estimates for longevity were 0.04 for Landrace and 0.03 for Large White gilts. In this study, genetic correlations indicated that the main traits associated with FAR12 were fatness and efficiency traits, described by TFAT, ADI, FCR and 29FT. The genetic potential for higher body condition accompanied by better efficiency was beneficial to survival, to the second parity at least. This could be due to greater body reserves being available for primiparous sows during their first lactation, along with a greater capacity for increased feed intake during lactation. In addition to the above, TLMD, LADI and LADINS were also associated with FAR12 phenotypically. Sows that were heavier, fatter, ate more as finishers and those which were less efficient before mating had better longevity to the second parity phenotypically. Of note, the genetic association between FCR and FAR12 was opposite in direction to the phenotypic association. These results were similar (genetically) in direction to Bunter et al. (Reference Bunter, Lewis and Luxford2009).
Coheritabilities (Yamada, Reference Yamada1968) between each trait and FAR12 were calculated to determine the traits most associated with survival to the second parity. The coheritability between trait i and FAR12 is defined as hirah FAR12, where h is the square root of the heritability and ra is the genetic correlation between trait i and FAR12. These coheritabilities were calculated to identify which traits were the most predictive of FAR12 genetically. Coheritabilities between TFAT, ADI, FCR or 29FT with FAR12 were the most informative, with a magnitude of ∼0.04, which is ∼65% of the magnitude of the heritability for FAR12. However, phenotypic correlations indicate that TADG (0.09), 29FT (0.08) and LADI (0.07) were the most important traits phenotypically associated with FAR12, the latter partly because it was associated with SHORT and therefore culling decisions. Therefore, there was some inconsistency about what is genetically v. phenotypically important for sow survival beyond the first parity, and this might partly arise because management is not optimum for all sows. However, as survival to parity 2 was a binary trait with low heritability, there is less reliability in the predictive value of coheritabilities than if FAR12 were continuous. Therefore, these interpretations should be treated with caution.
Acknowledgements
The authors thank the Pork CRC for funding this study (projects 2D-104-0506 and 2E-101-0506) and Dr Brian Luxford at Rivalea Australia (formally QAF Meat Industries) for supplying the data. Special thanks are extended to Matthew Tull and other staff at Rivalea for their diligent data collection.