Introduction
Myocarditis is an inflammatory disease of the myocardium characterised by inflammatory cell infiltration and myocardial injury. Myocarditis presents with a wide clinical spectrum, ranging from subclinical manifestations in children to severe outcomes such as acute heart failure and sudden cardiac death. Reference Hutchinson and Law1 The most common aetiological factors are viral infections, particularly enteroviruses, adenoviruses, and parvovirus B19. Although less frequent, bacterial, autoimmune, and drug-related causes have also been reported. Reference Rady and Zekri2,Reference Kim and Cho3 Myocardial inflammation triggers a cascade of cellular and electrophysiological alterations that may result in conduction disturbances, ventricular dysfunction, and potentially life-threatening arrhythmias. Common electrocardiography findings include sinus tachycardia, PR interval prolongation, QRS complex changes, ST–T wave abnormalities, and various arrhythmias. Reference Erdoğan, Akyol, Özkan, Sonsöz and Özateş4,Reference Jaromin, Markiewicz-Łoskot, Szydłowski and Kulawik5 However, these findings are generally nonspecific, limiting their diagnostic sensitivity and specificity.
Recent advances in electrocardiographic analysis have emphasised repolarisation parameters such as corrected QT and the T peak–to–end interval, which reflect ventricular repolarisation dispersion and are associated with arrhythmogenesis. The T-peak to T-end interval specifically represents the transmural dispersion of repolarisation, and its prolongation indicates increased heterogeneity, predisposing patients to ventricular arrhythmias. Reference Pompa, Beerman, Feingold and Arora6 Furthermore, the combined assessment of the T-peak to T-end interval and the T peak–to–end/corrected QT ratio may enhance diagnostic accuracy and risk stratification in myocarditis. In addition, the cardiac electrophysiological balance index is another electrocardiographic-derived parameter, calculated by dividing the corrected QT interval by the QRS duration. The index of cardiac electrophysiological balance is a novel, noninvasive marker that has been proposed to predict malignant ventricular arrhythmias. It is suggested to be equivalent to the cardiac wavelength (λ); therefore, both increased and decreased index of cardiac electrophysiological balance values are associated with proarrhythmic ventricular risk. Reference Tse, Gong and Meng7–Reference Popa, Șerban, Mărănducă, Șerban, Tamba and Tudorancea9
Despite the crucial role of electrocardiography in the evaluation of myocarditis, comprehensive data regarding interval-based electrocardiographic parameters in paediatric myocarditis, particularly those involving the T-peak to T-end interval and its relationship with arrhythmia risk, remain limited. This study aimed to assess the predictive value of the T-peak to T-end interval, T-peak to T-end/QT, T peak–to–end/corrected QT, corrected QT/QRS, and index of cardiac electrophysiological balance ratios derived from leads DII and V5 on electrocardiography for arrhythmia development and clinical outcomes in paediatric myocarditis.
Materials and methods
Study population
This single-centre, retrospective case–control study was conducted in the Paediatric Emergency Department of Adana City Training and Research Hospital between January 2024 and May 2025 in accordance with the Declaration of Helsinki and approved by the local Ethics Committee. The study population comprised 76 consecutive paediatric patients aged under 18 years who were diagnosed with acute myocarditis. For the control group, 75 healthy children who presented to the emergency department or outpatient clinics for mild, non-inflammatory conditions (e.g., minor trauma, routine checkups), had no history of cardiac or systemic disease, and had normal clinical, laboratory, and electrocardiographic findings were included in the study. Patients with congenital or acquired structural heart disease, primary arrhythmias, baseline conduction abnormalities (e.g., bundle branch block, pre-excitation), electrolyte imbalances, or a history of medications that prolong the QT interval or are antiarrhythmic were excluded from both groups.
Ethical approval
This study was conducted in accordance with the ethical standards of the Declaration of Helsinki and approved by the Adana City Training and Research Hospital Clinical Research Ethics Committee (Approval date: August 21, 2025; Meeting number: 16; Decision number: 644). Due to the retrospective design of the study, the requirement for written informed consent was waived by the ethics committee.
Data collection
Demographic and baseline clinical data, including age, sex, presenting complaints, history of preceding viral infections, and initial vital signs (body temperature, heart rate, blood pressure, and peripheral oxygen saturation), were retrieved from electronic hospital records. Laboratory parameters obtained at admission, including white blood cell count, haematocrit, platelet count, blood urea nitrogen, serum creatinine, creatine kinase, cardiac troponin, and lactate dehydrogenase, were recorded. Electrocardiographic tracings, echocardiographic parameters assessed by paediatric cardiologists, administered medical therapies (intravenous immunoglobulin, corticosteroids, non-steroidal anti-inflammatory drugs, colchicine, and inotropic agents), hospitalisation setting (paediatric ward vs. paediatric ICU), total length of hospital stay, and clinical outcomes (recovery and discharge vs. in-hospital mortality) were systematically documented.
Electrocardiographic analysis
All patients underwent electrocardiographic assessment using the MAC™ 2000 Electrocardiographic Analysis System. Standard 12-lead electrocardiographics were recorded at a paper speed of 25 mm/s and a calibration of 10 mm/mV.
Reference Sivri and Çelik10
The QT interval was defined as the time from the onset of the QRS complex (initial deflection of the Q wave) to the end of the T wave. The corrected QT interval was calculated using the Bazett formula (
 $QTc=QT/\sqrt{RR}$
).
Reference Agha, Fakhri and Ahmed11
PR interval, QRS duration, QT interval, and T-peak to T-end interval measurements were manually performed on leads DII and V5 by an independent cardiologist who was blinded to the clinical data. The T-peak to T-end interval was defined as the time from the peak to the end of the T wave and was used as an indicator of transmural dispersion of ventricular repolarisation.
Reference Brouwer, Van Den Berg, Grobbee, Haaksma and Wilde12
The index of cardiac electrophysiological balance (corrected QT/QRS), T-peak to T-end/QT, and T peak–to–end/corrected QT ratios were calculated separately for leads DII and V5.
Reference Robyns, Lu and Gallacher8
Subgroup classification
The diagnosis of acute myocarditis was established based on the 2021 American Heart Association/American College of Cardiology Pediatric Myocarditis Diagnostic Criteria. A definitive diagnosis required clinical suspicion (Criterion A: presenting symptoms such as chest pain, fatigue, respiratory distress, or shock) in combination with at least one laboratory marker of myocardial injury (Criterion B: elevated cardiac troponin or creatine kinase-myocardial band) and at least one imaging abnormality (Criterion C: echocardiographic evidence of ventricular dysfunction, wall motion abnormalities, or pericardial effusion; or cardiac MRI findings consistent with myocarditis). Reference Law, Lal and Chen13 Patients with myocarditis were stratified into subgroups based on the development of arrhythmias, occurrence of fulminant myocarditis, and requirement for intensive care admission.
Patients diagnosed with myocarditis were further categorised into fulminant and non-fulminant subgroups:
-
• Fulminant Myocarditis (FM): Defined according to the American Heart Association criteria as acute-onset myocardial inflammation resulting in rapid clinical deterioration, severe haemodynamic compromise, cardiogenic shock, life-threatening ventricular arrhythmias or advanced heart blocks, and the requirement for inotropic/vasopressor support, mechanical ventilation, or mechanical circulatory support. Reference Olejniczak, Schwartz, Webber, Shaffer and Perry14–Reference Cho, Habimana and Choi16
-
• Non-fulminant Myocarditis: Defined as acute myocarditis presenting with mild to moderate clinical symptoms and preserved or mildly reduced ventricular function without haemodynamic collapse or requirement for vasopressor support. Defined as acute myocardial inflammation presenting without cardiogenic shock, severe haemodynamic compromise, or the requirement for inotropic/vasopressor and mechanical circulatory support. Reference Law, Lal and Chen13
Statistical analysis
Statistical analyses were performed using IBM SPSS Statistics for Windows, Version 25.0 (IBM Corp., Armonk, NY, USA). Continuous variables were evaluated for normal distribution using Shapiro–Wilk tests. Continuous variables conforming to a normal distribution are expressed as mean ± standard deviation, whereas non-normally distributed continuous variables are presented as median with interquartile range (interquartile range, 25th–75th percentiles). Categorical variables are reported as frequencies and percentages (n, %).
Comparisons of continuous variables between two independent groups (e.g., myocarditis vs. control, arrhythmia vs. non-arrhythmia, and fulminant vs. non-fulminant subgroups) were conducted using the independent-samples Student’s t-test for normally distributed parameters or the Mann–Whitney U test for non-normally distributed parameters. Categorical data were compared using Pearson’s chi-square test or Fisher’s exact test, as appropriate.
Receiver operating characteristic curve analysis was utilised to assess the diagnostic performance of electrocardiographic repolarisation parameters (T-peak to T-end, T-peak to T-end/QT, T peak–to–end/corrected QT, corrected QT/QRS, and index of cardiac electrophysiological balance) in distinguishing patients with myocarditis from healthy controls. In addition, secondary receiver operating characteristic analyses were conducted within the myocarditis cohort to evaluate the predictive utility of these parameters for arrhythmia development and fulminant myocarditis presentation. The area under the receiver operating characteristic curve (area under the curve) with 95% confidence intervals, sensitivity, and specificity were calculated. Optimal cut-off thresholds were identified using the maximum Youden index (J = sensitivity + specificity − 1). Reference Youden17
As a planned secondary analysis, the relationships between electrocardiographic repolarisation markers and cardiac/inflammatory biomarkers (e.g., troponin, creatine kinase-myocardial band, leukocyte count, and platelet count) were assessed using the Spearman rank correlation test. A two-tailed p-value < 0.05 was considered statistically significant for all analyses.
Results
Demographic and baseline characteristics
A total of 151 paediatric patients were enrolled in the study, comprising 76 patients with acute myocarditis and 75 age- and sex-matched healthy controls. The myocarditis cohort included 23 females (30.3%) and 53 males (69.7% [p = 0.007]) with a mean age of 12.0 ± 4.7 years, whereas the control cohort consisted of 39 females (52.0%) and 36 males (48.0%) with a mean age of 10.3 ± 4.9 years. No statistically significant differences were found between the groups in terms of age and gender.
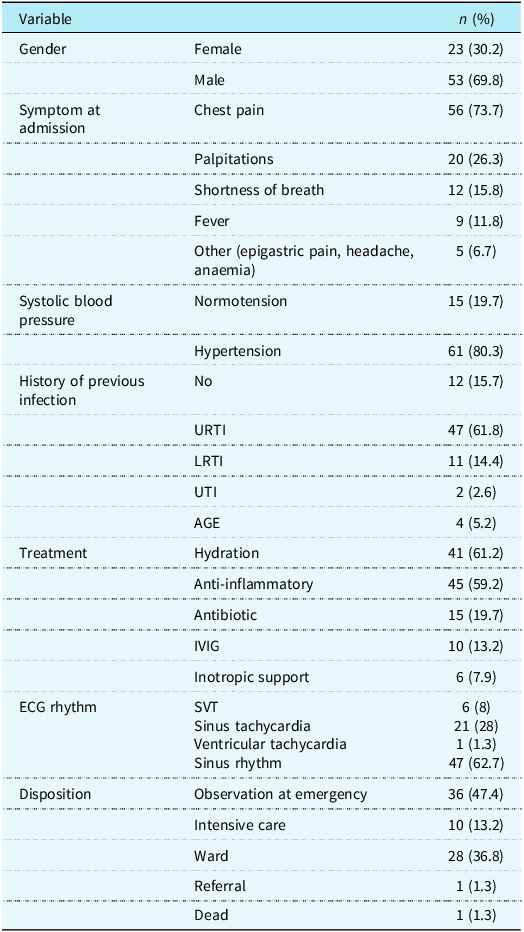
During in-hospital monitoring, arrhythmogenic events occurred in 28 patients (36.8%), while 48 patients (63.2%) remained in sinus rhythm without arrhythmic complications (Table 1). Paediatric ICU admission was required for 10 patients (13.2%), and overall in-hospital mortality was 1.3% (n = 1). Patients who developed arrhythmias had a significantly prolonged hospital stay compared to those without arrhythmias (7.06 ± 6.14 days vs. 3.17 ± 1.70 days, p = 0.013). Detailed baseline clinical and demographic parameters are shown in Table 1.
Demographic features and clinical findings of the patients

Table 1. Long description
The table presents demographic features and clinical findings of patients, organized into several categories and variables. It has 12 rows and 2 columns. The columns are labeled ‘Variable’ and ‘n (%)’. The rows are grouped under different headings such as Gender, Symptom at admission, Systolic blood pressure, History of previous infection, Treatment, ECG rhythm, and Disposition. Each row lists specific variables and their corresponding values in terms of number and percentage. For example, under Gender, Female is 23 (30.2%) and Male is 53 (69.8%). Under Symptom at admission, Chest pain is 56 (73.7%) and Palpitations is 20 (26.3%). The table provides a detailed breakdown of various clinical and demographic parameters observed in the patients.
n (%): number of patients (percentage). AGE = acute gastroenteritis; EKG = electrocardiography; IVIG = intravenous immunoglobulin; LRTI = lower respiratory tract infection; SVT = supraventricular tachycardia; URTI = upper respiratory tract infection; UTI = urinary tract infection.
Data are presented as n (%). Treatment categories were not mutually exclusive, as patients could receive more than one treatment.
Comparison of electrocardiographic parameters between myocarditis and control groups
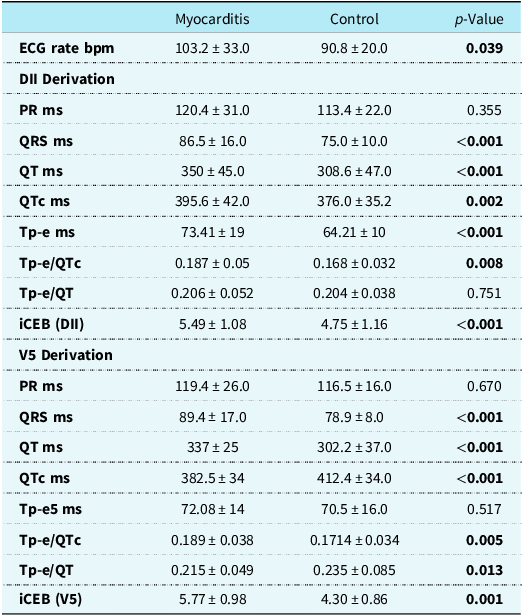
A comparison of electrocardiographic repolarisation and interval parameters between paediatric myocarditis and healthy control groups was given in Table 2. Heart rate was higher in the myocarditis group than in the control group (103.2 ± 33.0 bpm vs. 90.8 ± 20.0 bpm, p = 0.039).
Comparison of electrocardiographic repolarisation and interval parameters between paediatric myocarditis and healthy control groups

Table 2. Long description
A table comparing electrocardiographic repolarisation and interval parameters between paediatric myocarditis and healthy control groups. The table has 15 rows and 5 columns. Column headers are Myocarditis, Control, and p-Value. Row labels include ECG rate bpm, PR ms, QRS ms, QT ms, QTc ms, Tp-e ms, Tp-e/QTc, Tp-e/QT, and iCEB (DII and V5 Derivation). Row 1: ECG rate bpm, Myocarditis 103.2 33.0, Control 90.8 20.0, p-Value 0.039. Row 2: PR ms, Myocarditis 120.4 31.0, Control 113.4 22.0, p-Value 0.355. Row 3: QRS ms, Myocarditis 86.5 16.0, Control 75.0 10.0, p-Value <0.001. Row 4: QT ms, Myocarditis 350.0 45.0, Control 308.6 47.0, p-Value <0.001. Row 5: QTc ms, Myocarditis 395.6 42.0, Control 376.0 35.2, p-Value 0.002. Row 6: Tp-e ms, Myocarditis 73.41 19, Control 64.21 10, p-Value <0.001. Row 7: Tp-e/QTc, Myocarditis 0.187 0.005, Control 0.168 0.032, p-Value 0.008. Row 8: Tp-e/QT, Myocarditis 0.206 0.052, Control 0.204 0.038, p-Value 0.751. Row 9: iCEB (DII), Myocarditis 5.49 1.08, Control 4.75 1.16, p-Value <0.001. Row 10: PR ms (V5 Derivation), Myocarditis 119.4 26.0, Control 116.5 16.0, p-Value 0.670. Row 11: QRS ms (V5 Derivation), Myocarditis 89.4 17.0, Control 78.9 8.0, p-Value <0.001. Row 12: QT ms (V5 Derivation), Myocarditis 337 25, Control 302.2 37.0, p-Value <0.001. Row 13: QTc ms (V5 Derivation), Myocarditis 382.5 34, Control 412.4 34.0, p-Value <0.001. Row 14: Tp-e5 ms (V5 Derivation), Myocarditis 72.08 14, Control 70.5 16.0, p-Value 0.517. Row 15: Tp-e/QTc (V5 Derivation), Myocarditis 0.189 0.038, Control 0.1714 0.034, p-Value 0.005. Row 16: Tp-e/QT (V5 Derivation), Myocarditis 0.215 0.049, Control 0.235 0.085, p-Value 0.013. Row 17: iCEB (V5), Myocarditis 5.77 0.98, Control 4.30 0.86, p-Value 0.001.
Note: Continuous variables are presented as mean ± standard deviation (SD). Comparisons between independent groups were performed using the Student’s t-test for normally distributed variables. Bold values indicate statistical significance (p < 0.05).
bpm = beats per minute; DII = Lead II (Derivation II); ECG = electrocardiography; iCEB = index of cardiac electrophysiological balance (calculated as QT/QRS); ms = milliseconds; PR = PR interval; QRS = QRS duration; QT = QT interval; QTc = corrected QT interval calculated via Bazett’s formula; Tp-e = T peak-to-end interval.
In lead II, QRS duration (86.5 ± 16.0 ms vs. 75.0 ± 10.0 ms, p < 0.001), QT interval (350.0 ± 45.0 ms vs. 308.6 ± 47.0 ms, p < 0.001), corrected QT interval (395.6 ± 42.0 ms vs. 375.9 ± 35.0 ms, p = 0.002), T-peak to T-end interval (73.41 ± 19.0 ms vs. 64.21 ± 10.0 ms, p < 0.001), T-peak to T-end/corrected QT ratio (0.187 ± 0.050 vs. 0.168 ± 0.032, p = 0.008), and index of cardiac electrophysiological balance (5.49 ± 1.08 vs. 4.75 ± 1.16, p = 0.001) were higher in the myocarditis group (Table 2). PR interval and T-peak to T-end/QT ratio in lead II did not differ between the groups (p = 0.355 and p = 0.751, respectively).
In lead V5, QRS duration (89.36 ± 17.0 ms vs. 78.88 ± 8.0 ms, p < 0.001), QT interval (337.0 ± 25.0 ms vs. 302.2 ± 37.0 ms, p < 0.001), T-peak to T-end/corrected QT ratio (0.189 ± 0.041 vs. 0.171 ± 0.035, p = 0.005), and index of cardiac electrophysiological balance (5.77 ± 0.98 vs. 4.30 ± 0.86, p = 0.001) were higher in the myocarditis group (Table 2). The corrected QT interval was 382.5 ± 34.0 ms in the myocarditis group and 412.4 ± 34.0 ms in the control group (p < 0.001). The T-peak to T-end/QT ratio was 0.214 ± 0.048 in the myocarditis group and 0.234 ± 0.042 in controls (p = 0.013). PR interval and T-peak to T-end interval in lead V5 did not differ between the groups (p = 0.670 and p = 0.517, respectively).
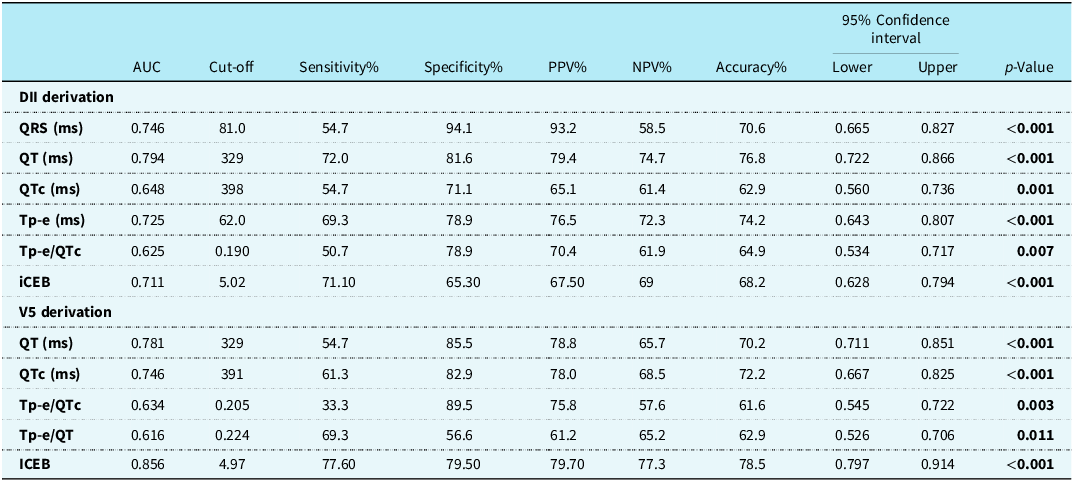
The receiver operating characteristic curve analysis results for discriminating patients with myocarditis from healthy controls are summarised in Table 3. Receiver operating characteristic curves of electrocardiography findings for predicting myocarditis are shown in Figure 1. In lead II, the QT interval had an area under the curve of 0.794 (95% confidence intervals: 0.722–0.866, p < 0.001), with a cut-off value of 329 ms resulting in 72.0% sensitivity and 81.6% specificity. QRSLead II (Derivation II) (cut-off: 81.0 ms) had an area under the curve of 0.746 (95% confidence intervals: 0.665–0.827, p < 0.001, sensitivity: 54.7%, specificity: 94.1%). Tp − eLead II (Derivation II) (cut-off: 62.0 ms) demonstrated an area under the curve of 0.725 (95% confidence intervals: 0.643–0.807, p < 0.001, sensitivity: 69.3%, specificity: 78.9%). iCEBLead II (Derivation II) (cut-off: 5.02) showed an area under the curve of 0.711 (95% confidence intervals: 0.628–0.794, p < 0.001, sensitivity: 71.1%, specificity: 65.3%). QTcLead II (Derivation II) (cut-off: 398 ms, area under the curve: 0.648, p = 0.001) and Tp − e/QTcLead II (Derivation II) (cut-off: 0.190, area under the curve: 0.625, p = 0.007) also showed diagnostic capability (Table 3).
Effectiveness of ECG findings in predicting myocarditis

Table 3. Long description
The table has two main sections: DII derivation and V5 derivation, each with multiple rows of data. Each section includes columns for AUC, Cut-off, Sensitivity percent, Specificity percent, PPV percent, NPV percent, Accuracy percent, 95 percent Confidence Interval (Lower and Upper), and p-Value. The DII derivation section includes rows for QRS (ms), QT (ms), QTc (ms), Tp-e (ms), Tp-e/QTc, and iCEB. The V5 derivation section includes rows for QT (ms), QTc (ms), Tp-e/QTc, Tp-e/QT, and iCEB. Each row provides specific values for the columns, indicating the diagnostic performance of each ECG parameter. Notable trends include varying levels of sensitivity, specificity, and accuracy across different parameters and derivations.
Note: ROC curve analysis was performed across the entire study population (n = 151; 76 myocarditis patients vs. 75 healthy controls). Optimal diagnostic cut-off thresholds were derived using the maximum Youden index (J = sensitivity + specificity − 1). Bold values indicate statistical significance (p < 0.05).
AUC = area under the curve; CI = confidence interval; DII = Lead II (Derivation II); iCEB = index of cardiac electrophysiological balance (calculated as QT/QRS); NPV = negative predictive value; PPV = positive predictive value; QRS = QRS duration; QT = QT interval; QTc = corrected QT interval; ROC = receiver operating characteristic; Tp-e = T peak-to-end interval.
ROC curves of ECG findings for predicting myocarditis. (a) ROC curves of electrophysiological balance and repolarisation ratios: iCEBV5, iCEBLead II (Derivation II), Tp-e/QTcLead II (Derivation II), and Tp-e/QTcV5. (b) ROC curves of absolute interval parameters: QTLead II (Derivation II), QTV5, Tp-eLead II (Derivation II), and Tp-e/QTV5. ECG, electrocardiography; iCEB, index of cardiac electrophysiological balance (QT/QRS or QTc/QRS); QRS, QRS complex duration; QT, QT interval; QTc, corrected QT interval; ROC, receiver operating characteristic; Tp-e, T peak-to-end interval.

In lead V5, iCEBV5 had an area under the curve of 0.856 (95% confidence intervals: 0.797–0.914, p < 0.001), with a cut-off value of 4.97 providing 77.6% sensitivity, 79.5% specificity, and 78.5% accuracy. QTV5 (cut-off: 329 ms) and QTcV5 (cut-off: 391 ms) demonstrated area under the curve values of 0.781 (95% confidence intervals: 0.711–0.851, p < 0.001) and 0.746 (95% confidence intervals: 0.667–0.825, p < 0.001), respectively. Tp − e/QTcV5 (cut-off: 0.205) yielded an area under the curve of 0.634 (95% confidence intervals: 0.545–0.722, p = 0.003), and Tp − e/QTV5 (cut-off: 0.224) had an area under the curve of 0.616 (95% confidence intervals: 0.526–0.706, p = 0.011).
Findings based on arrhythmia development
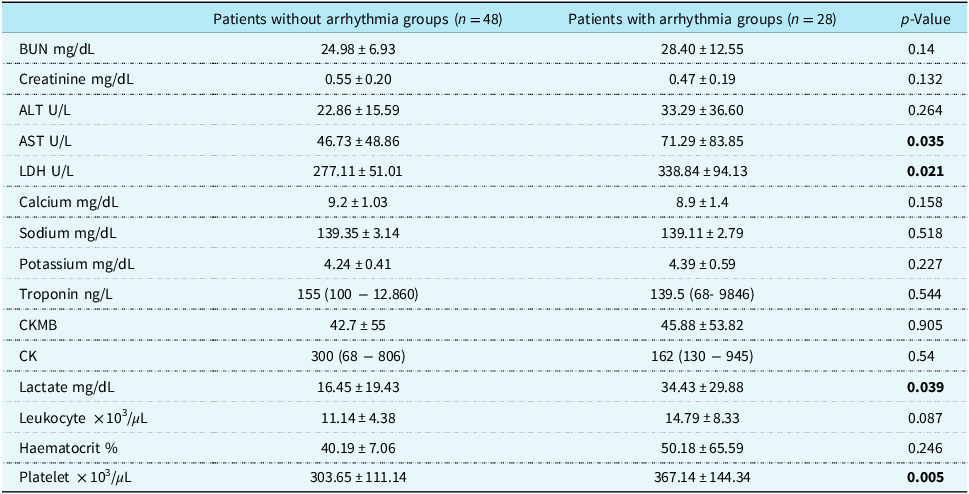
Baseline laboratory parameters of patients with and without arrhythmias are given in Table 4. Patients who developed arrhythmias had significantly higher levels of aspartate aminotransferase (71.29 ± 83.85 U/L vs. 46.73 ± 48.86 U/L, p = 0.035), lactate dehydrogenase (338.84 ± 94.13 U/L vs. 277.11 ± 51.01 U/L, p = 0.021), lactate (34.43 ± 29.88 mg/dL vs. 16.45 ± 19.43 mg/dL, p = 0.039), and platelet counts (367.14 ± 144.34 × 10³/μL vs. 303.65 ± 111.14 × 10³/μL, p = 0.005) compared with those who did not develop arrhythmias. Leukocyte counts showed a trend toward elevation in the arrhythmia group (14.79 ± 8.33 × 10³/μL vs. 11.14 ± 4.38 × 10³/μL, p = 0.087). Other laboratory markers, including cardiac troponin, creatine kinase-myocardial band, total creatine kinase, blood urea nitrogen, creatinine, and serum electrolytes, showed no statistically significant differences between the two groups (all p > 0.05).
Laboratory findings of the myocarditis cohort stratified by arrhythmia development

Table 4. Long description
The table compares baseline laboratory parameters of patients with and without arrhythmias. It has 16 rows and 4 columns. The columns are labeled as Patients without arrhythmia groups (n = 48), Patients with arrhythmia groups (n = 28), and p-Value. The rows are labeled with different laboratory parameters and their respective values. Row 1: BUN mg/dL, 24.98 ± 6.93, 28.40 ± 12.55, 0.14. Row 2: Creatinine mg/dL, 0.55 ± 0.20, 0.47 ± 0.19, 0.132. Row 3: ALT U/L, 22.86 ± 15.59, 33.29 ± 36.60, 0.264. Row 4: AST U/L, 46.73 ± 48.86, 71.29 ± 83.85, 0.035. Row 5: LDH U/L, 277.11 ± 51.01, 338.84 ± 94.13, 0.021. Row 6: Calcium mg/dL, 9.2 ± 1.03, 8.9 ± 1.4, 0.158. Row 7: Sodium mg/dL, 139.35 ± 3.14, 139.11 ± 2.79, 0.518. Row 8: Potassium mg/dL, 4.24 ± 0.41, 4.39 ± 0.59, 0.227. Row 9: Troponin ng/L, 155 (100 - 12.860), 139.5 (68 - 9846), 0.544. Row 10: CKMB, 42.7 ± 55, 45.88 ± 53.82, 0.905. Row 11: CK, 300 (68 - 806), 162 (130 - 945), 0.54. Row 12: Lactate mg/dL, 16.45 ± 19.43, 34.43 ± 29.88, 0.039. Row 13: Leukocyte x 10³/µL, 11.14 ± 4.38, 14.79 ± 8.33, 0.087. Row 14: Haematocrit percent, 40.19 ± 7.06, 50.18 ± 65.59, 0.246. Row 15: Platelet x 10³/µL, 303.65 ± 111.14, 367.14 ± 144.34, 0.005.
Note: Data are presented as mean ± standard deviation (SD) for normally distributed variables or median (interquartile range [IQR]) for non-normally distributed variables. Comparisons between independent groups were conducted using the Student’s t-test or the Mann–Whitney U test as appropriate. Bold values indicate statistical significance (p < 0.05).
ALT = alanine aminotransferase; AST = Aspartate aminotransferase, BUN = Blood urea nitrogen, CK = creatine kinase, CK-MB = creatine kinase-myocardial band, LDH = lactate dehydrogenase.
Electrocardiographic differences in the arrhythmia subgroup
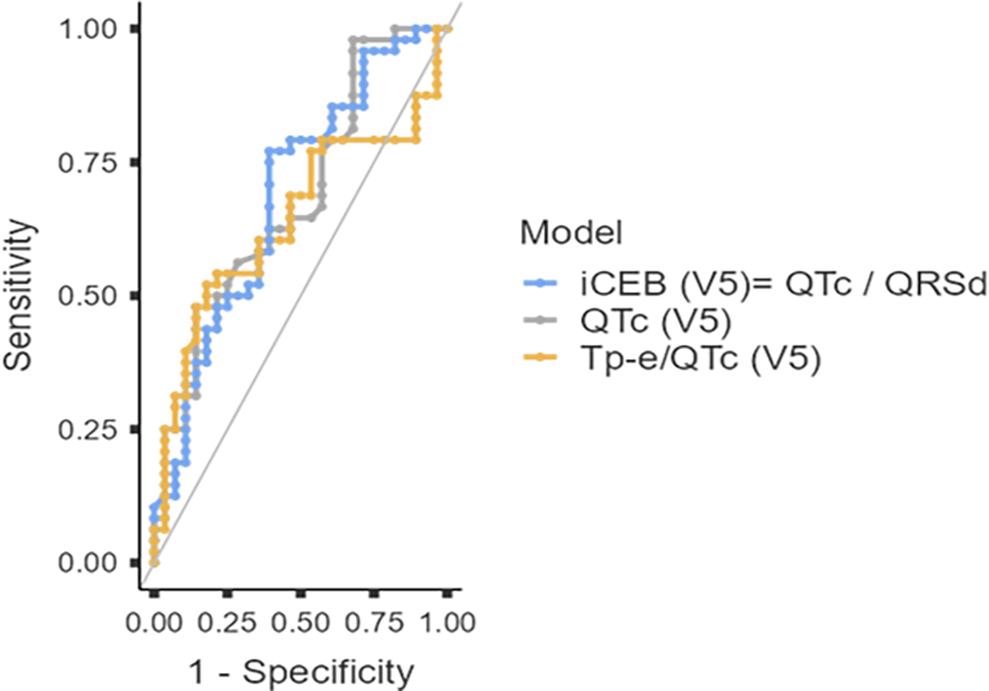
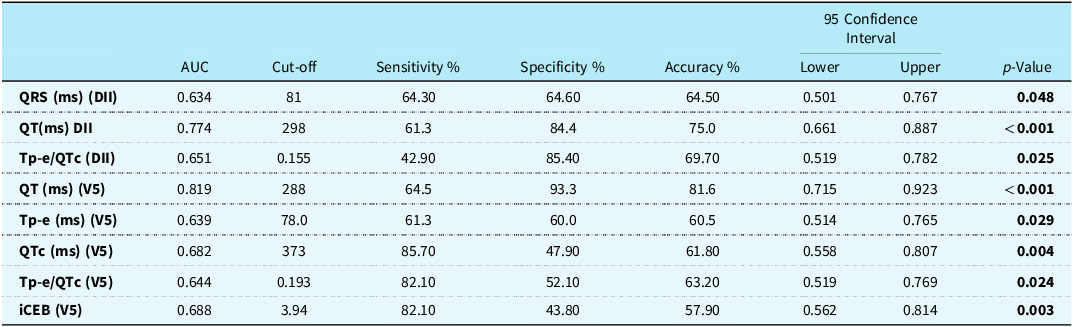
Patients who developed arrhythmia (n = 28) exhibited significantly prolonged corrected QT and T-peak to T-end intervals, particularly in lead V5, compared with patients without arrhythmia (n = 48) (corrected QT: 470 vs. 435 ms, p < 0.001; T-peak to T-end: 110 vs. 90 ms, p < 0.001 Figure 2). In addition, statistically significant differences were observed in the index of cardiac electrophysiological balance and T-peak to T-end/corrected QT ratios between the two groups. Electrocardiographic parameters associated with arrhythmia risk prediction are given in Table 5.
Receiver operating characteristic (ROC) curves of electrocardiographic repolarisation parameters for predicting arrhythmia development in paediatric myocarditis. iCEB, index of cardiac electrophysiological balance (calculated as QT/QRS); QRSd, QRS duration; QT, QT interval; QTc, corrected QT interval; ROC, receiver operating characteristic; Tp-e, T peak-to-end interval.

Evaluation of ECG findings in arrhythmia prediction using ROC analysis

Table 5. Long description
The table presents data on various electrocardiographic parameters and their predictive values for arrhythmia risk. It includes columns for AUC, Cut-off, Sensitivity percent, Specificity percent, Accuracy percent, 95 Confidence Interval Lower, 95 Confidence Interval Upper, and p-Value. The parameters listed are QRS (ms) (DII), QT (ms) DII, Tp-e/QTc (DII), QT (ms) (V5), Tp-e (ms) (V5), QTc (ms) (V5), Tp-e/QTc (V5), and iCEB (V5). Each row provides specific values for these parameters, including their respective cut-off points, sensitivity, specificity, accuracy, confidence intervals, and p-values.
AUC = area under the curve; CI = confidence interval; DII = Lead II (Derivation II); iCEB = index of cardiac electrophysiological balance (calculated as QT/QRS); QRS, QRS duration; QT = QT interval; QTc = corrected QT interval; ROC = receiver operating characteristic; Tp-e = T peak-to-end interval.
Bold values indicate statistical significance (p < 0.05).
Receiver operating characteristic curves evaluating the performance of electrocardiographic parameters in predicting arrhythmia development are displayed in Figure 2. Among the evaluated repolarisation parameters, lead V5 QT interval area under the curve of 0.819 (95% confidence intervals: 0.715–0.923, p < 0.001), Lead II (Derivation II) QT interval (area under the curve: 0.774, 95% confidence intervals: 0.661–0.887, p < 0.001). Furthermore, Lead II (Derivation II) T-peak to T-end/corrected QT ratio (area under the curve: 0.651, 95% confidence intervals: 0.519–0.782, p = 0.025), V5 T-peak to T-end/corrected QT ratio (area under the curve: 0.644, 95% confidence intervals: 0.519–0.769, p = 0.024), and V5 T-peak to T-end interval (area under the curve: 0.639, 95% confidence intervals: 0.514–0.765, p = 0.029) showed statistically significant predictive value for arrhythmia occurrence.
T-peak to T-end, T-peak to T-end/QT, T peak–to–end/corrected QT, and index of cardiac electrophysiological balance in predicting fulminant myocarditis and ICU admission
T-peak to T-end values were significantly longer in patients with fulminant myocarditis (n = 10) compared to patients with normal cardiac function. The median T-peak to T-end value was 80 ± 23 ms in patients with fulminant myocarditis and 72 ± 17 ms in those with preserved cardiac function (p < 0.05). Receiver operating characteristic curve analysis was performed to evaluate the performance of baseline repolarisation markers in identifying patients at risk for developing fulminant myocarditis (Table 6). Among the parameters evaluated, the lead V5 index of cardiac electrophysiological balance (QTc/QRSd) showed significant predictive performance with an area under the curve of 0.712 (95% confidence intervals: 0.518–0.906, p = 0.034); an optimal cut-off value of >4.70 resulted in a sensitivity of 77.8% and a specificity of 54.2%. Lead II T-peak to T-end showed borderline significance with an area under the curve of 0.694 (95% confidence intervals: 0.511–0.877, p = 0.052); a cut-off of >64.0 ms provided 88.9% sensitivity and 57.7% specificity. Lead II T peak–to–end/corrected QT achieved an area under the curve of 0.684 (95% confidence intervals: 0.462–0.906, p = 0.065) with a sensitivity of 66.7% and specificity of 68.3% at a cut-off of >0.191. The lead II index of cardiac electrophysiological balance did not show statistically significant predictive ability (area under the curve: 0.626, 95% confidence intervals: 0.431–0.820, p = 0.207). The T-peak to T-end/corrected QT ratio was higher in patients requiring ICU admission (n = 11) (median: 0.258, interquartile range: 0.181–0.400); however, this difference did not reach statistical significance (p = 0.051). No statistically significant differences were observed in T-peak to T-end or T-peak to T-end/corrected QT ratios at the time of hospital admission.
Predictive performance of repolarisation and electrophysiological balance indices for identifying fulminant myocarditis using ROC curve analysis

Table 6. Long description
A table with six rows and six columns comparing the predictive performance of various repolarisation and electrophysiological balance indices for identifying fulminant myocarditis. The columns are labeled Parameter, Cut-off, AUC (95% CI), Sensitivity (%), Specificity (%), and p-Value. The rows list different parameters: iCEB (lead V5), Tp-e (lead II), Tp-e/QTc (lead II), and iCEB (lead II). Each row provides specific values for Cut-off, AUC with 95% confidence intervals, Sensitivity, Specificity, and p-Value. Notable trends include the significant predictive performance of iCEB (lead V5) with an AUC of 0.712 and a p-value of 0.034, and the borderline significance of Tp-e (lead II) with an AUC of 0.694 and a p-value of 0.052.
Note: ROC curve analysis was performed across the myocarditis cohort to identify fulminant disease trajectory. Optimal diagnostic cut-off thresholds were determined using the maximum Youden index (J = sensitivity + specificity − 1). Bold text indicates statistical significance (p < 0.05).
AUC = area under the curve; CI = confidence interval; iCEB = index of cardiac electrophysiological balance; QRSd, QRS duration; QTc = corrected QT interval; ROC = receiver operating characteristic; Tp-e = T peak-to-end interval.
Discussion
Myocarditis is a condition associated with significant morbidity and mortality in the paediatric population. In the present study, electrocardiographic interval parameters were compared between 76 paediatric patients diagnosed with myocarditis and a healthy control group. Statistically significant prolongation of the PR, QRS, QT, corrected QT, and T-peak to T-end intervals was observed in patients with myocarditis, indicating widespread electrical involvement of the myocardium.
Repolarisation heterogeneity: comparing paediatric myocarditis with healthy controls
The principal finding of our study is that paediatric patients with acute myocarditis exhibited significantly prolonged ventricular repolarisation and depolarisation intervals (PR, QRS, QT, corrected QT, and T-peak to T-end) compared with healthy controls. Specifically, the lead II T-peak to T-end interval was prolonged to 73.41 ± 19 ms compared to 64.21 ± 10 ms in healthy children (p < 0.001), accompanied by an increased T-peak to T-end/corrected QT ratio (0.187 ± 0.05 vs. 0.168 ± 0.032, p = 0.008). The T-peak to T-end interval serves as an electrophysiological surrogate reflecting transmural dispersion of repolarisation between mid-myocardial M-cells and subendocardial/epicardial myocytes. Myocardial inflammation, interstitial oedema, and cytolytic injury disrupt intercellular gap junction coupling and alter cardiomyocyte refractory periods, thereby establishing localised gradients of repolarisation. In receiver operating characteristic curve analysis discriminating myocarditis patients from healthy individuals, repolarisation parameters exhibited robust diagnostic accuracy. Lead II QT (area under the curve: 0.794), lead V5 QT (area under the curve: 0.781), and lead II T-peak to T-end (area under the curve: 0.725) yielded substantial discriminatory performance with high specificity. These findings corroborate prior observations by Uçar et al. in acute myocarditis, confirming that inflammatory myocardial injury inherently prolongs terminal repolarisation vectors. Reference Ucar, Ozturk and Yılmaztepe18
Comparison with paediatric inflammatory literature
Altered ventricular repolarisation dispersion has previously been described across various paediatric inflammatory conditions. Turan et al. reported prolonged T-peak to T-end intervals and elevated T-peak to T-end/corrected QT ratios in children with multisystem inflammatory syndrome in children, noting an inverse correlation between repolarisation intervals and depressed left ventricular ejection fraction (mean EF ∼53.7%). Reference Turan and Ciftel19 Similarly, Ece et al. reported heightened repolarisation dispersion in paediatric COVID-19 cohorts. Reference Ece, Koçoğlu and Kavurt20 However, it is essential to emphasise that those cohorts were evaluated during acute systemic viral/post-viral states without confirmed clinical myocarditis, and neither study documented the incidence or types of sustained clinical tachyarrhythmias or conduction blocks. In contrast, our study investigated a dedicated acute myocarditis population wherein clinical arrhythmias occurred in 64.4% of patients (encompassing supraventricular tachycardia, sinus tachycardia, atrial fibrillation, and high-grade atrioventricular block). Our findings demonstrate that these electrophysiological metrics are not merely indirect markers of systemic inflammation or depressed systolic function but possess direct diagnostic and prognostic utility for documented arrhythmic outcomes in paediatric myocarditis.
Prediction of arrhythmias and the diagnostic role of the index of cardiac electrophysiological balance
While Robyns et al. originally established that elevated index of cardiac electrophysiological balance reflects an expanded cardiac wavelength predisposed to triggered activity and non-ischaemic ventricular arrhythmias, clinical data evaluating this parameter in paediatric inflammatory heart disease remain scarce. Reference Robyns, Lu and Gallacher8 Similar electrophysiological derangements have been described in paediatric carditis and systemic inflammatory cohorts, where repolarisation delays consistently outpace conduction times. Furthermore, the substantial negative predictive value observed with our lead V5 index of cardiac electrophysiological balance threshold (80.8% at a cut-off of 3.94) is consistent with the observations of Ucar et al. This supports the notion that, in acute myocardial injury, stable repolarisation parameters can reliably rule out a potential arrhythmic collapse in the near future. Reference Ucar, Ozturk and Yılmaztepe18
Fulminant myocarditis and intensive care stratification
In our study, a marked prolongation of repolarisation was observed in patients with fulminant myocarditis; T-peak to T-end values were significantly higher in fulminant cases (80 ± 23 ms vs. 72 ± 17 ms, p < 0.05). In the receiver operating characteristic analysis, the lead V5 index of cardiac electrophysiological balance was found to be statistically significant in predicting a fulminant course (area under the curve: 0.712, 95% confidence intervals: 0.518–0.906, p = 0.034; >77.8% sensitivity and 54.2% specificity at a threshold of 4.70). Lead II T-peak to T-end, on the other hand, showed borderline significance and provided high sensitivity (area under the curve: 0.694, p = 0.052; >88.9% sensitivity at a threshold of 64.0 ms). These findings are consistent with the literature highlighting repolarisation heterogeneity in myocardial inflammation. Reference Biener, Giannitsis and Kuhner21–Reference Majunke, Haertel and Binzenhöfer23 Robyns et al. showed that elevated index of cardiac electrophysiological balance levels set the stage for early afterdepolarisations and triggered activity as a result of repolarisation delay exceeding conduction velocity. Reference Robyns, Lu and Gallacher8 Indeed, Turan and Çiftel reported that prolonged T-peak to T-end and reduced T-peak to T-end/corrected QT ratios in multisystem inflammatory syndrome in children cases were associated with impaired left ventricular systolic function; Reference Turan and Ciftel19 Uçar et al., meanwhile, demonstrated that terminal repolarisation vectors are prolonged in acute myocarditis. Reference Ucar, Ozturk and Yılmaztepe18 In particular, the high sensitivity demonstrated by the lead II T-peak to T-end (>64.0 ms) and V5 index of cardiac electrophysiological balance (>4.70) parameters may offer practical clinical benefits in emergency department triage. Assessing these parameters via a standard electrocardiographic before the development of haemodynamic collapse or marked elevations in cardiac enzymes may contribute to the early identification of children at risk for fulminant myocarditis and the timely planning of intensive care monitoring.
The 2021 American Heart Association scientific statement recommends close monitoring of markers indicating organ dysfunction, in addition to cardiac-specific enzymes, in the management of paediatric myocarditis. In our study, the absence of a statistically significant difference in troponin levels between groups (p = 0.544) supports the well-recognised observation that peak troponin values during the acute phase do not consistently correlate with prognosis. This phenomenon may be explained by the fact that the duration and pattern of myocardial inflammation, rather than absolute troponin concentrations, play a more decisive role in disease progression. Reference Biener, Giannitsis and Kuhner21 In our cohort, complete blood count analyses were evaluated with respect to arrhythmic outcomes. While baseline platelet counts were significantly higher in patients with arrhythmias (p = 0.005), leukocyte counts showed an elevated trend that did not reach statistical significance (p = 0.087). These findings might reflect the intense systemic inflammatory burden accompanying acute myocardial involvement in patients prone to rhythm disturbances, rather than serving as distinct markers of fulminant trajectory.
Study limitations
Several limitations must be acknowledged. First, this study was conducted at a single tertiary centre with a retrospective design, which inherently limits causal inference. Second, because fulminant myocarditis occurred in a limited subset of patients (n = 10), formal receiver operating characteristic curve analyses for fulminant trajectory were precluded to prevent statistical overfitting; hence, threshold determinations for this subgroup warrant prospective validation. Third, electrocardiographic intervals were measured manually by a blinded cardiologist; although manual callipers remain a standard technique, minor inter-observer variability in identifying the exact end of the T wave cannot be completely excluded. Finally, long-term post-discharge Holter monitoring data were unavailable to evaluate chronic ventricular arrhythmogenesis or late myocardial scarring.
Conclusion
In conclusion, the findings of our study are largely consistent with previously published data; however, population-related differences should be considered. We propose that T-peak to T-end–based indices, particularly T-peak to T-end/QT, T-peak to T-end/corrected QT, and index of cardiac electrophysiological balance ratios, may serve as valuable complementary tools to traditional parameters in predicting arrhythmia risk due to their high specificity. In the future, multicentre studies that include larger patient populations and involve long-term follow-up will provide a clearer picture of the prognostic value of these electrophysiological parameters.
Financial support
This research received no specific grant from any funding agency in the public, commercial, or not-for-profit sectors.
Competing interests
None.
Ethical standard
This study involving human participants was conducted in accordance with the ethical standards of the Declaration of Helsinki and was approved by the relevant institutional ethics committee. All procedures were performed in accordance with applicable ethical guidelines and regulations.