Implications
The novel objective of this experiment was to use post-grazing sward height (PGSH) to govern grazing severity during the dairy cow's lactation. The results deliver useful information to dairy farmers who choose the practice of severe grazing (below 3 cm) to deal with grass deficits in early lactation. Such a strategy substantially reduces immediate and cumulative animal production. In contrast, grazing to 3.5 cm in the first two grazing rotations was identified as the best compromise between high milk production and high pasture utilisation. Subsequently, PGSH should be increased to 4.5 cm to achieve adequate animal performance while maintaining high pasture quality.
Introduction
With the abolition of European Union (EU) milk quotas in 2015, European dairy farmers will face a more volatile milk price (Shalloo et al., Reference Shalloo, O'Donnell and Horan2007). It is envisaged that EU milk production will expand in regions where low input, pastoral-based dairy systems that utilise large quantities of grazed grass over a long grazing season predominate (Lips and Rieder, Reference Lips and Rieder2005). Countries such as Ireland will have a competitive advantage over many of their European counterparts, this advantage can be further capitalised upon, if the grazed grass proportion of the dairy cow's diet can be increased in early spring, thereby minimising the use of concentrates and conserved forages.
Although previous studies recommend a post-grazing sward height (PGSH) of 4 cm during the first two grazing rotations (McEvoy et al., Reference McEvoy, Kennedy, Murphy, Boland, Delaby and O'Donovan2008) the imposition of a lower PGSH during this critical time, when grass growth is low (Brereton et al., Reference Brereton, Carton and O'Keeffe1985) can increase the accumulation of herbage required for grazing because of the smaller daily area grazed by the cow (McEvoy et al., Reference McEvoy, Kennedy, Murphy, Boland, Delaby and O'Donovan2008). A decrease in milk yield is expected with decreasing PGSH due to a lower feed allowance (Kennedy et al., Reference Kennedy, O'Donovan, O'Mara, Murphy and Delaby2007; McEvoy et al., Reference McEvoy, Kennedy, Murphy, Boland, Delaby and O'Donovan2008; PGSH ranging from 3.5 to 5.0 cm), however, recent experiments have shown that grazing swards to a low PGSH in early spring results in increased herbage quality (Stakelum and Dillon, Reference Stakelum and Dillon2007) and can support greater subsequent milk production (Kennedy et al., Reference Kennedy, O'Donovan, Murphy, O'Mara and Delaby2006).
Findings are inconsistent regarding the existence of carryover effects on mid-lactation dairy cow performance following a period of early lactation feed restriction (Friggens et al., Reference Friggens, Emmans, Kyriazakis, Oldham and Lewis1998; Kennedy et al., Reference Kennedy, O'Donovan, O'Mara, Murphy and Delaby2007; Roche, Reference Roche2007). This may be due to variations in diet (Friggens et al., Reference Friggens, Emmans, Kyriazakis, Oldham and Lewis1998), timing of the restriction or the duration and amplitude of restriction (Broster and Broster, Reference Broster and Broster1984; Delaby et al., Reference Delaby, Faverdin, Michel, Disenhaus and Peyraud2009). Furthermore, grazing experiments examining the consequences of restriction in early lactation have not investigated PGSH as an indicator of the plane of nutrition.
Previous studies have shown that increasing PGSH in mid-season rotational grazing systems increased milk production, which was mainly associated with an increase in pasture allowance (Wales et al., Reference Wales, Doyle, Stockdale and Dellow1999). The benefit of consistent lenient grazing (>5.5 cm) on cow performance may be less evident in the long term because of the deterioration of pasture nutritive value throughout the grazing season (Stakelum and Dillon, Reference Stakelum and Dillon1991). Further information is required, however, to (i) assess the true effects of a consistently imposed PGSH, as in previous studies reporting PGSH it has been the result of the imposed stocking rate (Michell and Fulkerson, Reference Michell and Fulkerson1987; Stakelum and Dillon, Reference Stakelum and Dillon2007) or daily herbage allowance (DHA; Maher et al., Reference Maher, Stakelum and Rath2003; McEvoy et al., Reference McEvoy, Kennedy, Murphy, Boland, Delaby and O'Donovan2008) and (ii) to describe the milk production response to very low PGSH (<4 cm) during the main grazing season. Finally, there is a requirement to investigate total lactation performance within a pasture-based production system, to establish if early lactation dairy cow grazing management can potentially compromise total cumulative milk and milk solids production.
This study hypothesised that grazing to lower PGSH than currently recommended results in reduced immediate and cumulative dairy cow production performance. The study had three main objectives: (i) to quantify the effect of PGSH imposed during early lactation on milk production performance, grass dry matter intake (GDMI), BW and body condition score (BCS) of spring-calving dairy cows; (ii) to investigate the carryover effect of PGSH, imposed during early lactation, on subsequent animal lactation performance; (iii) to identify the effect of PGSH imposed during the remainder of the grazing season on grass utilisation and animal performance.
Material and methods
The experiment was undertaken at Animal & Grassland Research and Innovation Centre, Teagasc, Moorepark, Fermoy, Co. Cork, Ireland (50°16′N; 8°25'W). The soil type was a free draining acid brown earth of sandy loam-to-loam texture. The area used for the experiment was a predominately perennial ryegrass (Lolium perenne L.) permanent grassland site; swards were on average 5 years old. The dominant cultivars originally sown in the experimental area were late-heading diploid cultivars cv. Twystar, Gilford and Tyrella, and were sown as mixtures.
Experimental design and treatments
The experiment was separated into two periods. Period 1 (P1) was conducted as a randomised block design commencing when animals were turned out to grass immediately post calving, 10 February 2010, until 18 April (10 weeks). Animals were randomly assigned pre-calving to one of two PGSH treatments (n = 36): 2.7 cm (S1, severe) or 3.5 cm (M1, moderate) for the duration of P1. Period 2 (P2) was a 2 × 2 factorial design, which began on 19 April and concluded on 30 October (27 weeks). Before the commencement of P2, animals were re-randomised within their P1 treatments, balanced into two groups and assigned to graze to either 3.5 or 4.5 cm across each of the two swards created from the different PGSH imposed during P1. This resulted in four grazing treatments during P2, with 18 cows in each: SS (2.7 cm PGSH in P1 and 3.5 cm PGSH in P2), SM (2.7 cm PGSH in P1 and 4.5 cm PGSH in P2), MS (3.5 cm PGSH in P1 and 3.5 cm PGSH in P2) and MM (3.5 cm PGSH in P1 and 4.5 cm PGSH in P2).
Animals
Seventy-two Holstein–Friesian dairy cows were selected from the Moorepark general spring-calving herd. Thirty-two cows were primiparous, whereas the remaining 40 were multiparous (29 cows were in their second lactation). All animals were balanced on the basis of calving date (12 February; s.d. 14.8 days), lactation number (1.8; s.d. 1.1), dam's first lactation milk yield and composition (first 36 weeks) for the primiparous cows and previous lactation milk yield for the multiparous cows (4744; s.d. 1426.9 kg/cow), milk fat (42.6; s.d. 3.75 g/kg), protein (33.9; s.d. 1.59 g/kg) and lactose (46.4; s.d. 0.91 g/kg) concentrations, BW (538; s.d. 36.1 kg) and BCS (3.39; s.d. 0.34). Immediately post-calving, animals were randomly allocated to one of two P1 grazing treatments. Before the commencement of P2, animals were re-randomised within their P1 treatment on the basis of the last 3-week data of P1: milk yield (22.7; s.d. 4.25 kg/cow per day), milk fat (40.6; s.d. 5.18 g/kg), protein (30.2; s.d. 1.80 g/kg) and lactose (47.2; s.d. 0.96 g/kg) concentrations, milk solids yield (1.60, s.d. 0.311 kg/cow per day), BW (453, s.d. 51.8 kg) and BCS (2.91, s.d. 0.210). Once groups were balanced, they were randomly assigned to one of two PGSH treatments for P2. Throughout the study, when grass supply was unable to fully meet animals feed demand for one or more treatments, animals from all treatments were supplemented with equal amounts of concentrate. This resulted in a total of 225 kg dry matter (DM)/cow (or 4.5 kg/cow per day, on average) fed during P1 and 248 kg DM/cow (or 1.2 kg/cow per day, on average) fed during P2. During periods of excessive rainfall surface damage was minimised by allowing animals to graze for a 3-h period after milking and then removing them from pasture (Kennedy et al., Reference Kennedy, Curran, Mayes, McEvoy, Murphy and O'Donovan2011). No additional feed was offered when they returned indoors.
Pasture and herd management
The total experimental grazing area (26 ha) was divided into seven blocks of equal size on the basis of soil fertility, grass cultivar and sward age. Within each block, rotationally grazed paddocks were randomly assigned to one of P1 PGSH treatments so that each treatment received an equal area (13 ha) and number of paddocks during P1. The overall stocking rate of each treatment was 2.74 cows/ha. Following P1, each paddock was sub-divided and permanently fenced into two equal areas (sub-paddocks). Paddocks initially grazed to 2.7 cm during P1 were assigned to either the SS or SM treatment during P2, whereas paddocks grazed to 3.5 cm during P1 were assigned to either the MS or MM treatment during P2.
Two blocks from each treatment were selected from the grazing area and were used as ‘base paddocks’ to undertake additional sward measurements throughout the experiment. Base paddocks were grazed during every rotation, that is, they were not harvested for silage or mechanically topped at any stage during the year.
Animals were offered fresh grass, by using temporary electric fences, following each milking in P1 and on a 24-h basis during P2, due to drier ground conditions. Each herd was managed independently throughout the study. The target pre-grazing yield was between 1200 and 1600 kg DM/ha (>3.5 cm) during the main grazing season. Pasture quality was maintained by the removal of paddocks with excessively high pre-grazing herbage mass (HM) as silage throughout the main grazing season. No swards were topped (mechanically conditioned) during the experiment. In order to ensure target PGSH was achieved, sward heights were measured before cows returned to the paddock following morning milking. If the target PGSH was not achieved, animals remained in their previous day's grazing area until they grazed to their target PGSH. Consequently, DHA and area grazed/cow per day fluctuated throughout the experiment because of differences in pre-grazing HM and the requirement to keep PGSH constant.
Sward measurements
Pre-grazing HM was calculated above the lowest targeted PGSH, that is, 2.7 cm in P1 and 3.5 cm in P2, twice weekly, by cutting two strips (1.2 × 10 m) per treatment paddock with a motor Agria (Etesia UK Ltd, Warwick, UK) before each paddock was grazed. Ten grass height measurements were recorded before and after harvesting on each cut strip using a folding pasture plate meter with a steel plate (diameter 355 mm and 3.2 kg/m2; Jenquip, Fielding, New Zealand). All mown herbage from each strip was collected, weighed and subsampled. An herbage sample of 100 g fresh weight was dried for 16 h at 90°C for DM determination.
The methodology used to calculate post-grazing DM yield was identical to that described above for pre-grazing HM. In P1, post-grazing HM was calculated from quadrat cuts to ground level. In P2, post-grazing HM was determined twice weekly by cutting one 20 m long strip to 3.5 cm with the Agria machine (Etesia) in the area where cows had grazed the previous day. DHA (kg DM/cow per day) was calculated using pre-grazing HM and accordingly changing the area offered per cow per day.
Mean pre-grazing sward height was measured daily throughout the experiment by recording ∼40 heights per treatment across the two diagonals of each paddock before grazing using a folding pasture plate meter (as previously described). Following grazing, mean PGSH was calculated with a similar method to pre-grazing height measurement, with sward height measurements incorporating dung pat areas.
Herbage utilisation was calculated using the pre-grazing HM relative to the post-grazing HM. HMs were corrected to 2.7 cm (in P1) or 3.5 cm (in P2) for the calculation. Pasture removed was calculated as ((pre-grazing sward height − PGSH) × HM/cm × (area grazed/cow per day); kg DM/cow per day; >2.7 cm or >3.5 cm in P1 and P2, respectively); (Delaby and Peyraud, Reference Delaby and Peyraud1998).
Animal measurements
Milking took place at 0700 and 1600 h daily. Individual milk yields (kg) were recorded daily at each milking (Dairymaster, Causeway, Co. Kerry, Ireland). Milk fat, protein and lactose concentrations were calculated weekly from one successive evening and morning milking sample for each animal. The concentrations of these constituents in the milk were determined by using a Milkoscan 203 (Foss Electric DK, Hillerød, Denmark). Milk solids yield (kg) was calculated from milk fat and protein yields (milk fat plus milk protein yield).
BW and BCS were recorded weekly throughout the experiment. An electronic portable weighing scale with the Winweigh software package (Tru-test Limited, Auckland, New Zealand) was used to record BW. Body condition was scored by an experienced independent observer on a scale from 1 to 5 (where 1 = emaciated, 5 = extremely fat) with 0.25 increments (Lowman et al., Reference Lowman, Scott and Somerville1976).
Individual GDMI was estimated once in P1 (week 7) and twice in P2 (weeks 4 and 15 of P2) using the n-alkane technique (Dillon and Stakelum, Reference Dillon and Stakelum1989). All cows were dosed twice daily for 12 days before morning and evening milking with a paper pellet (Carl Roth, GmbH, Karlesruhe, Germany) containing 500 mg of dotriacontane (C32-alkane). From days 7 to 12 of dosing, faeces samples were collected from each cow twice daily before morning and evening milking and stored at −20°C. The faeces samples were then thawed and bulked (12 g of each collected sample) and dried for 48 h in a 60°C oven. Samples were then milled through a 1-mm screen and stored for chemical analysis (DM and ash contents; AOAC, 1995, method 942.05). During the period of faeces collection, the diet of the animals was also sampled. Daily herbage samples were manually collected with Gardena hand shears (Accu 60, Gardena International GmbH, Ulm, Germany) following close observation of the previous day PGSH to collect a representative sample of the herbage grazed. Herbage samples were frozen at −20°C following collection. The ratio of herbage C33 to dosed C32 was used to estimate intake. The n-alkane concentration of the dosed pellets, faeces and herbage were determined as described by Dillon (Reference Dillon1993). During the periods of GDMI measurement, the organic matter digestibility (OMDf) of the diet consumed by the animals was estimated by deducting the organic matter faecal output from the organic matter intake (OMI).
Chemical analysis
Once a week, herbage representative of that selected by the cows was manually collected with a Gardena hand shears by using the same method used to sample herbage selected during periods of GDMI (i.e. defoliating at the previous days PGSH). Samples were frozen at −20°C following collection. Herbage samples were then bowl-chopped, freeze-dried and milled through a 1-mm screen. Samples were analysed for DM, ash (AOAC, 1995; method 942.05), ADF and NDF (using the procedures of AOAC 1995; method 973.18; using sodium sulphate for the NDF; ANKOM™ technology, Macedon, NY, USA), CP (Leco FP-428; Leco Australia Pty Ltd, Baulkham Hills B.C., NSW, Australia) and OMD (Fibertec™ Systems, FOSS, Ballymount, Dublin, Ireland).
Statistical analyses
All statistical analyses were carried out using SAS. The pasture data were analysed by ANOVA using the terms for treatment, paddock and rotation.
Animal data were analysed as 72 individual variables using covariate analysis. The calculation of BW and BCS changes over P1 and P2 were calculated using the difference between the average from the last 2 weeks data and the average from the first 2 weeks data, respectively, for each period. For the analysis of P1 variables, the pre-experimental milk yield, milk composition, BW and BCS and days in milk (DIM) were used as covariates. Because of differences in parity, pre-experimental values were centred within parity before inclusion. That is, the deviations from the parity mean were used as covariates. The incorporation of individual animal covariates within the model aimed to reduce the residual error term, therefore explaining more variation within parity. For the analysis of P2 variables, the data used as covariates were the average milk yield, milk composition, BW and BCS of the 2 last weeks of P1. The covariates were first centred within parity and P1 treatment. Daily milk yield, milk constituent yield, milk composition, dry matter intake (DMI), BW and BCS were averaged per cow and period and analysed for each period with the following models:
 $${{\rm{Period}}\,{\rm{1:}}\,{{Y}_{ij}}\: = \:\mu \: + \:{{P}_i}\: + \:T{{{\rm{1}}}_j}\: + \:{{P}_i}\:\times \:T{{{\rm{1}}}_j}\: + \:{{b}_{\rm{1}}}X{{1}_{ij}}\:\cr\quad + \:{{b}_{\rm{2}}}{\rm{DI}}{{{\rm{M}}}_{ij}}\: + \:{{e}_{ij}}$$
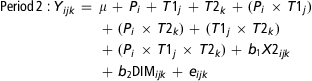 $${ {\rm{Period}}\,{\rm{2:}}\,{{Y}_{ijk}}\: = \: & \mu \: + \:{{P}_i}\: + \:T{{{\rm{1}}}_j}\: + \:T{{{\rm{2}}}_k}\: + \:{\rm{(}}{{P}_i}\:\times \:T{{{\rm{1}}}_j}{\rm{)}}\:\cr + \:{\rm{(}}{{P}_i}\:\times \:T{{{\rm{2}}}_k}{\rm{)}}\: + \:{\rm{(}}T{{{\rm{1}}}_j}\:\times \:T{{{\rm{2}}}_k}{\rm{)}}\:\cr + \:{\rm{(}}{{P}_i}\:\times \:T{{{\rm{1}}}_j}\:\times \: T{{{\rm{2}}}_k}{\rm{)}}\, +\,{{b}_{\rm{1}}}X{{{\rm{2}}}_{ijk}}\:\cr + \:{{b}_{\rm{2}}}{\rm{DI}}{{{\rm{M}}}_{ijk}}\: + \:{{e}_{ijk}} $$
where Yijk represents the response of animal in parity i to treatment j, μ = mean, Pi = parity (i = 1 to 2), T1j=P1 PGSH treatment (j = 1 to 2), T2k = P2 PGSH treatment (k = 1 to 2), Pi × T1j and Pi × T2k = the interactions between parity and P1 or P2 treatment, respectively, T1j × T2k = the interaction between P1 treatment and P2 treatment, Pi × T1j × T2k = the interaction between parity, P1 treatment and P2 treatment; b 1X 1ij and b 1X 2ijk = the pre-experimental milk output or BW/BCS variables in P1 and P2, respectively, b 2DIMijk = the days in milk (up to 18 April) and eijk is the residual error term.
When the performance of the SS and MS treatments are reported together in the paper, it corresponds to the statistical average between these two treatments and is the result of the effect of the severe PGSH imposed in P2. The statistical average between SM and MM is the result of the effect of the moderate PGSH imposed in P2.
Results
Weather and grass growth
Monthly rainfall was below the 10-year average for the months of February, April, May, June, August and October but higher than the 10-year average for the months of March, July and September. Annual rainfall was −94 mm than the 10-year average (722 mm, between February and October). Over the experiment, mean daily air temperature averaged 10.8°C, which was 0.6°C less than the 10-year average for the same period. On average between February and April, mean air temperatures (5.6°C) were 1.6°C lower than the 10-year average for these months. Consequently, mean grass growth rate was 15 kg DM/ha per day lower than the 10-year average between February and April (20 kg DM/ha per day, on average). For the remaining months of the study, grass growth was similar to the 10-year average except in May (99 kg DM/ha per day) when growth rate was +11 kg DM/ha per day than average.
Grass chemical composition and pasture measurements
In early lactation
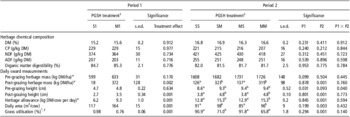
During P1, the herbage selected by both S1 and M1 treatments was similar in quality (Table 1). The PGSH achieved were 2.7 and 3.5 cm on the S1 and M1 treatments. The lower PGSH was the result of a lower DHA offered to the S1 animals (Table 1) compared with that offered to the M1 animals and resulted in 3.2 kg DM/cow per day less herbage removed by the S1 animals than that removed by M1 animals (9.0 kg DM/cow per day; P < 0.001).
Effect of PGSH during period 1 (P1; 10 February to 18 April) and period 2 (P2; 19 April to 30 October) on weekly chemical composition of the herbage selected by the animals, pre- and post-grazing daily sward measurements and grass utilisation

PGSH = post-grazing sward height; DM = dry matter.
1P1 PGSH: S1 = 2.7 cm; M1 = 3.5 cm.
2P2 PGSH: SS = 2.7 cm in P1, 3.8 cm in P2; SM = 2.7 cm in P1, 4.8 cm in P2; MS = 3.5 cm in P1, 3.8 cm in P2; MM = 3.5 cm in P1, 4.8 cm in P2.
3Percentage of grass utilisation, calculated from pre-grazing yield to post-grazing yield.
*Measurements above 2.7 cm in P1 and above 3.5 cm in P2.
P1 = Carryover effect of P1 treatment in P2; P2 = immediate effect of P2 treatment; P1 × P2 = interaction between P1 and P2 treatments.
s.e.d = standard error of the difference.
a,bMeans within a row with different superscripts differ (P < 0.05).
From mid-season to late lactation
During P2, the SS and MS animals grazed to 3.8 cm, whereas 4.8 cm was the PGSH achieved by the SM and MM animals (Table 1). This difference was created by a 2.5 kg DM/cow per day difference in DHA between the SS and MS (12.9 kg DM/cow per day) and SM and MM animals (Table 1). Animals from SS and MS removed 11.5 kg DM/cow per day of pasture, compared with 12.6 kg DM/cow per day for the SM and MM animals.
Grass DM and OM intakes
In early lactation
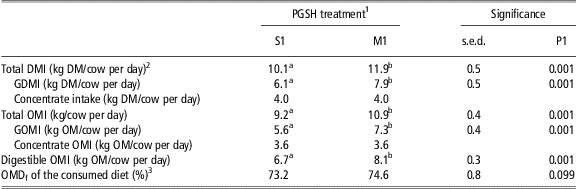
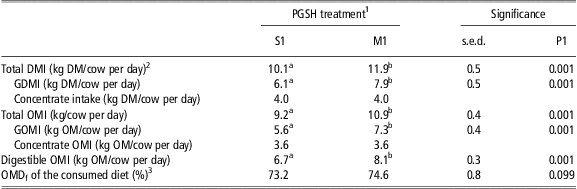
The diet OMD of the herbage eaten, estimated from the faecal output of each cow during the DMI measurement in P1 did not differ between the S1 and M1 treatments (73.9%). The M1 animals had greater (P < 0.001) GDMI (+1.8 kg/cow), grass OMI (+1.7 kg/cow), total OMI (+1.7 kg/cow) and digestible OMI (+1.4 kg/cow) than the S1 animals (Table 2).
Effect of PGSH on daily grass and total DMI and OMI of spring-calving dairy cows during early lactation (P1, 10 February to 18 April)
PGSH = post-grazing sward height; DMI = dry matter intake; OMI = organic matter intake; DM = dry matter; GDMI = grass dry matter intake; GOMI = grass organic matter intake; OMD = organic matter digestibility.
1P1 PGSH: S1 = 2.7 cm; M1 = 3.5 cm.
2Total DMI, measured from 21 to 25 March (7th week of P1); TDMI was calculated by assuming animals consumed all concentrate offered and by adding the offered concentrate allowance to actual herbage intake, which was calculated using the n-alkane technique.
3OMD estimated from the individual faecal index during the GDMI measurement periods.
s.e.d = standard error of the difference.
a,bMeans within a row with different subscripts differ (P < 0.05).
From mid-season to late lactation
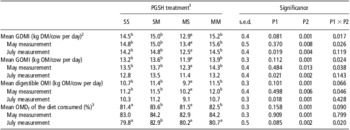
The SM and MM treatments together had greater (83.0%; P < 0.001) diet OMD than the average of the SS and MS treatments (81.5%). The SM and MM cows had +1.4 kg/cow GDMI, +1.3 kg/cow total OMI and +1.2 kg/cow digestible OMI than the SS and MS cows (P < 0.001; Table 3).
Effect and carryover effect of PGSH on daily GDMI and OMI of spring-calving dairy cows during period 2 (P2, 19 April to 30 October)

PGSH = post-grazing sward height; GDMI = grass dry matter intake; OMI = organic matter intake; DM = dry matter; GOMI = grass organic matter intake; OM = organic matter; OMD = organic matter digestibility.
1PGSH: SS = 2.7 cm in P1, 3.8 cm in P2; SM = 2.7 cm in P1, 4.8 cm in P2; MS = 3.5 cm in P1, 3.8 cm in P2; MM=3.5 cm in P1, 4.8 cm in P2.
2GDMI, calculated using the n-alkane technique.
3OMD estimated from the individual faecal index during the GDMI measurement periods.
P1 = carryover effect of P1 treatment in P2; P2 = immediate effect of P2 treatment; P1 × P2 = interaction between P1 and P2 treatments.
s.e.d = standard error of the difference.
a,bMeans within a row with different subscripts differ (P < 0.05).
Carryover effects of early lactation regime
In P2, there was an interaction (P = 0.057) between P1 and P2 treatments, the MS treatment recorded lower (P < 0.05) mean GDMI (−2.0 kg DM/cow) and total OMI (−1.7 kg OM/cow) and tended to have lower digestible OMI when compared with the SS, SM and MM treatments (Table 3). During P2, the animals from S1 or M1 treatments had similar diet OMD (82.3%). On average throughout P2, the S1 animals tended to have greater mean GDMI (+0.8 kg/cow; P = 0.08) than the M1 animals (14.1 kg DM/cow). The differences between S1 and M1 treatments in GDMI, total OMI and digestible OMI were significant (P < 0.05) during the July GDMI measurement period (Table 3).
Milk production and composition
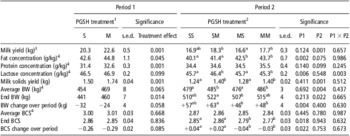
In early lactation. Decreasing PGSH from M1 to S1 during P1 decreased milk yield by 2.3 kg/cow per day (P < 0.001) as well as decreasing milk fat and protein concentrations (Table 4). The S1 cows decreased (P < 0.001) milk protein (−95 g/day), fat (−143 g/day), lactose (−109 g/day) and milk solids (−0.24 kg/cow per day) yields when compared with M1 (733 g/day, 1007 g/day, 1058 g/day and 1.74 kg/cow per day, respectively).
Effect of PGSH imposed during period 1 (P1; 10 February to 18 April) and period 2 (P2; 19 April to 30 October) and carryover effect of PGSH in early spring on dairy cow milk yield, BW and BCS during P2

PGSH = post-grazing sward height; BCS = body condition score.
1P1 PGSH: S1 = 2.7 cm; M1 = 3.5 cm.
2Period 2 PGSH: SS=2.7 cm in P1, 3.8 cm in P2; SM = 2.7 cm in P1, 4.8 cm in P2; MS = 3.5 cm in P1, 3.8 cm in P2; MM = 3.5 cm in P1, 4.8 cm in P2.
3Milk yield was measured daily.
4Milk composition, BW and BCS were measured weekly throughout the experiment.
P1 = carryover effect of P1 treatment in P2; P2 = immediate effect of P2 treatment; P1 × P2 = interaction between P1 and P2 treatments.
s.e.d = standard error of the difference.
a,b,cMeans within a row with different superscripts differ (P < 0.05).
From mid-season to late lactation
There was no interaction between P1 and P2 treatment on animal production during the remainder of the lactation (Table 4). During P2, the SM and MM treatments recorded significantly (P < 0.001) greater milk (+1.3 kg/cow per day), fat (+78 g/day), protein (+57 g/day), lactose (+62 g/day) and milk solids (+0.14 kg/cow per day) yields when compared with the MS and SS treatment (16.7 kg/cow per day, 686 g/day, 575 g/day, 764 g/day, and 1.26 kg/cow per day, respectively). The SM and MM animals tended to have greater milk fat and protein concentrations (Table 4).
Carryover effects of early lactation regime
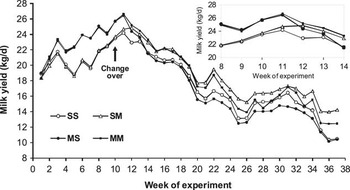
There was no effect of P1 treatment on milk yield during P2 (Table 4). From Figure 1, it is clear that milk yield differences between P1 treatments dissipated before the 3rd week of P2. Animals previously assigned to the M1 treatment (MS and MM) had +2.3 g/kg milk fat (P < 0.01) but −0.5 g/kg milk lactose (P < 0.01) concentrations and −31 g/day lactose yield (P < 0.05) than the animals from SS and SM (40.8 g/kg, 46.0 g/kg and 811 g per day, respectively). The MS and MM animals tended to have a greater milk protein concentration (+0.5 g/kg; P = 0.14) when compared with the SS and SM animals (34.5 g/kg).
Effect of post-grazing sward height (PGSH)1 on the lactation curve of spring-calving dairy cows, with particular emphasis on the subsequent 3 weeks following the change of treatment (see zoom). 1PGSH: SS = 2.7 cm in P1, 3.8 cm in P2; SM = 2.7 cm in P1, 4.8 cm in P2; MS = 3.5 cm in P1, 3.8 cm in P2; MM = 3.5 cm in P1, 4.8 cm in P2.

Cumulative lactation production
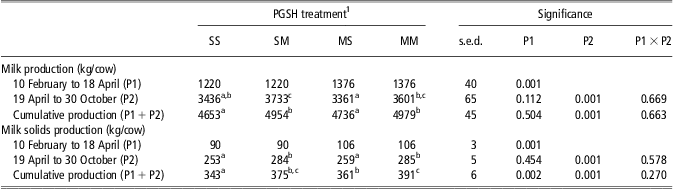
At the end of P1, the cumulative milk and milk solids yield produced per cow from the S1 treatment were 156 and 16 kg less (P < 0.001) than that of M1 cows (Table 5). At the end of the lactation, the SM and MM animals had accumulated +266 kg milk/cow and +28 kg milk solids/cow than the SS and MS animals. Treatment imposed in P1 tended to affect cumulative P2 milk yield: 3585 kg milk/cow for the SS and SM animals against 3481 kg milk/cow, for the MS and MM animals. There was, however, no effect of P1 treatment on total lactation cumulative milk production (Table 5). There was no carryover effect of P1 treatment on P2 cumulative milk solids yield, but the SS and SM animals yielded 19 kg less milk solids over the lactation than the MS and MM animals (378 kg/cow; P < 0.01).
Effect of PGSH on the cumulative milk and milk solids production of spring-calving dairy cows from 10 February to 18 April (period 1; P1), from 19 April to 30 October 30 (period 2; P2) and over the lactation (P1 + P2)
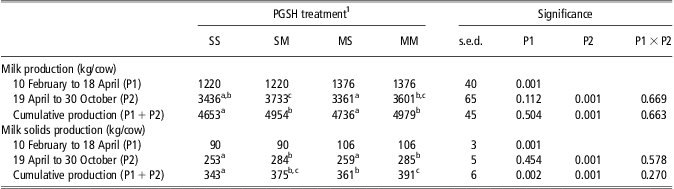
PGSH = post-grazing sward height.
1PGSH: SS = 2.7 cm in P1, 3.8 cm in P2; SM = 2.7 cm in P1, 4.8 cm in P2; MS = 3.5 cm in P1, 3.8 cm in P2; MM = 3.5 cm in P1, 4.8 cm in P2.
P1 = carryover effect of P1 treatment in P2; P2 = immediate effect of P2 treatment; P1 × P2 = interaction between P1 and P2 treatments.
s.e.d = standard error of the difference.
a,b,cMeans within a row with different superscripts differ (P < 0.05).
BW and BCS
At the start of P1, there was no significant difference between treatments in BW and BCS, which were 474 kg and 3.11 for the S1 cows, and 482 kg and 3.15 for the M1 cows. Following P1, the S1 animals had significantly lower end BW (−19 kg; P = 0.01) and tended to have a lower mean BW (−15 kg; P = 0.065) and higher BW loss (P = 0.058) than their counterparts (Table 4). The M1 animals tended (P = 0.085) to have a greater BCS loss (−0.29) compared with the S1 animals (−0.26).
Period 1 treatment affected animal BW and BCS in P2: the SS and SM (all S in P1) had a greater (+13 kg; P < 0.01) BW gain and end BCS (+0.07; P < 0.05) than their counterparts from MS and MM (all M in P1; +47 kg and 2.78, respectively). There was no significant difference in BW between S1 and M1 treatments at the end of the lactation. The BCS change over P2 was positive for the S1 cows, whereas it was negative for the M1 cows (P < 0.05; Table 4).
During P2, the SM and MM animals had significantly greater mean BW (486 kg, on average) and end BW (519 kg) than the SS and MS animals (478 and 509 kg, respectively). There was no effect of treatment on BCS (Table 4).
Discussion
Increasing the grazed grass proportion in the total lactation diet of the spring-calving dairy cow is a key objective for pasture-based dairy production systems to limit the use of conserved forages and concentrate (Kennedy et al., Reference Kennedy, O'Donovan, Murphy, Delaby and O'Mara2005). Grass supply is a limiting factor during the early spring period. One strategy to address this issue is to impose a low PGSH to utilise all available herbage. It was hypothesised that imposing a very low PGSH would have negative consequences on dairy cow production performance compared to a more lax PGSH.
Effect of PGSH in early lactation
The results from the current study confirm our initial hypothesis and emphasise the large reductions in GDMI and milk production performance of early lactation dairy cows that occur when a feed restriction is created by imposing a very low PGSH (e.g. <3.0 cm). The main reason for the limited intake on the S1 treatment was the low herbage availability per cow per day, as a consequence of imposing a PGSH of 2.7 cm. Below 2.7 cm, the sward horizon is dominated by stem and dead material, which acted as a barrier below which the animal could not graze any further (Edwards et al., Reference Edwards, Parsons, Penning and Newman1995). The reduction in GDMI consequently resulted in lower milk yield and increased BW loss. In contrast, the M1 cows were less restricted by the PGSH imposed: the area per cow per day was increased and so was the quantity of herbage available. The increased GDMI of these animals resulted in increased nutrient availability to increase milk synthesis and to avoid excessive BW loss during early lactation and is demonstrated when their digestible OMI is considered. During the GDMI measurement period, the M1 cows consumed diets with slightly greater OM digestibility (OMDf) than the S1 cows; however, the difference in OMDf between treatments was not significant. As a result, the difference in digestible OMI between treatments was similar to the difference in OMI. By defoliating swards to a less severe PGSH, the M1 cows increased their intake of digestible OM by 21% in comparison to the S1 cows. The extra energy consumed by these cows was used for milk production (+11%) and to support maintenance during early lactation.
The milk yield response of 2.88 kg of milk per extra cm in PGSH achieved in this study was higher than that reported by McEvoy et al. (Reference McEvoy, Kennedy, Murphy, Boland, Delaby and O'Donovan2008; 2.11 kg of milk per extra cm in PGSH; comparing 3.8 and 4.7 cm). Delaby et al. (Reference Delaby, Peyraud and Delagarde2001) reported a response of only 0.82 kg milk per extra cm in compressed plate meter height (5.7 v. 6.8 cm) with non-supplemented cows at pasture. From the studies reported above and the results of our experiment, it appears that cows are less restricted when laxer PGSH are achieved, as they have the ability to achieve higher DMI, and therefore have a greater ability to achieve their potential milk yield, resulting in smaller differences in milk yield response between treatments. The high milk response of the S1 treatment in our study supports the theory that their restricted GDMI resulted in greater BW loss.
The mobilisation of energy reserves is classically observed in early lactation (Friggens et al., Reference Friggens, Emmans, Kyriazakis, Oldham and Lewis1998) because the dairy cow, in negative energy balance, does not ingest sufficient nutrients to meet the energy demands of milk production. In the current study, the 21% increase in intake of digestible OM by the M1 cows led to an 11% milk yield increase and 25% less BW loss compared to the S1 animals. A decrease in BW is often found when the diet of dairy cows is restricted by the imposition of low PGSH in early lactation (Delaby et al., Reference Delaby, Foucher, Michel and Peyraud2003; Kennedy et al., Reference Kennedy, O'Donovan, O'Mara, Murphy and Delaby2007). The BW losses and the difference between treatments in this study were much larger (−0.48 kg/cow per day v. −0.36 kg/cow per day for the S1 and M1 animals) than that previously reported by McEvoy et al. (Reference McEvoy, Kennedy, Murphy, Boland, Delaby and O'Donovan2008; −0.23 kg/cow per day v. −0.03 kg/cow per day) with similar experiment duration, but with higher PGSH (3.8 and 4.7 cm). The large BW losses in the current study confirm the high level of feed restriction placed upon animals from both treatments.
Milk protein concentration was affected by PGSH in the current study. This is in contrast to that reported by Kennedy et al. (Reference Kennedy, O'Donovan, O'Mara, Murphy and Delaby2007) but concurs with Maher et al. (Reference Maher, Stakelum and Rath2003) who reported a linear increase in milk protein concentration with increasing PGSH from 4.4 to 6.5 cm (sward stick measurement). The review of Coulon and Rémond (Reference Coulon and Rémond1991) outlined a linear drop in milk protein concentration during periods of reduction in energy supply to dairy cows and was due to reductions in the mammary uptake of all nutrients. Roche (Reference Roche2007) suggested that body protein stores are likely to be mobilised to compensate for the shortage in metabolisable proteins in early lactation cows whose diet is restricted. This reduction in metabolisable proteins for milk production may contribute to the lower milk protein concentration in early lactation (P1). The literature is conflicting on the effect of feed restriction in early lactation on milk fat concentration. Roche (Reference Roche2007) and Kay et al. (Reference Kay, Phyn, Rius, Morgan, Grala and Roche2011) reported increased milk fat concentration on their restricted treatments, whereas Delaby et al. (Reference Delaby, Faverdin, Michel, Disenhaus and Peyraud2009) described a decrease in milk fat concentration with reduced DMI (and PGSH). Milk fat concentration has been shown to vary with the forage : concentrate (F : C) ratio of a diet. Although OMD of the diet selected by animals from each P1 treatment was similar, the M1 cows had a larger intake of digestible OM, mainly because of the greater herbage allowance offered to achieve the targeted PGSH. It was assumed that all cows consumed the totality of the concentrate offered. The F : C ratios were 58:42 and 67:33 for the S1 and M1 treatments, respectively. The increase in concentrate proportion in the S1 diet may explain the lower milk fat concentration (Broster et al., Reference Broster, Sutton, Bines, Broster, Smith, Siviter, Johnson, Napper and Schuller1985).
Carryover effect of PGSH in early lactation on subsequent production
One objective of this experiment was to examine the carryover effect of early lactation PGSH, a driver of feed restriction, on subsequent dairy cow performance. Results show that the PGSH imposed during the first 10 weeks of the lactation did not influence subsequent milk yield. The only effect on milk production during P2 was that of the severe (SS and MS cows) or moderate (SM and MM cows) treatment imposed during that period. The absence of a carryover effect on milk yield following feed restriction in early lactation has previously been described in short- (Nielsen et al., Reference Nielsen, Friggens, Larsen, Andersen, Nielsen and Ingvartsen2007) and long-term studies (Friggens et al., Reference Friggens, Emmans, Kyriazakis, Oldham and Lewis1998; Delaby et al., Reference Delaby, Faverdin, Michel, Disenhaus and Peyraud2009). Kennedy et al. (Reference Kennedy, O'Donovan, O'Mara, Murphy and Delaby2007), Roche (Reference Roche2007) and Kay et al. (Reference Kay, Phyn, Rius, Morgan, Grala and Roche2011) reported a carryover effect on milk yield, but its duration was limited (<2 months) partly because the intensity of restriction at pasture remained moderate (PGSH of 3.1 to 5.2 cm).
A possible reason for the recovery of milk synthesis of the S1 animals (SS and SM) following the period of restriction is the reactivation of quiescent mammary secretory alveoli. Vetharaniam et al. (Reference Vetharaniam, Davis, Upsdell, Kolver and Pleasants2003) represented mammary cells as two pools, active and quiescent, and proposed that interconversion between the pools was monitored by various factors, one of which was nutritional status. It is clear from the current results that the milk production potential of restricted animals earlier in lactation was recovered once they were offered an adequate nutrient supply in P2, that is, when PGSH was increased (see Fig. 1). Once animals were no longer restricted in energy input, sufficient nutrients became available to the mammary gland where quiescent alveoli progressively became active again to an activity level comparable to the M1 animals (MS and MM). The examination of P2 cumulative milk production confirms the recovery of milk synthesis as the SM animals actually produced 3.6% more milk over P2 than the MM animals. Delaby et al. (Reference Delaby, Faverdin, Michel, Disenhaus and Peyraud2009) postulated that the imposition of pasture restriction at the beginning of the lactation contributed to the absence of any carryover effect on milk yield.
No significant carryover effect of the early lactation treatment was observed on GDMI or the intake of the digestible OM during P2. However, numerically, the cows previously assigned to S1 had greater digestible OMI (+0.5 kg OM/cow per day) in P2 than the M1 cows. Friggens et al. (Reference Friggens, Emmans, Kyriazakis, Oldham and Lewis1998) suggested that the capacity of adaptation to a different plane of nutrition was not affected by early lactation treatment. The results of the present study concur as the SM and MM cows had very similar intake of digestible OM throughout P2, although the nutrition plane of the SM cows in P1 had been more restrictive than that of MM. The lower digestible OMI on the MS cows can be explained by the constant plane of nutrition imposed throughout P1 and P2 (3.5 v. 3.8 cm), whereas SS, SM and MM cows had a higher plane of nutrition because of increased PGSH from P1 to P2, which resulted in increasing their digestible OMI.
Some carryover effects of the regime applied in early lactation were observed for milk fat and protein concentrations in later lactation. There seems to be no consensus in the literature on the existence (Roche, Reference Roche2007; Delaby et al., Reference Delaby, Faverdin, Michel, Disenhaus and Peyraud2009) or absence (Friggens et al., Reference Friggens, Emmans, Kyriazakis, Oldham and Lewis1998; Kennedy et al., Reference Kennedy, O'Donovan, O'Mara, Murphy and Delaby2007) of carryover effects on milk components. Friggens et al. (Reference Friggens, Brun-Lafleur, Faverdin, Sauvant and Martin2013) reported that there have been varying responses in milk fat and protein concentrations to changes in energy input. Further investigation is required to fully describe the different rules governing the partition of nutrients for milk component synthesis. When the full lactation was examined, the total milk solids production of the M1 animals was 4.7% more than that of the S1 animals. This difference resulted from the difference in production accumulated during P1 as P1 treatment had no influence on subsequent production during P2, but the loss of milk solids during P1 was not recovered by the end of the lactation.
Cows underfed in early lactation regained more BW in later lactation and had greater end BCS when compared with the M1 animals. These findings are consistent with those of Delaby et al. (Reference Delaby, Faverdin, Michel, Disenhaus and Peyraud2009) and Friggens et al. (Reference Friggens, Brun-Lafleur, Faverdin, Sauvant and Martin2013) who reported that the phenomenon of nutrient partitioning changes throughout lactation. Cows in early lactation partition nutrients towards the mammary gland and mobilise animal body reserves. As lactation progresses, cows progressively increase the partitioning of energy towards body reserves rather than milk (Koenen et al., Reference Koenen, Veerkamp, Dobbelaar and De Jong2001). The current results suggest that once PGSH was increased in P2, more herbage was made available to dairy cows who adjusted milk yield accordingly to changes in OMI. The S1 animals particularly, made use of the additional nutrients to increase milk synthesis as well as recovering body condition.
Grazing management during mid-season to optimise animal performance
The inter-relationship between the grazing ruminant and pasture is a dynamic, two-way process (Van Vuuren and Chilibroste, Reference Van Vuuren and Chilibroste2011). The plant morphological and qualitative aspects influence pasture intake by the ruminant, this process in turn modifies the remaining plants and their subsequent production and fate. Laxly grazed swards are often characterised by a decline in sward quality throughout the grazing season (Peyraud and Delagarde, Reference Peyraud and Delagarde2013) as a result of increased stem and senescent material at the expense of leaf concentration within the sward (Michell and Fulkerson, Reference Michell and Fulkerson1987; Stakelum and Dillon, Reference Stakelum and Dillon2007). This can have negative effects on herbage intake and subsequent milk production (Stakelum and Dillon, Reference Stakelum and Dillon1991), which is mostly attributed to the decline in grass OMD because of a reduced proportion of digestible leaf material within the sward. Peyraud and Delagarde (Reference Peyraud and Delagarde2013) reported a loss of 1 kg/day in milk yield with each percentage decline in sward OMD. Increasing PGSH from 3.8 to 4.8 cm in the current study did not lead to any decrease in OMD in contrast to previous studies, undoubtedly because 4.8 cm remains a moderate PGSH when compared with the lax grazing practices previously described in the literature (Stakelum and Dillon, Reference Stakelum and Dillon1991; Delaby et al., Reference Delaby, Foucher, Michel and Peyraud2003). By removing a larger quantity of good quality herbage (+11% digestible OMI eaten), the SM and MM animals were able to increase grass OMI (Wales et al., Reference Wales, Doyle, Stockdale and Dellow1999) and increase milk and milk solids yields accordingly (Maher et al., Reference Maher, Stakelum and Rath2003). The difference in effective DHA resulting from the PGSH imposed was greater than the actual difference in herbage DMI. This was expected because DHA was calculated above 3.5 cm and SM and MM animals only defoliated swards to 4.8 cm. The milk response to PGSH equated to 1.2 kg milk per extra cm in PGSH, which is 17% greater than the response found by McEvoy et al. (Reference McEvoy, Kennedy, Murphy, Boland, Delaby and O'Donovan2008) with similar type of cows grazing to between 4.8 and 5.6 cm. The results of the current study emphasise the benefits of grazing to a moderate PGSH such as between 4.5 and 5.0 cm from mid-season onwards to maintain high per cow performance while maintaining high sward utilisation.
Conclusions
PGSH was the driver of grazing severity in this experiment. Owing to variations in HM, DHA and area per cow fluctuated during the experiment as a result of the PGSH imposed. This experiment demonstrated that imposing a very severe PGSH such as 2.7 cm during the first 10 weeks of the lactation reduced milk yield by 11% when compared with cows grazing to 3.5 cm, and also resulted in significant BW losses over this period. Following the period of restriction, there was no carryover effect of early lactation PGSH on subsequent lactation milk and milk solids yields. The findings of this experiment acknowledge that cows restricted to graze to 2.7 cm in the first two grazing rotations will recover milk production when grass supply becomes more plentiful from April onwards. Although grazing to a severe PGSH in early spring did not significantly reduce cumulative lactation milk yield, it did, however, reduce cumulative lactation milk solids yield. Indeed, the substantial milk solids production lost in early spring was not recovered by the end of the lactation. This finding is critical given the introduction of a milk payment system based on milk solids for some milk suppliers. Following this experiment, a PGSH of 3.5 cm is recommended during the first two grazing rotations to achieve a compromise between animal production performance and grass utilisation. PGSH should be increased above 4.5 cm from mid-April onwards to allow an adequate expression of the cow's potential for milk production.
Acknowledgements
The authors wish to thank F. Coughlan, N. Galvin, M. Feeney and J.P. Murphy for their technical assistance and all the staff of Moorepark research farm for their care of the animals and assistance with measurements during the experiment.