The 2008 U.S. House elections mark the first time since 1994 that the Democrats will seek to retain a majority. With the political climate favoring Democrats this year, it seems almost certain that the party will retain control, and will likely increase its share of seats. In five national polls taken in June of this year, Democrats enjoyed on average a 13-point advantage in the generic congressional ballot; as Bafumi, Erikson, and Wlezien (Reference Bafumi, Erikson and Wlezien2007) point out, these early polls, suitably adjusted, are good predictors of the November vote.Footnote 1 As of late July, bettors at intrade.com put the probability of the Democrats retaining a majority at about 95% (Intrade.com 2008). Elsewhere in this symposium, Klarner (Reference Klarner2008) predicts an 11-seat gain for the Democrats, while Lockerbie (Reference Lockerbie2008) forecasts a 25-seat pickup.
In this paper we document how the electoral playing field has shifted from a Republican advantage between 1996 and 2004 to a Democratic tilt today. In an earlier article (Kastellec, Gelman, and Chandler Reference Kastellec, Gelman and Chandler2008), we predicted the seats-votes curve in the 2006 election, showing how the Democrats faced an uphill battle in their effort to take control of the House and, their victory notwithstanding, ended up winning a lower percentage of seats than their average district vote nationwide. We follow up on this analysis by using the same method to predict the seats-votes curve in 2008. Due to the shift in incumbency advantage from the Republicans to the Democrats, compounded by a greater number of retirements among Republican members, we show that the Democrats now enjoy a partisan bias, and can expect to win more seats than votes for the first time since 1992.Footnote 2 While this bias is not as large as the advantage the Republicans held in 2006, it will likely help the Democrats increase their share of seats.
The 2008 Electoral Landscape
The 2006 elections marked only the second time since 1954 that control of the House switched from one party to the other. In the six elections from 1996 to 2004, the Democrats obtained a greater share of the average district vote than Republicans in all but one election.Footnote 3 However, they were not able to overcome the Republicans' built-in advantage to obtain a majority of seats. The reasons for this advantage could be found largely in the difference between districts controlled by the two parties prior to the 2006 elections; some of this difference was due to geographic factors and favorable redistricting, and some to the Republicans' incumbency advantage. In 2006, the Democrats finally obtained a large enough share of the average district vote to overcome the partisan bias that the Republicans enjoyed and gain control of the House, winning 233 seats.Footnote 4
The shift in control of the House has meant a concomitant switch in incumbency advantage from the Republicans to the Democrats. As a result, even if every member serving at the beginning of the 110th Congress in 2007 were running for reelection, the Democrats would be in a vastly improved electoral position compared to 2006. Events in the last two years have benefited the Democrats even further. In three districts where Republican members resigned from their seats, Democratic challengers were able to win runoff elections, bringing the current seat total to 236.Footnote 5 More dramatically, 30 Republicans have either resigned or announced that they will not seek reelection in 2008, compared to only eight Democrats, meaning the former will have to defend many more open seats.Footnote 6
This imbalance in retirements, coupled with the Democrats' gains in these runoff elections, reflects the broad dissatisfaction with the Republican Party currently held by the American public, due in large part to economic distress and the war in Iraq. While this disfavor is most clearly seen in President Bush's low approval ratings, it has also extended to House Republicans. Following the Democratic candidate's victory in a Mississippi special election in May, Tom Davis, a Republican member from Virginia and former head of the Republican National Congressional Committee, said, “The political atmosphere facing House Republicans this November is the worst since Watergate and is far more toxic than it was in 2006” (Nagourney and Hulse Reference Nagourney and Hulse2008). It is clear that the Republicans face an uphill fight in 2008.
Predicting the Seats-Votes Curve
We seek to quantify how much an advantage the Democratic Party is likely to enjoy by estimating the seats-votes curve for the 2008 elections. In the interests of space, we refer readersto our earlier article for a thorough description of how we estimate the seats-votes curve for a given election year (Kastellec, Gelman, and Chandler Reference Kastellec, Gelman and Chandler2008). Our goal is not to predict the national vote (we leave this to national forecasts and polls), but to predict the number of seats a party will hold given its average district vote in the elections. In brief, we incorporate district-level information, such as incumbency status and the vote percentage in the previous election, to generate a prediction of the number of seats the Democrats or Republicans can expect to win across a range of possible national swings in the average district vote.Footnote 7 As we demonstrated, the method was generally successful in predicting the actual translation between votes and seats in the 19 non-redistricting election years (those not ending in “2”) from 1958 to 2004. And in 2006, the seats-votes curve we estimated predicted that the Democrats would win 231 seats based on their actual average district vote of 54.9%, just two short of the 233 they actually won.
As noted above, the shift in party control of the House now means that the Democrats enjoy an overall incumbency advantage. This advantage will be compounded by the imbalance in retirements, which has important implications for both the parties' expected vote shares and the relationship between seats and votes. For every Republican incumbent who retires, we can expect the Democratic vote share to increase by an estimated 8% in that district.Footnote 8 Thus, assuming 30 Republicans retire (a total equal to 7% of all House seats), then the Democrats' overall vote share will increase by an estimated 0.56%—not a trivial amount.Footnote 9
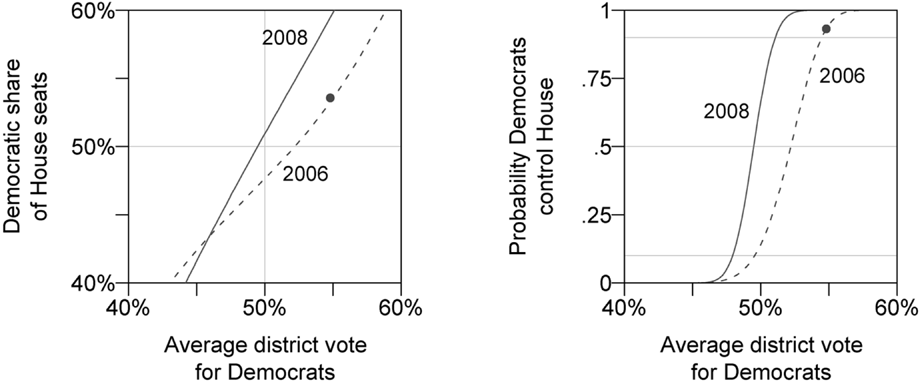
Figure 1 presents the estimated seats-votes curve for 2008, along with the predicted probability that the Democrats control the House based on their average district vote. For comparison, we reproduce our estimates from 2006. The curves reveal that the electoral playing field has shifted significantly to the Democrats, who should benefit from a slight partisan bias in 2008. We estimate that if the Democrats win 50% of the average district vote, or about 5% less than they did in 2006, they will win about 51.4% of seats (or 224).
Estimated Seats-Votes Curve
Note: (1) Predicted seats-votes curve for 2006 (dotted line) and 2008 (solid line); the point depicts the actual average district vote for Democrats (54.9%) in 2006 and their share of House seats. (2) The predicted probability the Democrats would or will control the House given their average district vote in 2006 (dotted line) and 2008 (solid line), respectively. Light lines are references for 10%, 50%, and 90% probabilities.

This partisan bias is not as large as what the Republicans enjoyed in 2006. In that election, we estimated that the Democrats would win only 48% of the seats if they won 50% of the average district vote, and that they needed to win 52% of the vote just to have a 50% chance of winning a majority. In actuality, the Democrats won 54.9% of the average district vote but only 53.6% of the seats.
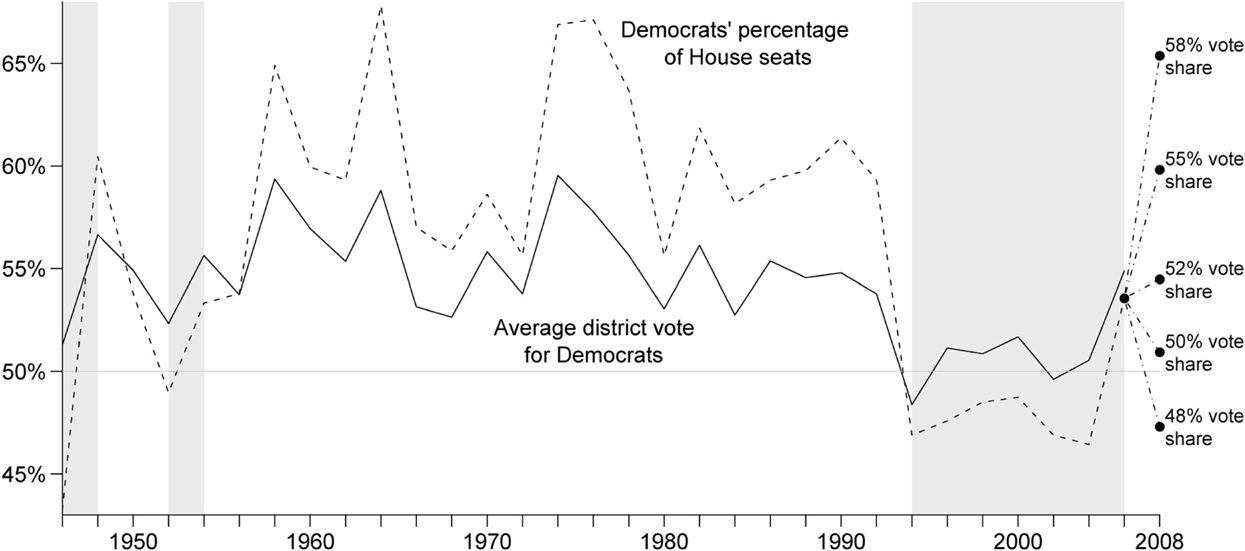
The electoral terrain is more favorable to the Democrats in 2008. Figure 2 places this year's election in historical perspective, depicting the average district vote for Democrats as well as their share of House seats from 1946 to 2006. The Democrats enjoyed a large partisan bias during their 40-year reign over the House. The bias switched to the Republicans following their victory in 1994, and they enjoyed that advantage leading up to the 2006 elections. The dotted lines extending from the 2006 results depict our estimates of the seats the Democrats would win corresponding to five potential aggregate vote shares for the party: 48%, 50%, 52%, 55%, and 58%. For the latter four possibilities, the Democrats would win many more seats than votes, a return to the pattern seen during the 1970s and 1980s and a stark reversal from their electoral fortunes since 1994.
Average District Vote versus Percentage of House Seats for Democrats, 1946–2006, plus 2008 Projections of Democratic Seats Given Votes
Note: The solid black line depicts the average district vote for Democrats in each House election from 1946 to 2006. The dotted black line depicts the Democrats' share of House seats in the same period. The gray line is a reference for 50% of the vote. Shaded areas represent periods of Republican control. The five dotted lines at the end of the figure depict the projected number of seats the Democrats would win, if they received the average district vote given by the label next to each line. For instance, if they win 58% of the average district vote, we estimate that they will win approximately 66% of seats in the House.

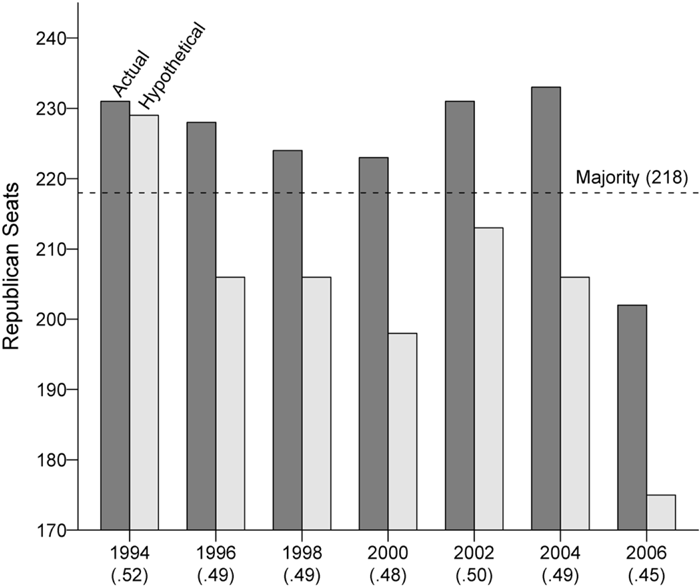
Another way to quantify this change is to predict how many seats the Republicans would have won in the elections from 1994 to the 2006 if the 2008 seats-votes curve had been in effect for those elections. That is, how many seats would the Republicans have obtained if their average district vote was translated into seats based on our estimate of the relationship between seats and votes in 2008? Figure 3 presents this counterfactual: the darker bars depict the actual seats the Republicans won, while the lighter bars depict the hypothetical number of seats they would have won under the estimated 2008 seats-votes curve (the numbers under each year show their average district vote from that year). As is readily apparent, except for 1994, the Republican's majority would have been a minority, and they would have obtained, on average, an estimated 20 fewer seats in the 1996–2004 period.
Actual versus Hypothetical Republican Results, 1994–2006
Note: The darker bars depict the actual seats the Republicans won, while the lighter bars depict the hypothetical number of seats they would have won under the 2008 estimated seats-votes curve. The numbers under each year show their average district vote in a given year. The horizontal dotted line depicts the number of seats (218) needed for a majority. The disagreement between actual and hypothetical does not represent a failure of our model but rather indicates changes in the seats-votes curve from election to election.

Conclusion
Following up on our analysis of the 2006 election, which saw the Democrats overcome a partisan bias in favor of the Republicans to gain a majority of House seats, we predicted the seats-votes curve for the 2008 elections. Our analysis illustrates how the shift in incumbency advantage to the Democrats, coupled with a large number of retirements on the Republican side, has shifted the electoral landscape in favor of the Democrats. While their advantage will likely not be as large as that held by the Republicans in 2006, this shift combined with favorable political conditions now means that the Democrats will likely pick up House seats this November and also will likely win more seats than votes for the first time since 1992.