


1. Introduction
Snow transport by the wind is one of the crucial processes in the seasonal build-up of the snow cover and can be a major factor in the assessment of avalanche risk. Thus, a better understanding of the complex physical processes associated with this phenomenon would be extremely valuable for the improvement of avalanche forecasting. Although great advances have been made in recent decades in the understanding of snow transport by the wind, many questions still remain about the effect of topography on this process. In the last few years, a number of snowdrift models have been developed that take into consideration topographic effects (Reference UematsuUematsu, 1993; Reference Listen and SturmListon and Sturm, 1998; Reference Naaim, Naaim-Bouvet and MartinezNaaim and others, 1998; Reference GauerGauer, 1999) or calculate snow deposition around obstacles (Reference SundsboSundsbo, 1998). To obtain reasonable results, however, requires much computational time, and even then the mass-balance calculation shows significant deficiencies compared with snow-redistribution measurements. For a mountain ridge, the main deviations of the simulated from the experimental results appear on the leeward slopes, which shows that the modelling of the turbulent eddies and the associated snow deposition still requires considerable improvement. Another important requirement for reproducing fine-scale snow-height patterns is a high spatial resolution of the simulated topography, since the wind field close to the surface is strongly influenced by local orographic features.
Snowdrift is usually modelled by distinguishing between grains being transported in either saltation or suspension. For the saltation layer, the mass flux can be modelled by either a half-empirical description (e.g. Reference Pomeroy and GrayPomeroy and Gray, 1990), or a physically based model that takes into account interconnected processes such as aerodynamic entrainment, particle-wind feedback and splash function (e.g. Reference McEwan and WillettsMcEwan and Willetts, 1991; Reference Shao and LiShao and Li, 1999). For neither option is a mass-flux model available at present that explicitly takes into account slope effects. For particle transport in suspension, an equation for the conservation of moisture needs to be solved in combination with the Navier-Stokes equations for the turbulent air flow. To improve modelling of the suspended transport, more research will need to be done into issues such as the influence of grain-size separation, buoyancy effects and turbulence damping. Including these effects in the existing numerical models, however, would increase the computational time substantially, and therefore does not seem feasible at present.
Although the development of exact and reliable drift and deposition models is very important for obtaining a better insight into the physical processes causing the snow-loading of avalanche slopes, models with low computational expenses are required for avalanche warning. Snowdrift makes a major contribution to the assessment of avalanche danger, and crucial for this purpose, even more so than the exact snow distribution, is the overall snow mass that is transported from a windward onto a leeward slope. In this paper, we present a one-dimensional numerical model which concentrates on this problem for an idealized topography and provides a reliable estimation of the additional snow-loading on a leeward (avalanche) slope due to snowdrift. It is designed to provide for the avalanche warning service an index describing the influence of snowdrift. Unlike a three-dimensional model, this one-dimensional approach can be implemented in the operational snow-cover model, SNOWPACK. The results are verified by measurements of several snowdrift episodes at the experimental snowdrift site Gaudergrat, in the Parsenn area, of the Swiss Federal Institute for Snow and Avalanche Research.
2. Theoretical Concept
We consider an idealized mountain ridge, as shown in Figure 1, where the wind blows perpendicular to the crest line. In case of strong winds and neutral stability the airflow on the luff is accelerated, the so-called speed-up of the wind, and in the lee there is boundary-layer separation, creating turbulent eddies. This is a common situation in high-Alpine terrain, and from the described wind field many typical features of the snow distribution can be explained. Whereas the speed-up of the wind causes snow erosion on the windward slope, increased deposition occurs on the leeward side. This is caused not only by the drift of snow coming from the windward slope, but also by the tendency of precipitation to accumulate on the leeward slope, i.e. snow from the precipitation may be transported over the ridge before reaching the ground. Furthermore, due to the existence of turbulent eddies in the lee, the snow is deposited in wave-like patterns, with the formation of cornices at the crest line. From this general structure of the wind field, we have developed a one-dimensional model for calculating the average excessive snow deposition on a leeward slope for an isolated mountain ridge.
Sketch of the typical wind field over an isolated mountain ridge.

2.1. Wind and shear stress profile
Far from the ridge, the wind profile in the lowest part of the neutral atmospheric boundary layer has the usual logarithmic shape
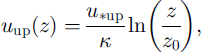
where ump is the upwind friction velocity, K IS the von Karman constant and z0 is the aerodynamic roughness length. At the crest line, the wind speed shows a maximum at a height of zmax above the surface, and the maximum fractional speed-up ratio ΔSmax is estimated by (Reference StullStull, 1988):

where zhill is the height of the ridge, and Wu2 is the horizontal distance between the top and the position where the elevation is half of zhill, as shown in Figure 1.
Next, we adopt an analytical wind profile over the crest line, as proposed by Reference Busch, Gryning, Jensen and TroenBusch and others (1987):

where A is a constant depending on the topographic length scales and the maximum speed-up, k = 2π/L, with L the horizontal length scale of the ridge, u0 is an upstream reference velocity and K is the eddy diffusivity, which we parameterize as KU*Z. This profile is in fact composed of the logarithmic profile and an extra term Au describing the deviation caused by the topography. The deviation consists of two parts: an “outer” layer, where the first term of Au dominates, and an “inner” layer directly above the surface, where the second term is more important. The separation between the two layers is roughly at the height where the maximum speed-up occurs.
For the shear stress profile we use the same distinction between two layers. In the inner layer near the ground, the shear stress is increased compared to its upstream value due to the speed-up. In this region the time-scale of the turbulent eddies is much smaller than the travel time over the hill, and the turbulence is close to local equilibrium (Reference Carruthers, Hunt and BlumenCarruthers and Hunt, 1990). Thus, the increase in shear stress Δτ can be determined by

Furthermore, by definition Δτ IS also given by

for small perturbations. Replacing the eddy viscosity K by KU*Z and combining Equations (4) and (5) shows that ∂(Δunp)/∂z ∼ Δu*/z. This implies that Δu/Δu* ∼ uup/u∗, which results in
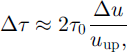
where τ0 IS the upstream value of the shear stress. The increase in shear stress due to speed-up effects is maximum at the surface, and becomes smaller with increasing height.
At the ridge near the surface the shear stress can be determined in this manner, but at greater height, i.e. in the outer layer, this assumption is no longer acceptable, since there the eddy turnover time is greater than the transport time. This implies that advection is the dominant process in this region, and the turbulence originates from the eddies that were created in the uphill region. Thus, the shear stress in the outer layer is dependent on the uphill velocity profile rather than the local velocity profile.
Consequently, a shear stress profile over the ridge is needed which shows a maximum increase in shear stress at the surface given by Equation (6), and approaches the uphill shear stress in the outer layer. We propose a shear stress profile satisfying these conditions:

in which zmax is the height where the maximum speed-up occurs, given by Reference StullStull (1988):

The constant c is set equal to 0.9.
2.2. Snow mass fluxes
The mass fluxes over the ridge are calculated by distinguishing between three different transport modes. The first mode is saltation, which takes place in the shallow layer close to the surface where the particle concentration is highest.
To calculate the snow mass that is transported in the saltation layer, we use a newly developed physically based model. This is based on the same physical principles as the model of Reference GauerGauer (1999), but the determination of the mass flux is different. In particular, individual trajectories are explicitly calculated, which has the advantage that slope effects can be taken into account and no assumption is needed for the concentration profile. Furthermore, the effects of particle-wind feedback and gram properties are taken into account. Here only a rough outline of the model is provided; a full description is in preparation.
In the currently existing view, saltation is regarded as a self-regulating process which develops to equilibrium due to the modification of the wind field by the transfer of particle momentum. Saltation starts when the shear stress at the surface is greater than the threshold shear stress for aerodynamic entrainment. The number of saltating particles increases until the maximum capacity that the airflow can carry is reached. Numerical simulations suggest that this steady state is reached within 1–2 s. In principle, there are three different ways for a snow particle to start moving in saltation: aerodynamic entrainment, rebound from a previous impact or ejection by impact of another grain. The last two mechanisms are referred to as the splash function, and the average number of particles entering saltation resulting from one impact is called the mean replacement capacity. In a saltation layer at equilibrium, there exists a statistical balance between a small probability of a grain not rebounding after impact and the equally small probability of a new grain being dislodged with sufficient energy to start saltating (Reference Anderson, Sorensen and WillettsAnderson and others, 1991)
Within the saltation layer, the flying grains exert a stress on the airflow, the so-called grain-borne shear stress, which is defined as the difference in horizontal momentum between upgoing and downgoing particles at a certain height. At steady state the sum of the gram-borne and fluid (or airborne) shear stresses equals the total shear stress above the saltation layer (Reference McEwan and WillettsMcEwan and Willetts, 1991). For an equilibrium to be maintained, the mean replacement capacity must be unity, and this can be the case only if the airborne shear stress at the surface stays at impact threshold (Reference OwenOwen, 1964). Furthermore, when the vertical coordinate z reaches above the saltation layer, the airborne shear stress must approach the total shear stress. A profile which satisfies these conditions is given by Reference McEwanMcEwan (1993):

where τa(z) is the airborne shear stress, τs is the total shear stress, u*t is the threshold shear velocity, u∗ is the shear velocity and hs is the height of the saltation layer.
The main forces governing the particle trajectories are inertia! force, drag force and gravity. Thus, the equations of motion for a grain moving over a slope with slope angle a are given by


Here ρa and ρρ are the respective densities of air and ice, d is the particle diameter, Ur is the particle speed relative to the airflow, and Cd is the drag coefficient, which is a function of the particle Reynolds number. Furthermore, (’) denotes the material time derivative.
The following approximations and assumptions are made: since our primary interest is the mass flux, only the stationary state of the saltation layer is considered. Furthermore, we take into account only the rebounding of grains, and neglect ejections that may result from an impact, since this process is of relatively minor importance (see above). The wind profile, modified by the saltating particles, is based on Equation (9) and satisfies the no-slip boundary condition. For the particle collision with the surface for a rebounding grain, it is proposed that the energy loss is a material constant, i.e. only dependent on the type of snow. This restitution is modelled by

where vej and vimp are the ejection and impact velocities, and (1 – r) is the percentage of energy that is lost in the collision. The ejection angle is taken to have a fixed value of 30°.
To obtain the mass flux in saltation, a number of successive trajectories are calculated for a rebounding grain until the process becomes stationary. From the average values of the horizontal momentum of upgoing and downgoing particles at the surface and the time between one impact and the next, the average grain-borne shear stress caused by one particle trajectory is known, and this decides the maximum and equilibrium number of grains N that the airflow can carry. When the mean horizontal particle velocity is «mean, the saltating mass flux Q (in kg m–1s–1) is given by

In the suspension layer, which is the second transport mode, the particles are lifted due to atmospheric turbulence, and transported over large distances without contact with the snow surface. The mass flux in suspension Qsusp (in kg m–1 s–1) follows from the integration
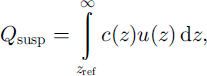
where c(z) is concentration profile (in kg m–3), and the reference height zref is the height of the saltation layer. The wind velocity profile is described by Equation (3). In order to obtain the concentration profile, we assume that the transport mechanism for the suspended particles is a balance between turbulent diffusion and gravitational settling. This balance is described in a one-dimensional diffusion equation:
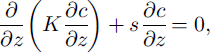
where s is the settling velocity of particles in still air, set equal to 0.4 ms–1 for this study. We replace the eddy diffusivity K again by kut∗z, which is a form of first-order turbulence closure. Integration yields the concentration profile:
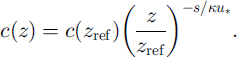
To find the particle concentration at the height of the saltation layer c(zref), we consider the energy balance of the saltation system. At saltation height the wind velocity shows a deviation from the logarithmic profile ΔU(hs), due to the energy that has been transferred to the saltating particles. Thus, the particle concentration cp is given by
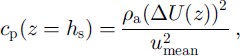
where umean is the mean particle velocity.
The third mode of snow transport is the preferential deposition of the precipitation, for which the mass flux also results from the integration in Equation (14). The snow concentration can be obtained from snowfall measurements, and the wind profile is again given by Equation (3). The total snow mass flux that is transported over the ridge at a certain time is the sum of the fluxes in the three transport modes.
3. Field Measurements
Over the last few years, snow transport over the experimental site Gaudergrat has been measured for several intensive snowdrift periods. The Gaudergrat ridge, located 2 km north of Weissfluhjoch/Davos, has slope angles of 28–38° and may be regarded as typical of Alpine topography. The main wind direction during strong precipitation periods is northwest, which is perpendicular to the crest line. The snow distribution over the ridge is measured before and after the snowfall and -drift period, by snow-depth soundings along 5–8 equidistant lines perpendicular to the crest. The measurements cover an area of approximately 42–200 m for the presented results from 1997, and an area of approximately 56–200 m for the drift episodes in 1999. The distance between the lines was roughly 8 m, and along every line the snow height was measured every 4 m. During the drift events, wind measurements were taken from five masts, located far upwind and downwind from the ridge, on the windward and the leeward slope, and on the crest. Here the wind speed and wind direction were measured every 10 s at three heights 1–6 m above the snow surface for every mast. At the upwind mast, the snow height was measured every 30 min in order to determine the height of the sensors over snow. Furthermore, measurements of the precipitation rate were made every hour, and snow profiles were made on the windward and leeward slopes before and after each snowdrift period. In this manner a dataset concerning snowdrift over topography was obtained, which is unique for its completeness and enables a sound verification of the presented and other snowdrift models. A complete description of the site and the measurements can be found in Reference GauerGauer (1999).
4. Numerical Model
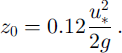
To determine the snow mass fluxes numerically, the wind and precipitation measurements are used as input data for the model. The wind measurements are taken from the upwind mast, where the wind profile may be assumed to be logarithmic. From these data, the upwind friction velocity and the roughness length are iteratively determined using Equation (1) together with a parameterization for the roughness length (Reference Listen and SturmListon and Sturm, 1998),
These results are averaged for a chosen time interval, set at 10 min for the present study, and used as the input data for the further calculations. The wind profile over the ridge is constructed using Equations (2) and (3), and the shear stress profile from Equations (7) and (8).
Subsequently, the mass flux in saltation is computed using the model as described in section 2.2. The shear velocity u, at the ridge in Equation (9) is determined from the shear stress profile from Equation (7). No slope effects are taken into account in our calculations. The initial horizontal velocity up of a saltating grain is assumed to be equal to 0.5«* (Reference Shao and LiShao and Li, 1999), and trajectories are repeatedly computed until stationary conditions are reached or for a maximum of 40 trajectories. The height of the saltation layer hs, needed for Equation (9), is the height of the stationary trajectories. The internal time-step for calculating the trajectories is 0.001 s. The particle concentration at saltation height (Equation (17)) is the lower boundary condition for the concentration profile of drifting snow in suspension (Equation (16)).
The mass fluxes in suspension are calculated separately for drift and precipitation. The concentration profile of drifting snow is obtained from Equation (16), in which the shear velocity u* is dependent on height according to Equation (7). The average snow concentration in the air due to precipitation is determined from the precipitation measurements, which are made in mm IT1 (water equivalent). For the model, this concentration is taken to be independent of height. The integration in Equation (14) is carried out from the height of the saltation layer to a maximum height which is dependent on the maximum wind velocity and the settling velocity, since only that part of the drift and precipitation should be considered that is actually deposited in the lee. The computation is carried out in 1 cm high steps.
The threshold shear velocity for the onset of erosion is set to a fixed value of 0.22 m s–1, a value which is normal for newly fallen snow. This threshold only applies to snow transport in saltation and suspension; its value does not need to be exceeded for preferential deposition of precipitation. It should also be emphasized that only the deviation of the wind profile, i.e. the non-logarithmic part, contributes to the increased snow deposition on the leeward slope, since a logarithmic wind by itself has no net effect.
5. Results
Table 1 shows the results from the measurements and the numerical simulations of the snow transport over the Gaudergrat ridge for five snowfall and -drift episodes in 1997 and 1999. The measurements from 1997 are also reported in Reference GauerGauer (1999). The overall excessive mass is given, as well as the average extra snow height in the lee compared to the flat area, which gives a more intuitive overview. The measured mass balance was calculated from the new snow-height distribution in the leeward area and the density of the upper snow layer as measured in the snow profiles. The last two columns of Table 1 indicate that there is good agreement between the simulated and measured results.
Comparison of simulated and measured mass balance and new -snow height for four snowdrift episodes

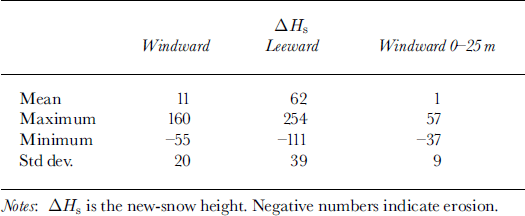
The values for the average extra new-snow height must be interpreted with care. In Figure 2 a plan view is shown of the new-snow height distributed over the total area, as measured after the drift episode of 26–31 January 1999. InTable 2 some values are shown that give an impression of how the new snow is deposited over the slope. Because of the turbulent eddies in the lee, it is expected that the new snow is less evenly distributed on the leeward than on the windward slope. The measurements confirm this expectation; for example, the standard deviation of the snow-height difference is significantly greater on the leeward slope. Furthermore, Table 2 indicates that there are great variations in new-snow height, especially in the lee. Here, new-snow heights were found of up to four times the average value. On the windward slope the area with a distance up to 25 m from the crest shows evenly distributed snow erosion. The new-snow height is on average only 1cm, which shows that practically all newly deposited snow has been eroded in this area. From this analysis, and Figure 2, it may be concluded that the measured snow distribution is in agreement with the wind field as described in section 2. For a computed three-dimensional counterpart of Figure 2 we refer to Reference Lehning, Doorschot, Raderschall, Bartelt, Hjorth-Hansen, Holand, Loset and NoremLehning and others (2000a).
Topography contour lines oft the Gaudergrat ridge and new-snow height distribution as measured for the snowdrift episode of 26–31 January 1999. dH denotes the new-snow height. Negative numbers of dH indicate erosion.

Some statistics on the new-snow distribution (cm) on the Gaudergrat for the snowdrift episode of January 1999
An impression of the wind velocity and shear stress profile as used in the simulations is given in Figure 3. These profiles have been made using the average wind velocity as measured for the drift event of January 1999. The wind speed has a bulked profile, with a maximum wind speed at approximately 2.5 m height. The shear stress is at a maximum just above the surface, and decreases with height, approaching the upstream value. Note that the shear stress at the wind maximum does not go to zero, as would have occurred had the shear stress been computed from the local velocity gradient. This is because of the advection of turbulence from uphill, as was explained in section 2.1.
Example of the wind profile and shear stress profile over the ridge, as used in the simulations. The profiles have been drawn according to Equations (3) and (7), in which the measured uphill wind speed has been used, averaged over the snowdrift episode of January 1999.

Furthermore, we have used the model to obtain an overview of the effect of wind velocity on the mass transport over the ridge. Therefore, simulations were done with the wind speed of the snowdrift event in January 1999 multiplied with different factors, varying between 0.5 and 1.5. All other input parameters were left constant. In Figure 4 the ratio of the new-snow height on the leeward slope and the new-snow height in the flat area is shown as a function of the average wind speed. It can be seen that the wind velocity has a nonlinear effect on the mass transport. The increase of mass transport with wind speed is monotonically decreasing, and effects of saturation are occurring at higher average wind velocities.
Ratio of the simulated new-snow height on the leeward slope to the new-snow height in flat area as a function of the wind speed. The simulations were carried out with relative changes in the wind speed from the drift period January 1999, leaving all other input parameters the same.

6. Discussion and Conclusions
In this paper we presented a new snowdrift model over idealized topography which has been shown to provide a reliable estimation of snow mass transport. A newly developed saltation model was combined with an analytical wind profile over a ridge, in which speed-up effects were taken into account. The model is in this respect a considerable improvement on the operational snowdrift index (Reference Lehning, Doorschot and BarteltLehning and others, 2000b). We therefore plan to implement it in the Swiss operational network of snow and wind stations. Advective effects of turbulence, which are known to have a significant influence over complex terrain, were included via a parameterization of the turbulent shear stress profile. The advection of snow over topography was only taken into account through this factor, rather than explicitly calculated. Since the snow concentration is known to increase when snow is transported in suspension from flat terrain to the mountain crest, a slight underestimation of the mass transport may be expected from this simplification. The results of the simulations basically confirm this expectation. Generally, simulated and measured results show good agreement.
Although future development of snowdrift modelling will move towards more sophisticated modelling of high-resolution snow distribution over topography (Reference Lehning, Doorschot and BarteltLehning and others, 2000b), the presented model will remain a very valuable tool for assessing the influence of snowdrift on avalanche danger, especially when there is little information about input parameters, or low computational effort is required. A modified version of the presented model has already been used successfully to analyze snowdrift influence on the extreme avalanche situation of February 1999 (SLF, 2000).
Acknowledgements
The authors wish to thank W. Ammann, T. Russi and P. Bartelt for supporting and motivating this work. We also thank C. Fierz, B. Gauderon, P. Gauer, F Herzog, M. Hiller, D. Issler, R. Wetter, M. Zimmerli and C. Zuger for contributing to the construction of the SLF experimental site Gaudergrat and to the measurements. The project is funded by the Swiss National Science Foundation; the Swiss Federal Institute for Snow and Avalanche Research, as part of the Swiss Federal Institute for Forest, Snow and Landscape Research; and the Swiss Federal Institute of Technology.



