There is consistent evidence that the interplay between person-level and social-relational contexts are associated with adolescent alcohol and drug use (Hentges, Shaw, & Wang, Reference Hentges, Shaw and Wang2018; Hicks, South, DiRago, Iacono, & McGue, Reference Hicks, South, DiRago, Iacono and McGue2009; Rioux, Castellanos-Ryan, Parent, & Seguin, Reference Rioux, Castellanos-Ryan, Parent and Seguin2016), but less research has evaluated this in relation to adult substance use problems. This gap remains critical to address given that substance use disorders are most prevalent in early adulthood (i.e., ages 18–25, Christie et al., Reference Christie, Burke, Regier, Rae, Boyd and Locke1988; Meier et al., Reference Meier, Caspi, Houts, Slutske, Harrington, Jackson and Moffitt2013; Substance Abuse and Mental Health Services Administration [SAMSHA], 2017) and the consequences of recurrent substance use problems are particularly problematic in terms of social, psychological, and physical health (Centers for Disease and Control Prevnetion [CDC], 2017; Foster, Hicks, Iacono, & McGue, Reference Foster, Hicks, Iacono and McGue2014; Greig, Baker, Lewin, Webster, & Carr, Reference Greig, Baker, Lewin, Webster and Carr2006; Hicks, Iacono, & McGue, Reference Hicks, Iacono and McGue2010; Huang, Lanza, & Anglin, Reference Huang, Lanza and Anglin2013; McGue, Iacono, Legrand, Malone, & Elkins, Reference McGue, Iacono, Legrand, Malone and Elkins2001; Meier et al., Reference Meier, Caspi, Ambler, Harrington, Houts, Keefe and Moffitt2012). Therefore, we sought to test whether similar etiological processes identified for alcohol and substance use problems in adolescence are also relevant to alcohol use problems in early adulthood—the period of peak prevalence—as well as in relation to late young adult alcohol use problems, when rates decline. Consistent findings across adolescence and young adulthood would be evidence for general etiological processes that contribute to substance use problems, whereas a differential pattern across ages would highlight the importance of the developmental context as it relates to the etiology of substance use problems.
Theoretical Frameworks
Guided by theories that account for the interplay between aspects of person-level characteristics (e.g., biology) and their social context (Bronfenbrenner & Ceci, Reference Bronfenbrenner and Ceci1994; Lerner, Johnson, & Buckingham, Reference Lerner, Johnson and Buckingham2015; Sameroff, Reference Sameroff2010), a diathesis stress model refers to the notion that an individual's dispositional risk or vulnerability for psychopathology is activated under conditions of environmental stress (Goforth, Pham, & Carlson, Reference Goforth, Pham, Carlson, Goldstein and Naglieri2011; Zuckerman, Reference Zuckerman and Zuckerman1999). Consistent with this notion, several twin studies have shown that the genetic influences on adolescent alcohol and drug use are amplified in the context of poor parent–child relationship quality, low parental monitoring, greater antisocial peer affiliation, and greater stressful life events (Dick, Reference Dick2011; Dick et al., Reference Dick, Pagan, Viken, Purcell, Kaprio, Pulkkinen and Rose2007a; Dick et al., Reference Dick, Viken, Purcell, Kaprio, Pulkkinen and Rose2007b; Harden, Hill, Turkheimer, & Emery, Reference Harden, Hill, Turkheimer and Emery2008; Hicks et al., Reference Hicks, South, DiRago, Iacono and McGue2009; Reference Hicks, Johnson, Durbin, Blonigen, Iacono and McGue2013, Reference Hicks, Johnson, Durbin, Blonigen, Iacono and McGue2014). Further, these genetic influences appear to be suppressed in the context of supportive relationships and less stress. This supports the notion that improving adolescents’ social relationships may have profound effects for those most at risk (Samek & Hicks, Reference Samek and Hicks2014).
In addition to twin and adoption studies where risk is defined genetically, other studies have examined the link between temperament or personality as a measure of person-level risk for adolescent substance use and related externalizing problems in conjunction with analyses of person–environment interplay (Hentges et al., Reference Hentges, Shaw and Wang2018; Rioux et al., Reference Rioux, Castellanos-Ryan, Parent and Seguin2016, Reference Rioux, Castellanos-Ryan, Parent, Vitaro and Sequin2018), and these studies have garnered some support for a diathesis stress model. For example, Rioux et al. (Reference Rioux, Castellanos-Ryan, Parent, Vitaro and Sequin2018) found that low parental knowledge was associated with greater adolescent substance use, but only for those high in impulsivity. In fact, in their comprehensive review of 14 studies, Rioux and colleagues (Reference Rioux, Castellanos-Ryan, Parent and Seguin2016) found consistent evidence that adolescents with “adventurous” personality traits in adolescence (e.g., those high in impulsivity and disinhibition, lower in effortful control) had greater substance use under conditions of adverse family experiences in adolescence. These results generally support a diathesis stress model of adolescent substance use.
On the other hand, Rioux et al. (Reference Rioux, Castellanos-Ryan, Parent and Seguin2016) also found support for a differential susceptibility hypothesis in relation to adolescent substance use problems. A differential susceptibility hypothesis (Belsky & Pluess, Reference Belsky and Pluess2009) refers to the notion that those who are most vulnerable to psychopathology will be more likely to have problems under conditions of environmental stress, but they are more likely to flourish in enriched environments compared with those least vulnerable to psychopathology. This is because they are more sensitive to their environments in general. Rioux et al. (Reference Rioux, Castellanos-Ryan, Parent, Vitaro and Sequin2018) argued that they showed support for differential susceptibility involving sensation seeking but not impulsivity as a measure of person-level risk in relation to parental knowledge and adolescent substance use at age 15. That is, they found that those high in sensation seeking were more likely to use substances under adverse conditions (low parent knowledge) and less likely to use under optimal conditions (high parent knowledge) compared with those with low sensation seeking, where the level of parent knowledge did not seem to matter. Altogether, this research suggests that those at high person-level risk appear to be influenced by adverse as well as potentially enriching environments in childhood and adolescence.
Consideration of Selection Effects
It is also important to consider how person-level characteristics influence selection into key social and relationship contexts. Particularly, by early late adolescence and young adulthood, people gain more freedom with respect to selecting environments that better align with their genetically-influenced personality traits and interests (Scarr & McCartney, Reference Scarr and McCartney1983). For example, a disinhibited person likely seeks friends that are similarly disinhibited or share an interest in alcohol and drug use. Indeed, several studies have linked disinhibited personality traits to exposure to high-risk environmental contexts, such as antisocial peer groups (Hicks, Johnson, Durbin, Blonigen, Iacono, & McGue, Reference Hicks, Johnson, Durbin, Blonigen, Iacono and McGue2013). The salience of these environmental contexts and their associations with problematic outcomes change with development, such that parent–child and peer relationships are particularly important in childhood and adolescence (Hawkins, Catalano, & Miller, Reference Hawkins, Catalano and Miller1992), while romantic relationships become more increasingly important in young adulthood (Meacham, Bailey, Hill, Epstein, & Hawkins, Reference Meacham, Bailey, Hill, Epstein and Hawkins2013; Staff et al., Reference Staff, Schulenberg, Maslowsky, Bachman, O'Malley, Maggs and Johnston2010).
Following this, Robins, Caspi, and Moffitt (Reference Robins, Caspi and Moffitt2002) showed that negative emotionality at age 18 predicted lower romantic relationship quality and greater romantic relationship conflict and abuse at age 26. These findings align with the corresponsive principle of personality (Caspi, Roberts, & Shiner, Reference Caspi, Roberts and Shiner2005), which posits that personality traits influence selection into certain social contexts (social selection), and in turn, these contexts have subsequent effects on stabilizing such personality traits (social influence). This theoretical premise complements theories highlighting the transactions between person-level differences and social context (e.g., Bronfenbrenner & Ceci, Reference Bronfenbrenner and Ceci1994; Lerner, Johnson, & Buckingham, Reference Lerner, Johnson and Buckingham2015; Sameroff, Reference Sameroff2010) and suggests that there is a continual codevelopment of personality and social context in young adulthood.
Co-Development between Personality and Substance Use
Personality is an important person-level variable because key traits are related to many consequential health outcomes (Friedman, Kern, & Reynolds, Reference Friedman, Kern and Reynolds2010; Smith, Reference Smith2006; Turiano, Pitzer, Armour, Karlmangla, Ryff, & Mroczek, Reference Turiano, Pitzer, Armour, Karlmangla, Ryff and Mroczek2012). Notably, low constraint and high negative emotionality are consistently associated with substance use problems (Chassin, Flora, & King, Reference Chassin, Flora and King2004; Durbin & Hicks, Reference Durbin and Hicks2014; Hicks, Durbin, Blonigen, Iacono, & McGue, Reference Hicks, Durbin, Blonigen, Iacono and McGue2012; Hicks, Iacono, & McGue, Reference Hicks, Iacono and McGue2011; Samek, Hicks, Durbin, et al., Reference Samek, Hicks, Durbin, Hinnant, Iacono and McGue2018; Sher, Bartholow, & Wood, Reference Sher, Bartholow and Wood2000; Slutske et al., Reference Slutske, Heath, Madden, Bucholz, Statham and Martin2002; Vrieze, Vaidyanathan, Hicks, Iacono, & McGue, Reference Vrieze, Vaidyanathan, Hicks, Iacono and McGue2014; Wills, Vaccaro, & McNamara, Reference Wills, Vaccaro and McNamara1994). Constraint refers to the antithesis of impulsivity, such that those who score high in constraint tend to plan ahead, maintain traditional values, and avoid risk taking and thrilling situations with the potential for physical harm (Tellegen & Waller, Reference Tellegen, Waller, Boyle, Mattews and Saklofske2008). Negative emotionality refers to a tendency to experience negative emotions (e.g., anger, disgust, contempt) particularly in the context of stress (Watson, Clark, & Tellegen, Reference Watson, Clark and Tellegen1988).
It is important to note that even though personality traits tend to be more stable and biologically influenced by late adolescence and early adulthood than during earlier developmental stages (Matteson, McGue, & Iacono, Reference Matteson, McGue and Iacono2013; Roberts & DelVecchio, Reference Roberts and DelVecchio2000), personality can and does change over time. Specifically, there is substantial evidence of normative (i.e., mean-level) change in personality traits consistent with the notion of psychological maturity (i.e., increasing constraint, decreasing negative emotionality) as adolescents transition into young adulthood. For example, Blonigen and colleagues (Reference Blonigen, Carlson, Hicks, Krueger and Iacono2008) showed that, at the individual-level, 41% of participants exhibited a clinically significant (i.e., change of more than two standard errors of measurement in scores) decline in negative emotionality scores and 30% exhibited a clinically significant increase in constraint scores from ages 17 to 24. At the group level, there was a large mean-level decrease in negative emotionality (Cohen's d = .77) and increase in constraint (Cohen's d = .52) scores. This trend in personality maturation corresponds to the reduction in heavy substance use and substance use disorders by the late twenties (SAMSHA, 2017), suggesting that maturation of personality is linked to age-related changes in substance use problems in young adulthood.
There are some studies that have evaluated the codevelopment between personality and health outcomes (Durbin & Hicks, Reference Durbin and Hicks2014; Samek, Hicks, Durbin, Hinnant, Iacono, & McGue, Reference Samek, Hicks, Durbin, Hinnant, Iacono and McGue2018; Weston, Hill, & Jackson, Reference Weston, Hill and Jackson2015). Using the same sample as for the present study, Samek and colleagues (Reference Samek, Iacono, Keyes, Epstein, Bornovalova and McGue2018) examined the prospective associations between key personality traits in relation to AUD symptoms from ages 17 to 29. Results showed that low constraint and high aggressive undercontrol at age 17 were significant predictors of AUD symptoms at age 24. Alcohol use disorder symptoms at age 17 did not significantly predict either personality trait at age 24, suggesting that personality is a vulnerability marker for subsequent AUD in the transition from adolescence to early adulthood. From ages 24 to 29, however, both AUD and these traits predicted one another, supporting either a bidirectional, transactional, or codevelopment effect later on in development or when evaluating smaller time frames. We are expanding on this initial main effects paper by examining romantic relationship experiences in addition to the main effects of personality at this time as well as the interplay between personality and romantic relationship experiences as predictors of concurrent and prospective AUD symptoms.
The Importance of Romantic Relationships
Key romantic relationship characteristics have been shown to correlate with adult substance use problems (Bachman, O'Malley, Schulenberg, Johnston, Bryant, & Merline, Reference Bachman, O'Malley, Schulenberg, Johnston, Bryant and Merline2002; Rhule-Louie & McMahon, Reference Rhule-Louie and McMahon2007; Staff et al., Reference Staff, Schulenberg, Maslowsky, Bachman, O'Malley, Maggs and Johnston2010). Past research has shown that being single rather than married is associated with more heavy drinking (Bachman et al., Reference Bachman, O'Malley, Schulenberg, Johnston, Bryant and Merline2002; Fleming, White, & Catalano, Reference Fleming, White and Catalano2010), AUD (Grant et al., Reference Grant, Goldstein, Saha, Chou, Jung, Zhang and Hasin2015) and other substance use disorders (Scott et al., Reference Scott, Wells, Angermeyer, Brugha, Bromet, Demyttenaere and Kessler2010). Other research has demonstrated that being involved in committed romantic relationships—not just marriage per se—is associated with less alcohol and drug use (Braithwaite, Delevi, & Fincham, Reference Braithwaite, Delevi and Fincham2010; Fleming et al., Reference Fleming, White and Catalano2010).
Although being involved in a romantic relationship is associated with lower risk for alcohol use problems, relationship status alone does not provide insight into the interpersonal processes that may influence alcohol use problems or vice versa. Illustrating the complexity of these associations, Flemming and colleagues (2010) showed that poor romantic relationship quality predicted heavier drinking, but only for those with partners who were seldom or never drunk compared with those who had partners who were often drunk. For those with partners who were often drunk, the likelihood of heavy drinking actually increased for those with better relationship quality.
Further demonstrating support for potential selection effects, Robins, Caspi, and Moffit (Reference Robins, Caspi and Moffitt2002) showed that those high in negative emotionality and low in constraint at age 18 tended to report poorer relationship quality at ages 21 and 26. Additionally, high negative emotionality and low constraint at age 18 was significantly associated with greater declines in romantic relationship quality through age 26. Finally, prior research by Burt and colleagues (Reference Burt, Donnellan, Humbad, Hicks, McGue and Iacono2010) showed clear evidence for selection and socialization effects such that men with high levels of antisocial behavior were less likely to marry; however, those who did marry appeared to desist from antisocial behavior.
There has been limited work evaluating the interplay between personality traits and romantic relationship context in relation to adult outcomes. Yin and colleagues (Reference Yin, Branje, Keijsers and Meeus2015) commented on the dearth of this research in their evaluation of whether adolescent personality type interacted with romantic relationship quality in young adulthood to predict adult delinquency and anxiety. Results showed some support for a diathesis stress model in that the greater the degree of negative interactions with romantic partners, the greater the increase in delinquency for those who were “undercontrolled” relative to “overcontrollers” and “resilients.” In our review of the literature, we found no such study evaluating the interplay between personality traits and romantic relationship context in relation to adolescent or adult alcohol or substance use problems.
Gender Differences
A final gap this study addresses is a thorough exploration of potential gender differences in Personality × Environment interplay as it applies to young adult AUD outcomes. Research has long shown that males are more likely to meet criteria for AUDs than females (Center for Behavioral Health Statistics and Quality [CBHSQ], 2017). There is some evidence that the etiology of externalizing disorders (Hicks et al., Reference Hicks, Blonigen, Kramer, Krueger, Patrick, Iacnono and McGue2007) and related problem behaviors (Samek, Iacono, et al., Reference Samek, Hicks, Keyes, Iacono and McGue2014) varies by gender. For example, Hicks et al. (Reference Hicks, Blonigen, Kramer, Krueger, Patrick, Iacnono and McGue2007) showed that from ages 17 to 24, men had greater increases in their externalizing behavior than women, and these increases were better explained by genetic factors for men than for women. If genetic factors are less relevant for women, it may be that key aspects of their environmental context or social relationships are more relevant to the development of AUD than for men. Following this, there is some evidence that not being married is a more salient risk factor for substance use disorder for women than for men (Scott et al., Reference Scott, Wells, Angermeyer, Brugha, Bromet, Demyttenaere and Kessler2010). Thus, one exploratory question is whether adult romantic relationship context may be more relevant for women than for men.
Study Hypotheses
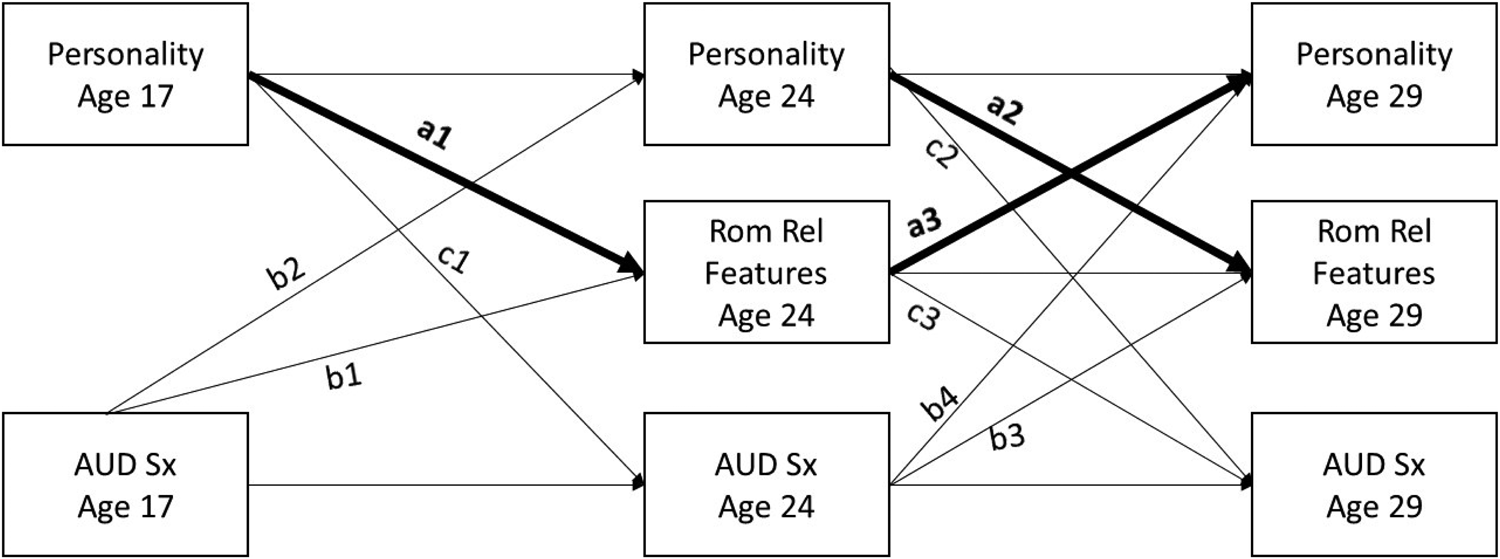
The conceptual model guiding the study hypotheses is shown in Figure 1. The hypotheses that are guided by the corresponsive principle of personality are shown in bolded black. In line with the social selection component of the corresponsive principle of personality (Caspi, Roberts, & Shiner, Reference Caspi, Roberts and Shiner2005), we hypothesized that personality-based risk (low constraint, high negative emotionality) in late adolescence (age 17) and early adulthood (age 24) would be associated with subsequent poorer romantic relationship quality and greater romantic partner alcohol use in young adulthood (ages 24 and 29; paths a1 and a2). We also evaluated the social influence component of the corresponsive principle of personality by evaluating the extent to which romantic relationship features at age 24 predict and reinforce personality-based risk at age 29 (path a3). Taking full advantage of our longitudinal data, we included AUD symptoms at each assessment and evaluated potential “scarring” effects of AUD symptoms at ages 17 and 24 on subsequent personality and romantic relationship features at ages 24 and 29 (paths b1–b4), as well as the extent to which personality-based risk and romantic relationship features at age 24 predicted subsequent AUD symptoms at age 29 (paths c1–c3). Pathways c1–c3 could also represent an extension of the corresponsive principle in that AUD symptoms represent correlated behavioral outcomes tied to earlier and concurrent personality-based risk.
Conceptual model depicting study hypotheses. AUD Sx = Alcohol Use Disorder Symptoms, Rom Rel = Romantic Relationship. Hypotheses aligned with the corresponsive principle of personality are shown in bolded black. Paths labeled a1 and a2 correspond to the social selection component of the corresponsive principle, in that prior personality-based risk would predict subsequent “selection” into key romantic relationship features at ages 24 and 29. The path labeled a3 corresponds to the social influence component of the corresponsive principle, in that romantic relationship features in early adulthood would reinforce and stabilize subsequent personality in later young adulthood. Paths labeled b1–b4 refer to potential “scarring” effects of prior AUD on subsequent romantic relationship features and personality traits. Paths labeled c1–c3 refer to potential “scarring” effects of prior personality and romantic relationship features on subsequent AUD symptoms. Paths a1 and c3 illustrate the hypothesis that romantic relationship features would mediate the prospective associations between personality at age 17 and AUD symptoms at age 29. Paths b1 and c3 illustrate the hypotheses that romantic relationship features would mediate the prospective association between AUD symptoms at age 17 and personality at age 29. Within- and across-time interactions between personality and romantic relationship features were also evaluated, but they are not shown here for clarity of presentation.

We also tested the extent to which features of romantic relationship context at age 24 mediate the prospective associations between personality traits at age 17 and AUD symptoms at age 29 (paths a1 and c3) and, conversely, whether romantic relationship context at age 24 mediate the prospective association between AUD symptoms at age 17 and personality traits at age 29 (paths b1 and c3). We additionally tested whether features of romantic relationship context moderate the concurrent and prospective associations between personality traits and AUD symptoms at ages 24 and 29, and if so, whether such results support a diathesis stress vs. a differential susceptibility model of adult alcohol use problems. We also provided a thorough exploration of potential gender differences in personality–environment interplay as it applies to young adult AUD outcomes.
Method
Participants were members of the Minnesota Twin Family Study, a prospective sample of 2,769 individuals (Iacono, Carlson, Elkins, & McGue, Reference Iacono, Carlson, J., Elkins and McGue1999) comprising two cohorts of same-sex twin pairs. Data collection for the older cohort began when the twins were 17 years old (born between 1972 and 1979), and data collection for the younger cohort began when the twins were 11 years old (born between 1977 and 1984). Both cohorts of twins were reassessed every 3–5 years through age 29, with overlapping assessments at ages 17, 20, 24, and 29 (N = 2,769). Here, we are using data from the age 17, 24, and 29 assessments because personality and romantic relationship features were not assessed at age 20. Retention across cohorts and waves was ≥ 87%. Minnesota Twin Family Study participants are generally representative of the population from which they were sampled (the state of Minnesota) in terms of parent education, occupation, ethnicity, and parent mental health. Consistent with Minnesota demographics in relevant birth years, most participants were of European American ancestry (96%). There is considerable diversity in other aspects of the MTFS, including socioeconomic status. The highest education completed for the majority of parents was a high school diploma or equivalent (62.6% for mothers and 63.5% for fathers); 28.5% of fathers and 25.1% of mothers had earned at least a BA/BS degree. The MTFS also includes families from both rural (40%) and urban (60%) communities as well as comparable numbers of males (48%) and females (52%).
Measures
Personality
Personality was assessed at ages 17, 24, and 29 using the Multidimensional Personality Questionnaire (MPQ; Tellegen & Waller, Reference Tellegen, Waller, Boyle, Mattews and Saklofske2008). The version of the MPQ used in this study is a 198-item self-report survey that assesses 11 primary scales that exhibit a three-factor structure of higher-order personality traits called positive emotionality, negative emotionality, and constraint. Given the volume of literature supporting the association between these traits and substance use problems (reviewed in the Introduction), we focused on constraint and negative emotionality. The MPQ scales that load principally on the higher-order factor of constraint are the Traditionalism, Harm Avoidance, and Control scales. Thus, low constraint is characterized by a low degree of planning, impulsivity, and endorsement of nontraditional values. The MPQ scales that load principally on the higher-order factor of negative emotionality are Alienation, Aggression, and Stress reaction. Thus, negative emotionality is characterized by having intense reactions to negative or ambiguous events, particularly in the context of stress. Internal consistency reliability estimates (α) for all MPQ scales ranged from .77 to .92 across the age 17, 24, and 29 assessments. Higher-order factors were computed as weighted linear composites of the MPQ facet scales, where the weights were based on a factor analysis of the facet scales in the MPQ normative sample (see Tellegen & Waller, Reference Tellegen, Waller, Boyle, Mattews and Saklofske2008, for details).
Adult romantic relationship quality
Those with a spouse or partner for at least three months completed a 12-item version of the Dyadic Adjustment Scale (DAS; Spanier, Reference Spanier1976). This measure was assessed for everyone in a romantic relationship at age 29 (n = 1,916; 69% of the whole sample), but only the younger cohort was assessed at age 24 (n = 851 were in a romantic relationship; 31% of the whole sample). The DAS assessed (a) the degree of agreement vs. disagreement in their relationship (five items; e.g., “Philosophy of life,” with answers ranging from 1 = always disagree to 6 = always agree; αs ranged from .73 to .77 from ages 24 to 29); (b) frequency of discord (three items, e.g. “how often do you discuss or have you considered divorce, separation, or terminating your relationship?” with answers ranging from 1 = never to 6 = all of the time; αs ranged from .72 to .73); (c) dyadic cohesion (three items, e.g. “how often do you have stimulating exchange of ideas?” with answers ranging from 1 = more often to 6 = never; αs ranged from .68 to .71), and (d) overall happiness (One item, ranging from 1 = perfect to 7 = extremely unhappy) in the last 12 months. Items were recoded so that a higher score indicated better relationship quality. The disagreement and fighting subscale (eight items, answered on a scale of 1 to 6; α = .81 at ages 24 and 29), (b) the dyadic cohesion subscale (three items, answered on a scale of 1 to 6; α = .68 at age 24 and .71 at age 29), and (c) the happiness item (answered on a scale of 1 to 7) were standardized (z-scored) and then averaged to calculate the overall romantic relationship quality score (correlations for the subscales/happiness item ranged from .31 to .55, all ps < .001).
Adult romantic partner's past year frequency of alcohol use
Participants with a spouse/partner also completed the Substance Use Screen for Spouse/Partner at ages 24 and 29. Participants reported on their spouse/partner's frequency of alcohol use in the past year via one item (answered on a scale of 0 = never, 1 = less than once a month but at least once a year, 2 = about once a month, 3 = 2 or 3 times a month, 4 = 1 or 2 times a week, 5 = 3 or 4 times a week, 6 = nearly every day, 7 = every day, 8 = 2 times a day, or 9 = 3 or more times a day). Nearly everyone with a romantic partner reported that their partner drank alcohol in the past 12 months (93% at age 24 and 89% at age 29). The average frequency of alcohol use by romantic partners was 3.14 (SD = 1.56) at age 24 and 3.03 (SD =1.74) at age 29, indicating partners drank 2 to 3 times a month, on average, across assessments.
AUD symptoms
AUD symptoms were assessed using the Substance Abuse Module (Robins, Babor, & Cottler, Reference Robins, Babor and Cottler1987), which was developed as a supplement to the World Health Organization's Composite International Diagnostic Interview (Robins et al., Reference Robins, Wing, Wittchen, Helzer, Babor, Burke and Towle1988). Clinical interviews were conducted by trained interviewers who had satisfied proficiency criteria. Symptoms are assigned based on a review of the interview by pairs of staff members with advanced clinical training, who were blind to diagnoses of other family members (kappas exceeded .90 for all substance use disorder diagnoses). DSM III-R was the diagnostic system in place when the study began. DSM III-R included different symptoms for abuse and dependence. In order to balance sensitivity and specificity, and in line with the DSM-5 reclassification of AUD (American Psychological Association, 2013), the 10 DSM-III-R abuse and dependence symptoms were summed to create an AUD symptom count variable at ages 17, 24, and 29.
Missing Values Analysis
Concerning the potential effects of attrition, we compared AUD symptom count means at age 17 for those with missing vs. nonmissing AUD data at ages 24, and 29. Those who did not participate at ages 24 and 29 had slightly more AUD symptoms at age 17; however, mean differences were small in effect size (Cohen's d = .17 at age 24, and .09 at age 29), suggesting a limited influence of attrition due to AUD in the MTFS. There were essentially no differences in participation at ages 24 and 29 based on personality-related risk for AUD (low constraint, high negative emotionality) at age 17 (Cohen's ds ranged from .01 to .06). Additionally, attrition did not significantly vary by race/ethnicity at age 17, 24, or 29. However, those with lower socioeconomic status (SES) at baseline (a standardized composite of mother and father education, occupational status, and household income) were less likely to participate at follow-ups than those with higher SES, and these effects decreased across time (Cohen's d = .26 at age 24, .10 at age 29). Females were significantly more likely to participate at all assessments, although these differences were generally slight (age 17: 94% of females participated vs. 92% of males; age 20: 93% of females vs. 84% of males; age 24: 92% of females vs. 89% of males; age 29: 92% of females vs. 89% of males). Finally, living in rural area at baseline was associated with significantly greater levels of participation at age 17 for the younger cohort (91% of those from rural areas at baseline participated at the age 17 assessment vs. 86% of those from urban areas at baseline participated in the age 17 assessment, χ2 (1) = 7.08, p = .008. For the older cohort, there was 100% participation from both areas because age 17 was the baseline assessment for that cohort. There were no significant differences in participation by rural vs. urban baseline assessment at the age 24 or the 29 follow-ups for either cohort. All predictors of missingness are included in study models (described further, below).
Analysis Plan
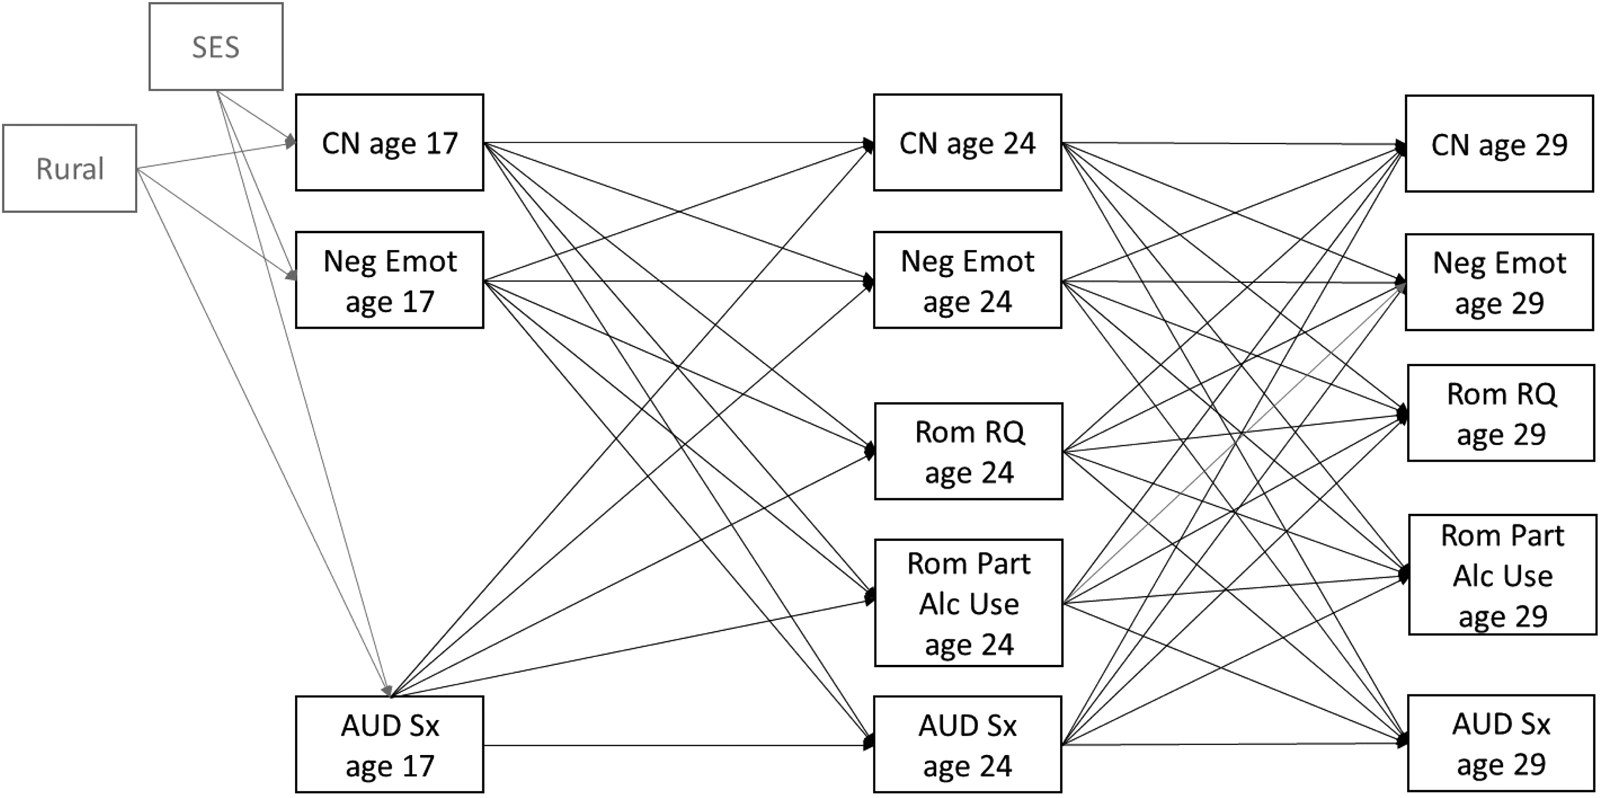
The main analyses (see Figure 2) were conducted using multivariate cross-lagged panel analysis using Mplus, version 8.1 (Muthén & Muthén, Reference Muthén and Muthén1998–2018), which uses full information maximum likelihood to account for missing data. All analyses accounted for the nested nature of individuals within families (e.g., twins) by using the CLUSTER specification, which adjusts standard errors for correlated family observations (Muthén & Muthén, Reference Muthén and Muthén1998–2018). The maximum likelihood with robust standard errors (MLR) estimator was used to accommodate nonindependence of cases. Predictors were mean-centered (using raw variables) prior to using the DEFINE feature in Mplus to create the interaction terms. Socioeconomic status and rural vs. urban (1 = rural, 0 = urban) status at baseline were included as covariates in the analysis. AUD symptoms were log-transformed prior to analysis to better approximate normality assumptions; transformed AUD variables had skewness ≤ 2.04 and kurtosis of ≤ 3.00, which is adequate for normality assumptions (Kline, Reference Kline2005; see Table 1 in the supplemental materials for detailed descriptive statistics before and after log-transformation, if interested).
Cross-lagged panel analytic model. SES = socioeconomic status, CN = constraint, Neg Emot = negative emotionality, AUD Sx = alcohol use disorder symptoms, Rom RQ = romantic relationship quality, Rom Part Alc Use = romantic partner alcohol use. This figure shows the cross-lagged analytic model used to test study hypotheses. Residual correlations between remaining variables at each time point (e.g., constraint and negative emotionality at ages 17, 24, and 29) were estimated, but they are not included in this diagram for clarity of presentation. Interactions between the two personality traits and two features of romantic relationship context in relation to both within-assessment and longitudinal AUD symptoms were tested, but they are not shown here for clarity of presentation (see Table 2 for a full list).

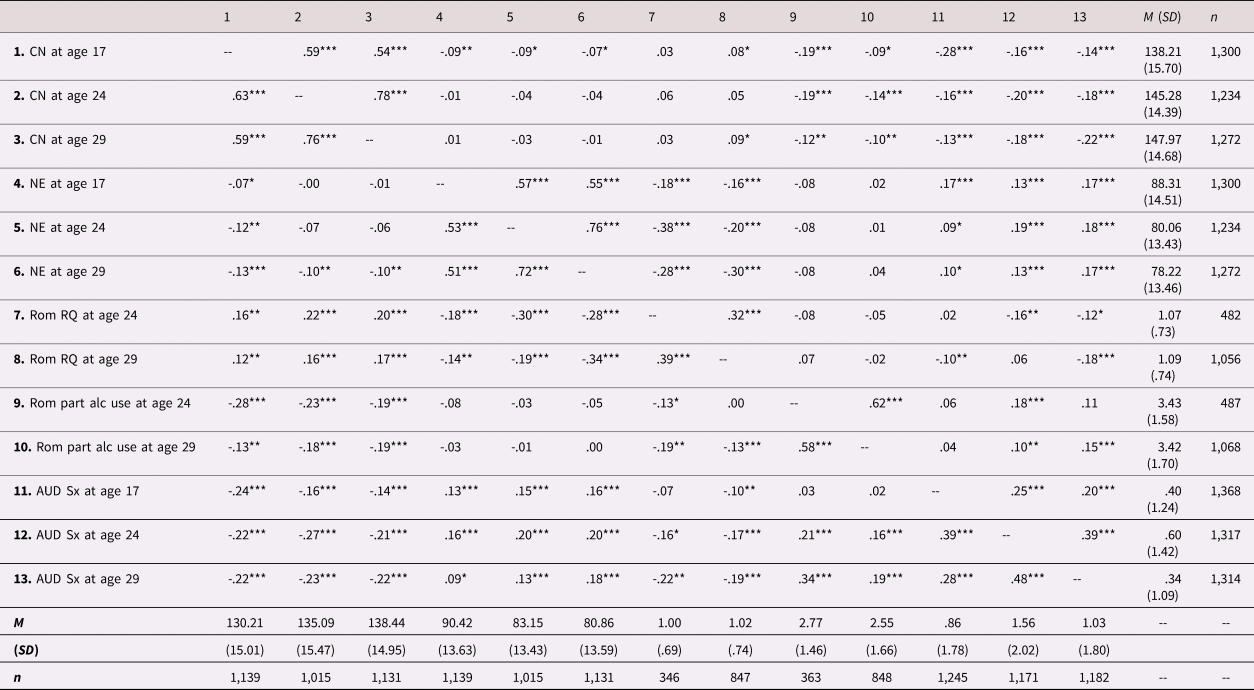
Correlations and descriptive statistics on study variables for the MTFS men (n = 1,333) and women (n = 1,436, shown above the diagonal)

Note: MTFS = Minnesota Twin Family Study, CN = Constraint, NE = Negative emotionality, Rom RQ= Romantic relationship quality, Rom part alc use = Romantic partner's frequency of past year alcohol use, AUD Sx = Alcohol Use Disorder Symptoms. AUD symptoms were log-transformed prior to analysis, but raw AUD symptom means (standard deviations) are provided in terms of descriptive statistics here. Correlations were estimated using Mplus 8.1 (Muthén & Muthén, Reference Muthén and Muthén1998–2018), which uses full information maximum likelihood to handle missing data. Statistical significance is denoted by ***p < .001 **p < .01 *p <.05.
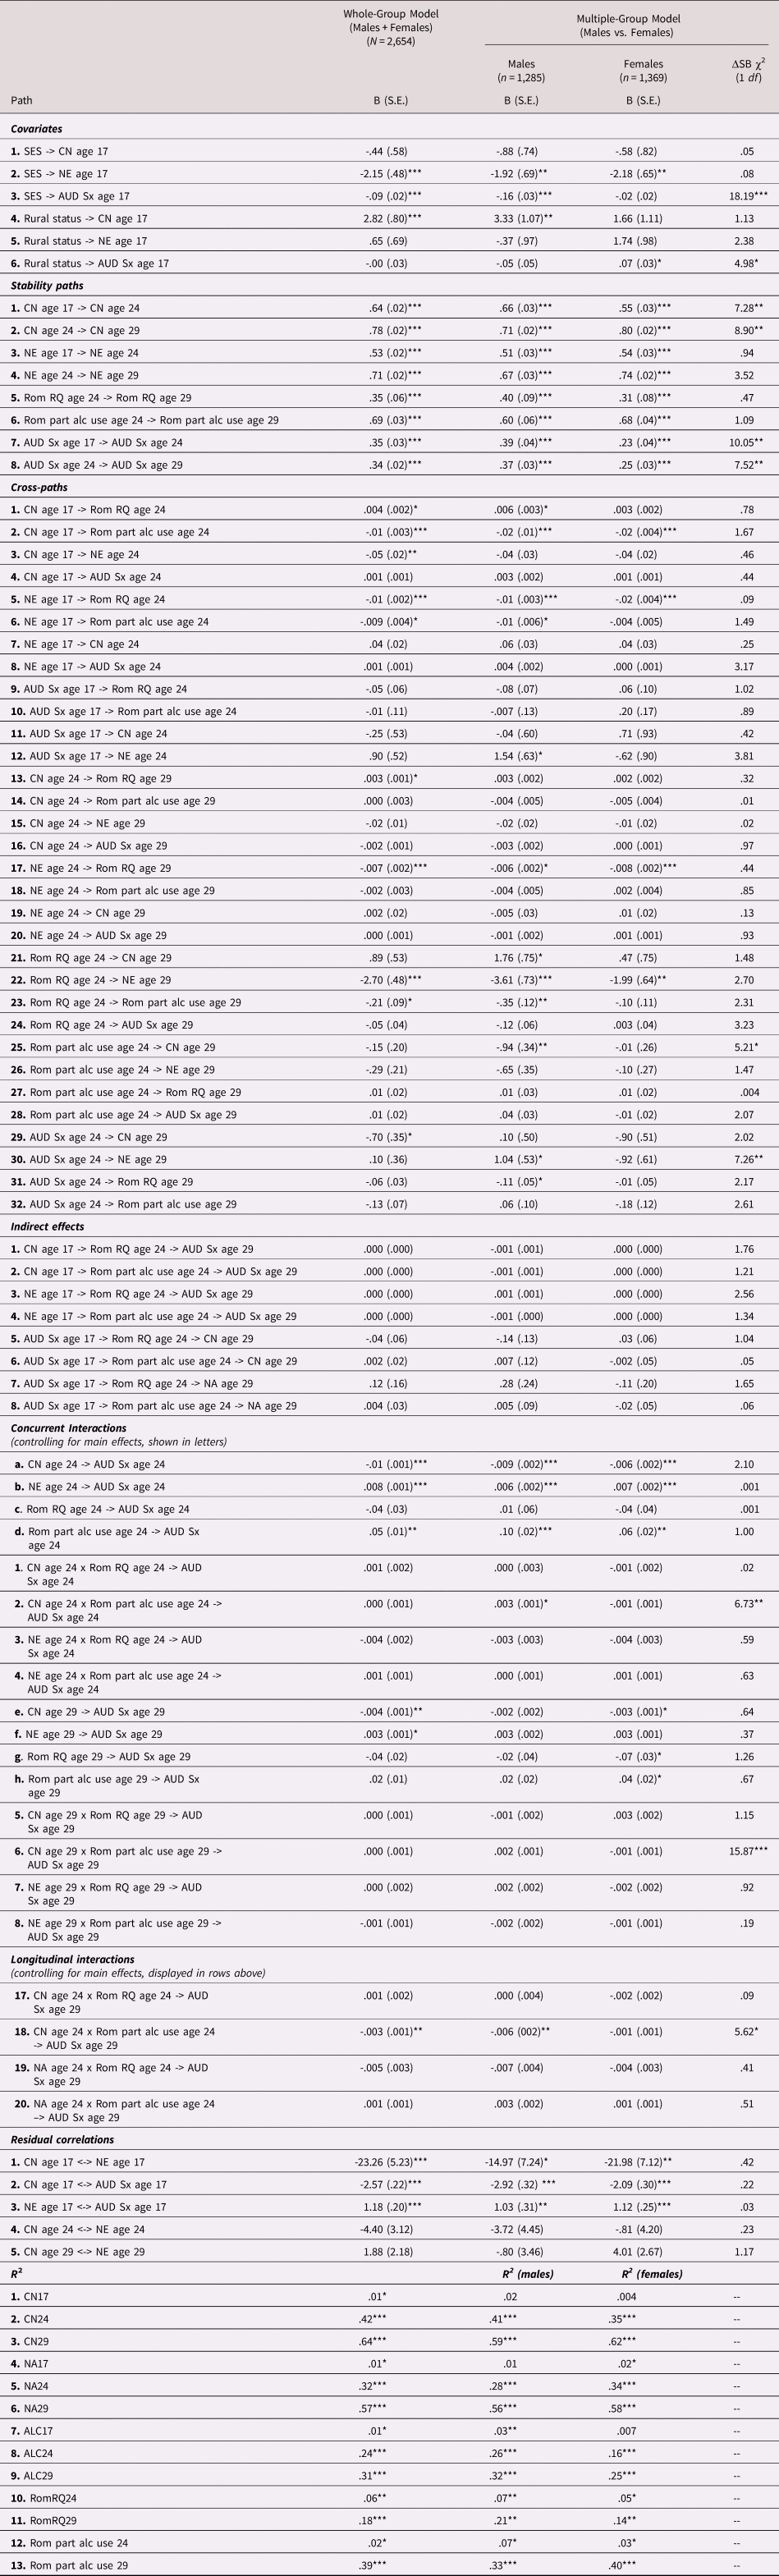
Unstandardized coefficients (standard errors) from cross-lagged panel models

Note: SES = baseline socioeconomic status, CN = constraint, NE = negative emotionality, AUD Sx = alcohol use disorder symptoms, Rom RQ = Romantic relationship quality, Rom part alc use = Romantic partner's past year frequency of alcohol use. This table shows results from the full cross-lagged models in terms of unstandardized coefficients (standard errors). Results for the entire sample are provided in addition to group differences by gender, as there were limited gender differences in cross-effects. All interaction terms were also correlated in this model but are not shown for clarity of presentation. For coefficients that were < .01, results are presented in three decimal points; otherwise, they are presented in two decimal points. Significant differences in the unstandardized estimates by gender were tested using the Satorra-Bentler chi-square difference test (ΔSB χ2) for all estimates except for the indirect effects; for these the Wald test of parameter constraints was used. ***p < .001 **p < .01 *p <.05
We explored potential differences in gender by testing a multiple group model, which estimated results for males and females separately. We tested for significant differences in paths by gender by constraining each path to be equivalent and using the Satorra-Bentler chi-square difference test (ΔSB χ2) to test for significant decrement to model fit. To test whether romantic relationship features at age 24 mediated the association between personality-based traits at age 17 and AUD symptoms at age 29, as well as the association between AUD symptoms at age 17 and personality traits risk at age 29, we used MODEL INDIRECT statements in Mplus, 8.1, which takes the product of mediating paths (e.g., constraint at age 17 × romantic relationship quality at age 24; see Hayes, Reference Hayes2009; Preacher & Kelly, Reference Preacher and Kelly2011). To test whether indirect paths significantly differed by gender, the Wald test of parameter constraints was used (see Muthén, Reference Muthén2011).
Finally, we examined interaction effects between personality traits and romantic relationship variables in predicting AUD symptoms and whether these interactions varied by gender. These analyses included 12 interactions terms: eight concurrent interactions at ages 24 and 29 (two personality traits × two features of romantic relationship context at two time points), and four cross-time interactions (two personality traits at Age 24 × two features of romantic relationship context at Age 24, predicting AUD symptoms at age 29). Moreover, we tested whether these 12 interaction terms significantly differed by gender, resulting in another 12 tests for significant differences (for a grand total of 24 tests for significant differences). To account for multiple testing, we used a Bonferroni adjustment (α = .05/24), thus requiring a p-value < .002 to be considered statistically significant. If any interaction effect reached this threshold, the interaction effect was plotted and follow up analyses were conducted to further probe the interaction using Roisman, Newman, Fraley, Haltigan, Groh, and Haydon's (Reference Roisman, Newman, Fraley, Haltigan, Groh and Haydon2012) guidelines.
Results
Preliminary Analyses
Table 1 shows correlations and descriptive statistics (means, standard deviations) for all study variables. We briefly comment on the nature of important effect sizes in terms of Cohen's d here (.20 is considered small, .50 medium, and >.80 large; Cohen, Reference Cohen1988). Males reported more AUD symptoms (Cohen's ds = .30 to .67) and lower constraint scores (Cohen's ds = .52 to .68) than females across time. On the other hand, gender differences in negative emotionality were small, with males having slightly higher scores at each age (Cohen's ds ranged from .15 to .23). Gender differences were also small for relationship quality, with females reporting slightly higher quality (Cohen's ds ranged from .09 to .10). Females tended to report greater romantic partner alcohol use than males (Cohen's ds = .44 to .52). Mean-levels of constraint scores increased (Cohen's d ranged from .19 to .47) and negative emotionality scores decreased (Cohen's ds ranged from -.14 to -.59) across time for both genders. Mean AUD symptoms increased from age 17 to age 24 (Cohen's ds ranged from .15 to .37) and then declined from age 24 to age 29 (Cohen's ds ranged from -.21 to -.28) for both genders, consistent with expectation from past research (see Table 1 for details).
Zero-order correlations showed a medium to large effect size for the rank-order stability of personality trait scores for both males and females (rs ranged from .54 to .78 for constraint and from .51 to .76 for negative emotionality; all ps < .001; see Table 1 for details). Alcohol use disorder symptoms were also moderately stable for males and females across time, with correlations ranging from .28 to .48 for males and from .20 to .39 for females (all ps < .001). Cross-sectional and longitudinal correlations between constraint and AUD symptoms ranged from -.27 to -.14 for males and from -.28 to -.13 for females (all ps < .001). For negative emotionality, cross-sectional and longitudinal correlations with AUD symptoms ranged from .09 to .20 for males and from .09 to .18 for females (all ps < .05; see Table 1 for details). Cross-sectional and longitudinal correlations generally confirmed small but significant links between romantic relationship quality and AUD symptoms for males (rs ranged from -.22 to -.07) and females (rs ranged from -.18 to .02). Small to moderate significant correlations were also found between romantic partner alcohol use and AUD symptoms for males (rs ranged from .02 to .34) and females (rs ranged from .04 to .18; see Table 1 for details).
Results from Multivariate Path Analytic Model
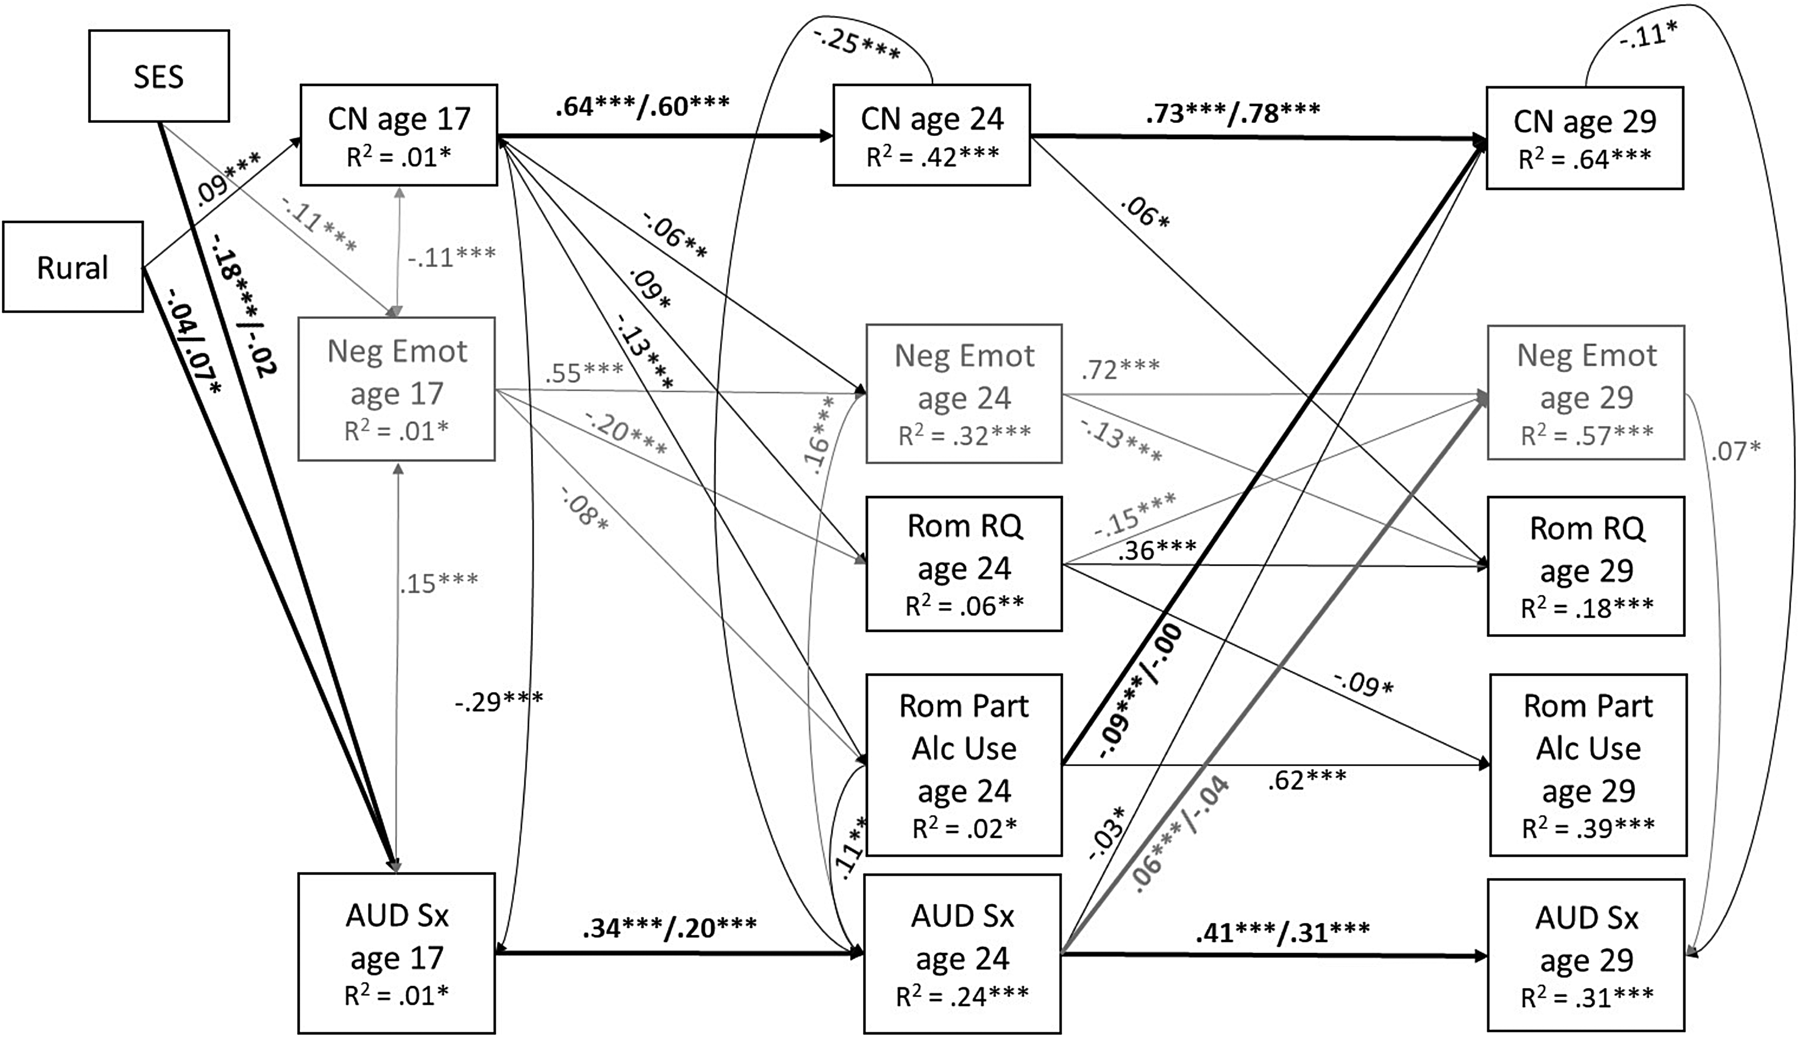
Model fit statistics showed adequate fit for the multiple group model, χ2 (314) = 1,196.24, p < .001; RMSEA = .05; 95% CI [.04, .05]; CFI = .86; SRMR = .07. A moderate amount of predicted variance was explained for AUD symptoms at age 24 and 29 for both males (n = 1,285) and females (n = 1,369) by the model overall (males: R 2 age 24 = .26, p < .001, R 2 age 29 = .32, p < 001; females: R 2 age 24 = .16, p < .001, R 2 age 29 = .25, p < .001). Constraining all paths to be equivalent by gender resulted in a significant decrement in model fit, ΔSB χ2 (71) = 139.35, p < .001. Follow-up analyses were conducted to determine which paths were significantly different across gender (see Table 2). However, as many of the paths were not significantly different by gender, we have also provided results using the entire sample (i.e., not grouped by gender) for the purpose of comparison (N = 2,654). Model fit statistics for this subsequent model showed good fit, χ2 (153) = 513.44, p < .001; RMSEA = .03; 95% CI [.03, .03]; CFI = .94; SRMR = .04. Results are shown in Figure 3 (standardized coefficients) and Table 2 (unstandardized coefficients, standard errors, and significance testing).
Cross-lagged panel results (N = 2,654). SES = socioeconomic status, CN = constraint, Neg Emot = negative emotionality, AUD Sx = alcohol use disorder symptoms, Rom RQ = romantic relationship quality, Rom Part Alc Use = romantic partner alcohol use. Results are shown in terms of standardized coefficients. All paths corresponding to a significant difference in gender from the multigroup model are shown in bold, with results for males (n = 1,285) presented before the slash and for females (n = 1,369) after the slash. For those results that were not significantly different by gender, standardized coefficients from the model that combined males and females are provided. R 2s are also provided from the model that combined males and females. Paths and coefficients involving negative emotionality are shown in gray for clarity of presentation. Paths representing correlations between constructs at each assessment (e.g., personality at age 29 and AUD symptoms at age 29) refer to residual correlations. Paths that were not significantly different from zero are not shown for clarity of presentation; see Table 2 for detailed results in terms of unstandardized coefficients, including those from all interaction terms (none met the conservative threshold of p < .002). ***p < .001 **p < .01 *p < .05.

As shown in Figure 3, results supported our hypotheses regarding the corresponsive principle of personality. Low constraint at age 17 was significantly associated with lower romantic relationship quality and greater romantic partner alcohol use at age 24. Negative emotionality at age 17 was also significantly associated with lower romantic relationship quality at age 24. From ages 24 to 29, there were reciprocal associations between negative emotionality and romantic relationship quality such that greater negative emotionality at age 24 predicted poorer romantic relationship quality at age 29, and poorer romantic relationship quality at age 24 predicted greater negative emotionality at age 29. Finally, greater romantic partner alcohol use and AUD symptoms at age 24 predicted lower constraint and greater negative emotionality at age 29, respectively—but only for men. As shown in Figure 3, our hypothesized cross-effects were typically small in effect size (absolute βs ≤ .20).
There were few significant gender differences in cross-paths. The majority of gender differences were for the stability paths of constraint and AUD symptoms across time. For example, the stability of constraint from age 17 to 24 was greater for males than females. However, the stability of constraint from age 24 to 29 was greater for females than males. Additionally, the stability of AUD from ages 17 to 24 and 24 to 29 were significantly greater for males than females. Lower SES was significantly associated with greater AUD symptoms at age 17 for males but not females. Rural status was associated with greater AUD symptoms at age 17 for females but not males (see Figure 3 and Table 2 for details). In general, all reported gender differences were small in effect size, suggesting minimal meaningful gender differences.
Although personality traits at ages 17 and 24 predicted subsequent romantic relationship features, they did not significantly predict subsequent AUD symptoms at ages 24 or 29. Instead, within-assessment residual correlations between traits and AUD symptoms were significantly associated. Effect sizes were somewhat larger for constraint at ages 17 and 24 (absolute βs ranged from .25 to .29) than negative emotionality at ages 17 and 24 (βs ranged from .15 to .16; see Figure 3 and Table 2 for details). These effects were less pronounced at age 29. These results suggest that when controlling for prior and current personality-based risk, current personality-based risk was most relevant to predicting concurrent AUD symptoms in adolescence and early adulthood.
Mediation and Moderation
We hypothesized that the romantic relationship features would mediate the associations between personality traits at age 17 and AUD at age 29, as well as between AUD at age 17 and personality traits at age 29. The results showed no significant indirect effects (perhaps not surprising given the small effect sizes for direct effects presented above) and there were no significant differences by gender. A lack of mediation effects was also confirmed in subsequent bootstrapping analyses that removed the clustering of data by family ID (because bootstrapping was not available with multilevel data in Mplus, version 8.1) and incorporated 1,000 bootstraps. Of the 24 personality × romantic relationship interactions tested, none were significantly different using our conservative threshold (p < .002; see Table 2 for details).
Post-Hoc Analyses
To retain maximal power and estimate missing data, we used full information maximum likelihood and the entire sample for all of the prior analyses. We also evaluated models that excluded those who had never been in a romantic relationship by age 29 (n = 853; 31% of the sample excluded) and provide details of these results in the supplementary materials (eTable 2, eFigure 1). Results generally followed what was presented for the whole sample in that (a) personality traits at age 17 predicted romantic relationship features at age 24, (b) romantic relationship features at age 24 predicted subsequent personality traits at age 29, (c) there were no significant personality × romantic relationship feature interactions that met our conservative threshold, (d) there was little support for meaningful gender differences, and (e) all cross-effects were generally small in effect size. We also confirmed that the results were generally consistent for the younger vs. older cohorts (see supplementary materials, eTables 3–4, eFigures 2–3), although there was generally less interplay between personality and romantic relationship features for the older cohort as romantic relationship features were only assessed at age 29 (not age 24).
Discussion
Prior research has consistently demonstrated a complex process of individual difference × social context interplay in relation to adolescent substance use problems (Dick et al., Reference Dick, Pagan, Viken, Purcell, Kaprio, Pulkkinen and Rose2007a; Dick et al., Reference Dick, Viken, Purcell, Kaprio, Pulkkinen and Rose2007b; Hicks et al., Reference Hicks, South, DiRago, Iacono and McGue2009; Rioux et al., Reference Rioux, Castellanos-Ryan, Parent and Seguin2016), but less research has evaluated this in relation to early and late young adult substance use problems, the periods when there are marked differences in peak use (ages 18–25), followed by a general decline in the late twenties and early thirties (Chassin et al., Reference Chassin, Flora and King2004; Chen & Kandel, Reference Chen and Kandel1995; SAMSHA, 2017; Schulenberg & Partrick, Reference Schulenberg, Partrick, White and Rabiner2012). We addressed this critical gap by testing for personality x romantic partner context interplay in relation to adult AUD symptoms at ages 24 and 29.
Support for the Corresponsive Principle of Personality
Our results appear to support our hypotheses regarding the corresponsive principle of personality (Caspi et al., Reference Caspi, Roberts and Shiner2005), which proposes that personality traits appear to affect selection into certain social contexts, which subsequently reinforce those traits and associated outcomes. We demonstrated that low constraint in late adolescence (age 17) was associated with poorer romantic relationship quality and greater romantic partner alcohol use in early adulthood (age 24). Further, the link between negative emotionality and romantic relationship quality in particular showed evidence for bidirectional or transactional effects such that greater negative emotionality at age 24 was associated with poorer romantic relationship quality at age 29 and poorer romantic relationship quality at age 24 was associated with greater negative emotionality at age 29, partially confirming expectations. However, neither personality nor romantic relationship features predicted subsequent AUD symptoms directly. Rather, within-time point residual correlations between personality traits and AUD symptoms were associated rather than cross-time points. This may further support the codevelopment of personality and AUD during the transition of adolescence and young adulthood (Samek, Hicks et al., Reference Samek, Hicks, Durbin, Hinnant, Iacono and McGue2018).
These findings generally follow prior research demonstrating cross-sectional links between these traits and relationship quality (e.g., Donnellan, Assad, Robins, & Conger, Reference Donnellan, Assad, Robins and Conger2007) and longitudinal correlations between negative emotionality and constraint at age 18 and romantic relationship quality, conflict, and abuse at age 26 (Robins, Caspi, & Moffitt, Reference Robins, Caspi and Moffitt2002). Nonetheless, other aspects individual difference and social context may be more relevant to the developmental interplay between personality-based risk, romantic relationship context, and AUD symptoms in young adulthood that were not accounted for in our model. Additional key individual difference factors that may be relevant include a genetic liability (Samek et al., Reference Samek, Hicks, Durbin, Hinnant, Iacono and McGue2018) as well as other personality traits, such as sensation seeking or negative urgency (Quinn, Stappenbeck, & Fromme, Reference Quinn, Stappenbeck and Fromme2011; Whiteside & Lynam, Reference Whiteside and Lynam2003). Additional key social contextual factors that may be more relevant to adult AUD than romantic relationship quality and partner alcohol use might include exposure to chronic stress (Ford & Smith, Reference Ford and Smith2008; Wu, Eschbach, & Grady, Reference Wu, Eschbach and Grady2008) or poverty (Kahn, Murray, & Barnes, Reference Kahn, Murray and Barnes2002), in addition to more nuanced features of romantic relationship experiences, such intensity of break ups, romantic partner victimization, and aggression (Reingle, Jennings, Connell, Businelle, & Chartier, Reference Reingle, Jennings, Connell, Businelle and Chartier2014). Thus, several factors at the larger ecological and smaller biological lens likely contribute to adult alcohol use problems that were not evaluated here that warrant further attention.
There was no evidence that features of romantic relationships (low relationship quality, high partner alcohol use) mediated the associations between personality traits at age 17 and AUD symptoms at age 29 or between AUD symptoms at age 17 and personality traits at age 29. This is likely due to the small effect sizes of direct effects as well as the many years between assessments. Perhaps with smaller intervals of assessment (yearly or potentially monthly), cross-time and mediation effects would be more evident, as romantic relationships appear to be generally less stable in adolescence and young adulthood relative to later adulthood.
Person × Environment × Development Interplay
There was no evidence for a person × environment interaction in predicting AUD symptoms in young adulthood. Though we used a rather conservative threshold to test this (given the many interactions tested), the vast majority of interactions were not even significant at the nominal level (p < .05) with our adequately powered sample (large sample size). Along with prior research (Kendler et al., Reference Kendler, Gardner and Dick2011; Hentges et al., Reference Hentges, Shaw and Wang2018; Rioux et al., Reference Rioux, Castellanos-Ryan, Parent and Seguin2016; Samek, Hicks, et al., Reference Samek, Hicks, Keyes, Bailey, McGue and Iacono2015; Samek, Hicks, et al., Reference Samek, Hicks, Keyes, Iacono and McGue2017), these results suggest that models of diathesis stress or differential susceptibility may be more relevant for adolescent than for young adult substance use problems. For example, prior research using the same sample as was used in the present study (Samek, Hicks, et al., Reference Samek, Hicks, Keyes, Bailey, McGue and Iacono2015; Samek, Hicks, et al., Reference Samek, Hicks, Keyes, Iacono and McGue2017) showed support for a diathesis stress model of externalizing and substance use disorder (SUD) development such that the latent genetic influence for externalizing and SUDs at age 17 was greater under conditions of low parent–child relationship quality and high antisocial peer affiliation. Further, latent genetic influence was less under conditions of high parent–child relationship quality and low antisocial peer affiliation. No such interaction or interaction of any kind was found for externalizing and SUDs at ages 24 and 29 or when analyzing concurrent or prior reported parent–child relationship quality or antisocial peer affiliation.
Similarly developmentally limited person–environment interaction results have been found when analyzing personality as a measure of person-based risk. For example, Hentges and colleagues (Reference Hentges, Shaw and Wang2018) demonstrated support for the diathesis stress model when analyzing an interaction between early childhood impulsivity and rejecting parenting such that rejecting parenting at age 2 predicted adolescent substance use at age 15, but only for those high in impulsivity at age 2. No such interaction was found in relation to early adult substance use (age 22).
If person–environment interaction (supporting a diathesis stress or differential susceptibility model) is developmentally limited to adolescence, then adolescence may be a critical period during which to intervene in efforts to reduce substance use problems relative to young adulthood. Nonetheless, replication of these results and analysis of other potentially important young adult social contexts (e.g., chronic stress, SES, romantic relationship aggression, and victimization) and individual difference variables (e.g., including other personality traits such as sensation seeking) are needed to further support this claim.
Gender Similarities and Differences
Given the substantial gender differences in the prevalence of problematic alcohol use, we also evaluated gender differences in the prevalence of AUD symptoms and pattern of personality × environment interplay related to AUD in early and late young adulthood. Consistent with national statistics SAMSHA, 2017 (CBHSQ, 2017), the results showed greater average AUD symptoms for males than females with moderate to substantial effect sizes. In terms of risk profiles, however, we did not find that features of adult romantic relationship context were more relevant predictors of AUD symptoms for women than men or that personality traits were more relevant to AUD symptoms for men than women. However, in conjunction with a complication or “scar” model of personality development (Klein, Kotov, & Bufferd, Reference Klein, Kotov and Bufferd2011; Tackett, Reference Tackett2006), we did find that for men, greater romantic partner use and AUD symptoms at age 24 were associated with lower constraint and greater negative emotionality at age 29, respectively. For women, these effects were not significantly different than zero (and gender differences were statistically significant for these cross-paths). Nonetheless these effects were quite small in magnitude, suggesting limited meaningful gender differences in these associations. Replication and extension is needed to better gauge any meaningful gender differences in the associations between personality, romantic relationship features, and AUD symptoms in the transition from adolescence through young adulthood.
Strengths, Limitations, and Future Directions
The major strengths of this study include the measurement of AUD symptoms via clinically structured interviews, the longitudinal design, and the large sample with ample power to detect gender differences. Key limitations to this work include that the sample was almost entirely White, so findings may not generalize to other ethnic and racial groups. Another central limitation was that romantic relationship characteristics were measured by self-report, which may be influenced by the individual's own personality or alcohol use. Thus it remains imperative to replicate and extend this work by incorporating romantic partner report, using more detailed assessments of romantic partner relationship context (e.g., recent experience with break ups, romantic partner victimization, and aggression), and evaluating results in more diverse samples.
Finally, further, analysis is needed in shorter time frames (yearly or perhaps monthly) to better evaluate nuanced interplay between romantic relationship context in relation to personality-based risk and substance use problems given the variety of ways in which romantic relationships may influence or be influenced by personality or problematic substance use and the developmental nature of the constructs studied.
Practical Implications
Although additional research is needed, findings from this study provide at least some practical implications. Given the finding that low constraint and high negative emotionality were significant predictors of low romantic relationship quality and high romantic partner alcohol use in the transition from late adolescence through early adulthood, it may be beneficial to incorporate relationship education programs that are tailored to personality profile in late adolescence (Conrod et al., Reference Conrod, O'Leary-Barrett, Newton, Topper, Castellanos-Ryan, Mackie and Girard2013). In addition to education about personality-based risk and potentially helpful coping skills, such programs could incorporate aspects of healthy romantic relationship education and discussion of how personality may be related to past romantic relationship experiences, romantic partner selection, relationship quality, and partner substance use. Marriage and health relationship education programs have been found to be beneficial for high school students (Adler-Baeder, Kerpelman, Schramm, Higginbotham, & Paulk, Reference Adler-Baeder, Kerpelman, Schramm, Higginbotham and Paulk2007), and they would likely be beneficial to 18- to 25-year-olds given the increase in romantic relationship experiences with time (Lantagne & Furman, Reference Lantagne and Furman2017).
Conclusion
The purpose of this study was to evaluate person × social context interplay relevant to adult AUD symptoms at ages 24 and 29. We used personality trait measures to index person-level risk and compared whether results were found across two well-known traits that have been shown to be associated with alcohol and substance use problems (low constraint, high negative emotionality; Chassin et al., Reference Chassin, Flora and King2004; Durbin & Hicks, Reference Durbin and Hicks2014; Hicks, Schalet, et al., Reference Hicks, Schalet, Malone, Iacono and McGue2011; Samek et al., Reference Samek, Hicks, Durbin, Hinnant, Iacono and McGue2018; Sher et al., Reference Sher, Bartholow and Wood2000). We evaluated two salient features of adult romantic partner context including romantic relationship quality and frequency of past year romantic partner alcohol use. The results support the importance of the corresponsive principle of personality (Caspi, Roberts, & Shiner, Reference Caspi, Roberts and Shiner2005) such that greater personality-based risk appears to influence exposure or selection into “riskier” romantic relationship environmental contexts, which help to stabilize high personality-based risk. Given this finding, relationship education programs that target individuals based on personality-based risk and teach healthy coping skills may be beneficial at critical turning points in early adulthood when substance use rates spike and later decline (SAMSHA, 2017). Furthermore, results from this study and others (Hentges et al., Reference Hentges, Shaw and Wang2018; Kendler et al., Reference Kendler, Gardner and Dick2011; Samek, Hicks, et al., Reference Samek, Hicks, Keyes, Bailey, McGue and Iacono2015; Samek, Hicks, Keyes, et al., Reference Samek, Hicks, Keyes, Iacono and McGue2017) suggest that person × environment interactions may be less relevant for young adults than for adolescents with respect to developing substance use problems. This deserves careful attention in future research.
Supplementary Material
The supplementary material for this article can be found at https://doi.org/10.1017/S0954579419001111.
Financial Support
This research was supported by Grant AA09367 from the National Institute on Alcohol Abuse and Alcoholism and Grant DA05147 from the National Institute on Drug Abuse. D.R.S. was also supported by Grant AA024282 from the National Institute on Alcohol Abuse and Alcoholism and Project 1006129 from the USDA National Institute of Food and Agriculture. The content is solely the responsibility of the authors.
Conflict of Interest
The authors declare no conflict of interest.