Implications
Feed efficiency is a trait of great economic importance, however the underlying biological mechanisms are not well understood. This study has identified that pigs of high and low feed efficiency had differences in nutrient digestibility, with accompanying changes in intestinal nutrient transporter gene expression. These results suggest that changes in small intestinal absorptive processes possibly lead to increases in nutrient digestibility and is therefore, an important biological process determining feed efficiency in pigs.
Introduction
Residual feed intake (RFI) is a useful measure in studying the underlying biological mechanisms that influence feed efficiency. The trait is defined as feed intake adjusted for maintenance requirements and BW gain (Koch et al., Reference Koch, Swiger, Chambers and Gregory1963). Animals with lower adjusted feed consumption are more efficient because they consume less feed based on their gain and maintenance requirements (Young and Dekkers, Reference Young, Cai and Dekkers2012).
A variety of biological and physiological traits influence RFI including digestion, metabolism, body composition, physical activity and thermoregulation (Herd and Arthur, Reference Herd and Arthur2009). Visceral organs represent a small proportion of overall BW, but account for a large portion of animal energy expenditure due to being involved in metabolically expensive processes including protein synthesis and degradation, substrate cycling and urea synthesis (McBride and Kelly, Reference McBride and Kelly1990). In addition, digestion of nutrients may contribute to differences in efficiency between RFI pigs. However, there are conflicting results between studies, as no effect of RFI on nutrient digestibility has been observed in one study (Barea et al., Reference Barea, Dubois, Gilbert, Sellier, van Milgen and Noblet2010) while another study found higher total tract digestibility of dry matter, nitrogen, ash and gross energy in low RFI pigs (LRFI) (Harris et al., Reference Harris, Patience, Lonergan, Dekkers and Gabler2012).
While studies have been conducted into the effect of RFI on nutrient digestibility, little research has been undertaken into the digestion and absorption of nutrients in animals differing in feed efficiency. The small intestine plays an important role in nutrient breakdown and absorption. Enzymes such as amylase, lipase, pepsin and trypsin play a key role in the metabolism of carbohydrates, fats and proteins. Following nutrient breakdown by digestive enzymes, nutrient transporters expressed on the apical membrane of intestinal enterocytes play an important role in the absorption of nutrients into the blood stream (Dyer et al., Reference Dyer, Vayro, King and Shirazi-Beechey2003). The intestinal microflora play a dual role in the fermentation of non-digestible carbohydrates into a final product of volatile fatty acids (VFAs) and also have a symbiotic relationship with the host in the prevention of disease. Changes in the bacterial make-up with increased pathogenic bacterial load can lead to inflammation, reduction in absorptive capacity and reductions in feed efficiency (Littman and Pamer, Reference Littman and Pamer2011).
It is hypothesised that increased enzyme and increased nutrient transporter gene expression and alterations in the microbial population may lead to increased nutrient digestibility, which in turn, is responsible for the improved efficiency in LRFI pigs. Hence, the objective of this study was to examine nutrient digestibility, organ weights, select bacterial populations, enzyme and intestinal nutrient transporter gene expression in pigs with large differences in RFI values.
Material and methods
All procedures described in this experiment were conducted under experimental licence from the Irish Department of Health in accordance with the Cruelty to Animals Act 1876 and the European Communities (Amendments of the Cruelty to Animals Act 1876) Regulations, 1994.
Experimental design and animal management
A complete randomised design experiment was used to examine nutrient digestibility, organ weights, select bacterial populations, VFA production, enzyme and intestinal nutrient transporter gene expression in a pig population divergent in feed efficiency.
On the day of farrowing, 144 male piglets of similar size (average birth weight (1.5 kg SEM 0.2)) were selected from 28 sows (~5 piglets selected per sow) (Large White×Landrace) that had been bred to Meatline boars (Maxgro; Hermitage Genetics, Kilkenny, Ireland) on a commercial Irish pig farm. At weaning (day 28) the 144 pigs had an average weight of 7.5 kg (SEM=0.82) and were reared on a standard weaning diet containing 13.69 g/kg standardised ileal digestible (SID) lysine and 16 MJ digestible energy (DE)/kg (Supplementary Table S1).
At 56 days old 75 male pigs of similar size (average BW of 22.42 kg (SEM=2.03)) were identified for further monitoring to identify animals that would differ in RFI and could be used for further analysis. These were fed a standard grower diet (10.82 g/kg SID lysine and 14.5 MJ DE/kg) using single space electronic feeders. When the pigs were ~80 days old, the diet was changed to the finisher diet composed of 9.21 g/kg SID lysine and 14 MJ DE/kg, which was fed until slaughter. The animals were penned in groups of fifteen with a space allowance of 0.85 m2 per pig. The five group pens were equipped with single space computerised feeders (Mastleistrungsprufing MLP-RAP; Schauer Agrotronic AG, Sursee, Switzerland) which recorded feed intake as previously described by Varley et al. (Reference Varley, Flynn, Callan and O’Doherty2011). During the experiment, feed samples were collected at the time of feeding and were retained for chemical analysis. Celite (300 mg/kg) was added to the feed at manufacture in order to measure the coefficient of apparent ileal (CAID) and total tract nutrient digestibility (CATTD) of N, ash, DM, GE using acid insoluble ash as an exogenous marker.
Calculation of residual feed intake
To calculate RFI, the BW of each animal was recorded on d 56 and subsequently on d 63, 70, 77, 84, 91, 98 and 105. Day 77 BW was used to calculate midtest metabolic BW (MBW). MBW was represented as BW0.60 and is representative of the maintenance requirement of the animal (NRC, 2012; Kil et al., Reference Kil, Kim and Stein2013). Three pigs were excluded from the analysis due to health issues leaving a total sample size of 72 pigs. The RFI was computed for each animal and was assumed to represent the residuals from a multiple regression model regressing average daily feed intake (ADFI) on average daily gain (ADG) and MBW. The base model used was Y ij =β 0+β 1MBW i +β 2ADG j +e ij , where Y ij is the standardised ADFI of the jth animal, β 0 the regression intercept, β 1 the regression coefficient on MBW, β 2 the regression coefficient on ADG and e ij the uncontrolled error of the jth animal. Standard deviations above and below the mean were used to group animals into HRFI (RFI>0.5 SD above the mean), medium RFI (MRFI) (RFI±0.5 SD above and below the mean), and LRFI (RFI<−0.5 SD).
Post slaughter tissue collection
On day 115, the eight least efficient and eight most efficient RFI animals were selected to collect tissue for intestinal enzyme and nutrient transporter gene expression analysis. Following a 3 h fast, the pigs were humanely sacrificed by lethal injection with Pentobarbitone Sodium BP (Euthatal Merial Animal Health Ltd, Harlow, Essex, UK) at a rate of 0.71 ml/2 kg BW. Following slaughter, the entire digestive tract was removed and tissue from the duodenum (10 cm from the stomach), jejunum (60 cm from the stomach), ileum (8 cm from the ileocaecal valve) and pancreas were removed and rinsed with sterile Oxoid phosphate buffered saline tablets. Intestinal tissue sections 1 cm2, were stripped of overlying smooth muscle and were stored in RNAlater solution (Ambion Inc.) overnight at 4°C. The RNAlater was then removed and tissue was stored at −70°C until RNA extraction. Multiple organs (stomach, small intestine, large intestine, liver, kidneys, testes, heart, spleen and thyroid) were removed post slaughter, emptied and washed and immediately weighed.
Post slaughter digesta collection
Following slaughter, digesta and faeces were immediately collected from the eight least efficient and eight most efficient RFI animals to analyse digestibility, microbiology and VFAs analysis in a similar manner to that described for tissue collection. Following slaughter, the entire digestive tract was removed by blunt dissection and digesta samples were recovered aseptically from the ileum ~30 cm from the ileocaecal valve, in order to measure the CAID of N, DM, ash and GE. Digesta was removed from the second loop of the ascending colon, within 10 min of slaughter, stored in separate, sterile containers (Sarstedt) for further VFA and microbial analysis. Microbial genomic DNA was extracted from the digesta samples using a QIAamp DNA stool kit (Qiagen Inc.) in accordance with the manufacturer’s instructions. The quantity and quality of DNA were assessed using a Nanodrop apparatus (ND1000) (Thermo Fisher Scientific Inc., MA, USA). For qPCR, standard curves were prepared with pooled aliquots of digesta and faecal microbial genomic DNA for the absolute quantification of bacteria (Lee et al., Reference Lee, Kim, Shin and Hwang2006). Genus- and species-specific primers (Supplementary Table S2) for Lactobacilli, Enterobacteriaceae, Bifidobacteria, Bacteriodes and Firmicutes were used for the estimation of gene copy number in the caecal and colonic digesta using qPCR on the ABI 7500 Real-Time PCR System (Applied Biosystems Ltd, Carlsbad, CA, USA) using the method of O’Shea et al. (Reference O’Shea, Sweeney, Bahar, Ryan, Thornton and O’Doherty2012).
Digesta samples collected from the caecum and colon were mixed with sodium benzoate and phenylmethylsulfonyl fluoride, to stop any bacterial activity and minimise the effects of post-thawing fermentation, which would influence final VFA concentrations. The VFA analysis was performed using GLC according to the method described by Lynch et al. (Reference Lynch, O’Shea, Sweeney, Callan and O’Doherty2008).
Post slaughter carcass analysis
All animals were sacrificed on day 115 of the experiment. Backfat thickness was measured at 6 cm from the edge of the split back at the level of the third and fourth last rib by using the Hennessy grading probe (Hennessy and Chong, Auckland, New Zealand). The lean meat content was estimated according to the method of Egan et al. (Reference Egan, Sweeney, Hayes and O’Doherty2015) using the following formula: Estimate lean meat content (g/kg)=543.1–7.86x+2.66y. Where x is the fat depth (mm) and y the muscle depth (mm). Further carcass data were determined by application of the following equations: Carcass weight (kg)=Hot carcass weight×0.98. Kill-out proportion (%)=carcass weight/BW.
Laboratory analysis of samples
Samples of the diet were taken weekly and stored at −20°C for the purpose of calculating DM, N, ash and GE. Following collection, faeces and digesta were dried at 55°C for 72 h. The feed samples, digesta and dried faeces were milled through a 1 mm screen (Christy and Norris hammer mill, Ipswich, UK). Diets, digesta and faeces were analysed for DM (method 934.01) and crude ash (method 942.05) according to the method of the Association of Official Analytical Chemists (AOAC, 1995). The DM was determined after drying for 24 h at 100°C and the crude ash content was determined after ignition of a weighed sample in a muffle furnace (Nabertherm, Bremen, Germany) at 550°C for 6 h. The GE was determined using an adiabatic bomb calorimeter (Parr 6300 isoperibol calorimeter; Parr Instruments, Moline, IL, USA). The N concentration of diets, faeces and digesta were determined using a LECO FP 528, (Leco Instruments, Cheshire, UK). The acid insoluble ash analysis was determined according to the method of McCarthy et al. (Reference McCarthy, Bowland and Aherne1977).
RNA extraction and real-time PCR
Total RNA was extracted from each tissue sample (25 mg) using Trizol Reagent (Sigma-Aldrich) according to the method of Chomczynski and Sacchi (Reference Chomczynski and Sacchi2006). The crude RNA extract was further purified using the GenElute Mammalian Total RNA Miniprep Kit (RTN70; Sigma-Aldrich) according to the manufacturer’s instructions. To eliminate possible genomic DNA contamination, total RNA samples were subjected to DNase I (Sigma-Aldrich Corporation) treatment according to the manufacturer’s instructions. The total RNA was quantified using a NanoDrop-ND1000 Spectrophotometer (Thermo Fisher Scientific Inc.) and the purity was assessed by determining the ratio of the absorbance at 260 and 280 nm. All total RNA samples had 260/280 nm ratios above 1.8. In addition, RNA integrity was verified by using the Agilent RNA 6000 Nanochip bioanalyzer kit. All samples had an RNA Integrity Number (RIN) above 8 (average 8.3 SEM 0.59). Total RNA (1 µg) was reverse transcribed (RT) using a commercially available cDNA synthesis kit (First Strand cDNA Synthesis Kit; Applied Biosystems) using oligo dT primers in a final reaction volume of 20 µl, according to the manufacturers instructions: minus reverse transcriptase and no template controls were included. The final RT product was adjusted to a volume of 120-µl, using nuclease free water. The mRNA expression profiles of SGLT1/SLC5A1: sodium/glucose co-transporter 1; GLUT1/SLC2A1: glucose transporter 1; GLUT2/SLC2A2: glucose transporter 2; GLUT5/SLC2A5: fructose transporter 5; GLUT7/SLC2A7: glucose transporter 7; FABP2: fatty acid binding protein 2; CD36: cluster of differentiation 36; PEPT1: peptide transporter 1; SLC6A19: sodium-dependent neutral amino acid transporter B(0)AT1; SLC7A11: anionic amino acid transporter light chain, xc- system; SLC7A1: Cationic amino acid transporter, Y+system; SI: sucrase–isomaltase; AMY2: pancreatic amylase 2B; PGA: pepsinogen A; PNLIP: pancreatic lipase; TRPGEN: trypsinogen; CNDP1: carnosine dipeptidase were analysed by quantitative real-time PCR (qPCR) using the ABI Prism 7500 FAST sequence detection system according to the method of Walsh et al. (Reference Walsh, Sweeney, O’Shea, Doyle and O’Doherty2013). The primer sequences are presented in Supplementary Table S3. All reactions were performed in duplicate in a total volume of 20 μl containing 10 μl of SYBR Green PCR Mastermix, (Applied Biosystems Limited) 1.0 μl forward and reverse primer (300 pM each)), 8 μl of RNAse free water, and 1 μl of template cDNA (5.0 ng of RNA equivalents). The 2-step PCR programme was as follows: 95°C for 10 min for 1 cycle, followed by 95°C for 15 s and 60°C for 1 min for 40 cycles. Primers were designed for each gene of interest (Primer Express Software v2.0, Applied Biosystems Limited) and the specificity of all primers was confirmed by dissociation analysis. All assays had efficiency between 90% and 110%. The most optimally stable reference targets were identified using the geNorm application within the qbasePLUS software package (Hellemans et al., Reference Hellemans, Mortier, De Paepe, Speleman and Vandesompele2007) (Biogazelle, Zwijnaarde, Belgium) and confirmed for this study (V<0.15). The normalisation factor was calculated using the qbasePLUS algorithm from the reference targets YWHAZ and ACTB. Normalised relative quantities (CNRQ) for each target was used in subsequent statistical analysis.
Statistical analysis
The RFI was computed for each animal and was assumed to represent the residuals from a multiple regression model regressing ADFI on ADG and MBW using the GLM procedure of SAS. Other data were analysed using the MIXED procedure (SAS Institute Inc., Cary, NC, USA) as a complete randomised design with RFI the main effect and sow included as a random effect. For all parameters examined the individual pig was the experimental unit. The data were checked for normality using the UNIVARIATE procedure of SAS. All data presented in the tables are expressed as least squares means±standard error of the mean (SEM). Means were separated using the Tukey–Kramer method. The probability value, which denotes statistical significance was P<0.05 with a trend denoted as P<0.10. Pearson correlation coefficients among traits were determined using the correlation procedure of SAS.
Results and discussion
In this study the LRFI pigs had an increased CAID of GE, and an improved CATTD of GE, N and dry matter compared to HRFI pigs. An increase in the gene expression of the enzyme SI, and the glucose transporters SGLT1, GLUT2 and the fatty acid transporter FABP2 accompanied this improvement in digestion. These results suggest that improved nutrient digestibility, mediated by changes in enzyme gene expression and intestinal nutrient transporter gene expression may be an important mechanism in the improved feed efficiency in LRFI pigs. The lack of effect of RFI on the weight of small intestine is important as it allows us to hypothesise that LRFI pigs have increased absorptive capacity in the small intestine and HRFI pigs do not compensate by increased size of the intestinal tract. Along with the improvements in nutrient utilisation in the small intestine, LRFI pigs had increased lactobacilli numbers in the caecum which is of interest as lactobacilli spp. have been attributed to increased gut function and health (Stewart, Reference Stewart1997). The results from this study suggest that more efficient pigs have improved nutrient digestibility which can be attributed to changes in multiple physiological variables including improved nutrient utilisation and improved intestinal health.
Performance and feed efficiency
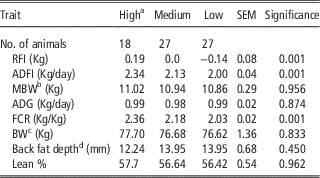
The LRFI ranked pigs had lower ADFI than pigs ranked as MRFI or HRFI (P<0.001; Table 1). On average, the LRFI group consumed 130 and 340 g less feed than the MRFI and HRFI, respectively. The base RFI regression model (ADFI explained by MBW and ADG) accounted for 66% of the variation in ADFI with the remaining 34% of the variation accounted by RFI. This is comparable to results found in RFI selection lines in both Iowa State University in the United States and INRA in France, where both selected large white pigs over multiple generations and 33% of variation in ADFI was due to RFI (Young and Dekkers, Reference Young, Cai and Dekkers2012). This is lower, however, than the value found in two breeds of beef cattle, where 77% of variation in feed intake was due to RFI (Kelly et al., Reference Kelly, McGee, Crews, Fahey, Wylie and Kenny2010). In the current study, RFI was not associated with the phenotypic measurements of ADG (r=−0.06), MBW (r=−0.11) or BW (r=0.05), which is to be expected due to the concept of RFI and the results from previous studies (Mani et al., Reference Mani, Harris, Keating, Weber, Dekkers and Gabler2013). The LRFI pigs had a lower feed conversion ratio (FCR) than MRFI or HRFI pigs (P<0.001). Associations between RFI and FCR were similar (r=0.73) to the values found in previous studies in pigs suggesting that by selecting for FCR you are also selecting for RFI (Saintilan et al., Reference Saintilan, Mérour, Brossard, Tribout, Dourmad, Sellier, Bidanel, van Milgen and Gilbert2013). In the current study, the pigs were selected from terminal sires and the correlations between RFI and FCR are similar to the correlations in the previous study using pigs from terminal sire breeds (Saintilan et al., Reference Saintilan, Mérour, Brossard, Tribout, Dourmad, Sellier, Bidanel, van Milgen and Gilbert2013). The association between RFI and FCR is higher than the value found in numerous studies in beef animals. The fact that correlations between RFI and FCR are higher in pigs than cattle is interesting and could possibly be due to the fact pigs have typically been more intensively selected than beef animals. The RFI value found in this experiment of −140 g/day is in line with previous experiments proving that the pigs in this study are a population of pigs divergent in RFI (Young and Dekkers, Reference Young, Cai and Dekkers2012). In contrast to previous RFI studies (Young et al., Reference Young and Dekkers2011; Mani et al., Reference Mani, Harris, Keating, Weber, Dekkers and Gabler2013; Montagne et al., Reference Montagne, Loisel, Le Naou, Gondret, Gilbert and Le Gall2014) backfat was not included in the model in this study. However, Do et al. (Reference Do, Ostersen, Strathe, Mark, Jensen and Kadarmideen2014) established a correlation coefficient of 0.96 between models with or without backfat, suggesting that the non-inclusion of backfat in this study will not unduly influence the results.
Characterisation of performance, body composition, intake and efficiency (n=75) (least square means and SEM)

RFI=residual feed intake; ADFI=average daily feed intake; MBW=midtest metabolic BW; ADG=average daily gain; FCR=feed conversion ratio.
a High RFI was >0.5 SD above the mean; low RFI was <−0.5 SD below the mean calculated when pigs were 105 days old.
b Day 77 BW was used to calculate midtest metabolic BW (MBW) using a value of BW0.60.
c Carcass weight as recorded on day 115.
d Fat and lean % measured at slaughter.
Nutrient digestibility
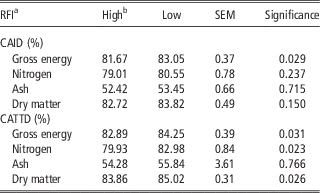
In this study, RFI was negatively correlated with CATTD of both GE (r=−0.51, P=0.06) and N (r=−0.46, P=0.08). This is in agreement with studies in cattle where RFI was correlated with improved dry matter digestibility (Richardson et al., Reference Richardson, Herd, Archer and Arthur2004) and CP (Nkrumah et al., Reference Nkrumah, Okine, Mathison, Schmid, Li, Basarab, Price, Wang and Moore2006). When examining digestibility across RFI groups, the LRFI pigs had increased CAID digestibility of GE (P<0.05; Table 2). There were no differences between RFI groups for apparent ileal digestibility of N, ash or DM (P>0.10). Low RFI pigs had increased CATTD of GE, N and DM (P<0.05). The improvement in the CATTD of GE, N, DM and increased CAID of GE suggest that improved nutrient digestibility is a mechanism involved in the improved feed efficiency in LRFI pigs. The increased nutrient digestibility in the ileum is important because the majority of nutrient absorption in pigs takes place in the small intestine. This is in agreement with work by Harris et al. (Reference Harris, Patience, Lonergan, Dekkers and Gabler2012) where LRFI pigs had improved digestibility of DM, N and GE and a tendency towards improved ash digestibility. In contrast, no difference in nutrient digestibility was previously reported between pigs divergently selected for RFI (Montagne et al., Reference Montagne, Loisel, Le Naou, Gondret, Gilbert and Le Gall2014). Interestingly while the difference between RFI lines for the CATTD of GE was also seen in the CAID, this difference was not seen in the CAID of N. Similar results were seen in a study by Rakhshandeh et al. (Reference Rakhshandeh, Dekkers, Kerr, Weber, English and Gabler2012) where LRFI pigs had improved CATTD with no improvement in CAID. Due to the differences in N digestibility being observed only in the CATTD, this suggests that microbial fermentation may be a major causative factor in these differences. In contrast the improvements in both the CAID and CATTD of GE suggest that improvements in small intestinal absorption are a major driver of these differences in GE digestibility.
Effect of residual feed intake (RFI) on the coefficient of apparent total tract digestibility (CATTD) and the coefficient of apparent ileal digestibility (CAID) (slaughtered (Day 115) (least square means and SEM)

RFI=residual feed intake.
a RFI evaluated when pigs were 105 days old with eight pigs per RFI group.
b High RFI was >0.5 SD above the mean; low RFI was <−0.5 SD below the mean.
Intestinal nutrient transporter and enzyme gene expression
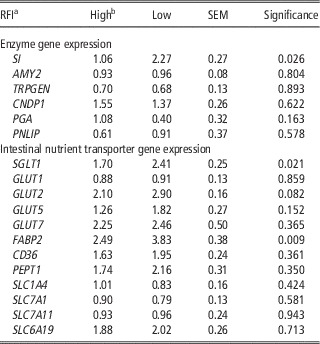
In non-ruminants, carbohydrates are hydrolysed in the intestinal lumen by numerous enzymes including pancreatic α-amylase, sucrase, maltase and lactase, to a number of monosaccharide’s including d-glucose, d-fructose and d-galactose. These monosaccharides are absorbed across the intestinal brush border by monosaccharide transporters. The LRFI pigs had increased gene expression of the enzyme SI (P<0.05; Table 3) and the nutrient transporters SGLT1 (P<0.05), FABP2 (P<0.05) and there was a significant trend in the expression of GLUT2 (P<0.10) in the jejunum. Enzyme gene expression did not differ in the duodenum, ileum or pancreas while intestinal nutrient transporter gene expression did not differ in the duodenum or ileum (P>0.10, Supplementary Tables S4 and S5). These results suggest increased nutrient breakdown and subsequent transport in more efficient pigs. Enzymes are secreted from a variety of tissues including the salivary glands, the stomach and the exocrine portion of the pancreas, while others are found in the luminal membranes and cytoplasm of the cells that line the small intestine. The increased gene expression of SI, which is secreted from intestinal brush border membrane, suggests an increased activity of carbohydrate enzymes in the jejunum leading to increased availability of sucrase and maltase. The gene SI encodes a precursor protein that is cleaved by pancreatic enzymes into two enzymatic subunits sucrase and isomaltase which are responsible for all sucrase activity, 90% of isomaltase activity, and are important in the final digestion of starch. The increased expression of these nutrient transporters and enzymes may partially explain the increased GE digestibility seen in LRFI pigs. The glucose transporter SGLT1 is the major route for absorption of dietary glucose across the luminal membrane of swine enterocytes, while the glucose transporter, GLUT2, is responsible for transporting glucose across the basolateral membrane. Together SGLT1 and GLUT2 are responsible for glucose absorption in the small intestine (Kellett and Brot-Laroche, Reference Kellett and Brot-Laroche2005). The primary role of intestinal FABP2 is in the uptake of fatty acids. Whether increased gene expression levels of SGLT1 and GLUT2 in the jejunum might be responsible for the increased digestibility of GE assessed in the ileum of LRFI pigs remains to be demonstrated. In this study, the effects of differences in RFI on gene expression levels were observed in the jejunum. The reason for this is most likely due to the digestive process still taking place in the stomach and duodenum and the majority of nutrient absorption taking place in the jejunum. There was no effect of RFI on the gene expression of the enzyme and nutrient transporters in the ileum and this is most likely due to the composition of the diet. It is possible that modifications in ileal intestinal nutrient transporters may be observed when less easily digestible diets are fed.
Characterisation of the effect of residual feed intake on the normalized relative abundance of enzyme and intestinal nutrient transporter gene expression in the jejunum (least square means and SEM)

RFI=residual feed intake; SI=sucrase–isomaltase; AMY2=pancreatic amylase 2B; PGA=pepsinogen A; PNLIP=pancreatic lipase; TRPGEN=trypsinogen; CNDP1=carnosine dipeptidase; SGLT1=sodium/glucose co-transporter 1; GLUT=glucose transporter; FABP2=fatty acid binding protein 2; CD36=cluster of differentiation 36; PEPT1=peptide transporter 1; SLC7A1=C6ationic Amino Acid Transporter, Y+System; SLC7A11=anionic amino acid transporter light chain, xc- system; SLC6A19=sodium-dependent neutral amino acid transporter;
a RFI evaluated when pigs were 105 days old with 8 pigs per RFI group.
b High RFI was >0.5 SD above the mean; low RFI was <−0.5 SD below the mean.
Microbiology and volatile fatty acids
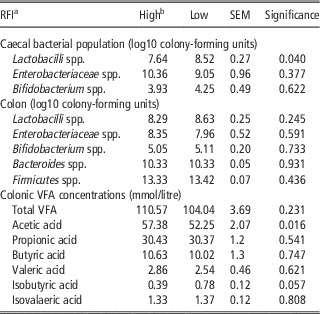
While diet is a significant determinant of the colonic microbiome, the host genetic background and the colonic milieu also exert a strong influence on the microbial composition in the small intestine (den Besten et al., Reference den Besten, van Eunen, Groen, Venema, Reijngoud and Bakker2013). The phyla Bacteroidetes, Firmicutes and Actinobacteria are the most abundant in the pig intestine. The result of fermentation by Bacteroidetes is predominately acetate and propionate, where as butyrate is the primary end product of fermentation by Firmicutes (Macfarlane and Macfarlane, Reference Macfarlane and Macfarlane2003). In this study, LRFI pigs had increased lactobacilli numbers in the caecum compared to HRFI pigs with no differences between the other measured bacteria in either the caecum or colon (P<0.05; Table 4). Lactobacilli are of class bacilli and phylum Firmicutes and have been attributed to increased gut function and health (Stewart, Reference Stewart1997). The increased lactobacilli numbers in the caecum suggests improved intestinal health in LRFI pigs and could contribute to the increased efficiency in LRFI pigs, as increased lactobacilli is known to improve the nutritional value of foods and control intestinal infections (Gilliland, Reference Gilliland1990). While nutrient absorption across the intestinal wall is the dominant method of nutrient utilisation, the intestinal microflora have an important metabolic function in the fermentation of non-digestible carbohydrates into a final product of VFAs, which can subsequently be used as an energy source. The major VFAs (acetate, propionate and butyrate) stimulate epithelial cell proliferation and differentiation in the colon (Peng et al., Reference Peng, He, Chen, Holzman and Lin2007). In this study HRFI pigs had increased production of acetic acid (P<0.05) in the colon (Table 4). Previously Montagne et al. (Reference Montagne, Loisel, Le Naou, Gondret, Gilbert and Le Gall2014) found a similar response in relation to total VFA production, with HRFI pigs having increased total VFA production compared to LRFI pigs. Acetate is the principle VFA produced from the fermentation of non-digestible carbohydrates (Bergman, Reference Bergman1990). As discussed previously, LRFI pigs had improved CAID of GE compared with HRFI pigs suggesting there may be more material available for fermentation in the colon of HRFI pigs. This would explain the increased production of acetic acid in the colon of HRFI pigs.
Effect of residual feed intake on microbial populations and volatile fatty acid (VFA) production (least square means and SEM)

RFI=residual feed intake; VFA=volatile fatty acid.
a RFI evaluated when pigs were 105 days old with 8 pigs per RFI group.
b High RFI was >0.5 SD above the mean; low RFI was <−0.5 SD below the mean.
Organ weights
In a review by Herd and Arthur (Reference Herd and Arthur2009) differences in organ weights were proposed as a mechanism causing differences in feed efficiency. In this study LRFI pigs had reduced visceral organ weight (P<0.05) (entire intestinal tract, heart, liver, kidneys) and reduced heart weight (P<0.05; Supplementary Table S6). However, when organs were expressed on a BW basis there was no difference between RFI groups. When analysing the relationship between RFI and organ weights, RFI was positively correlated with weight of the large intestine (r=0.57). The weight of organs, especially visceral organ mass contributes three times more to maintenance requirements than muscle mass (Noblet et al., Reference Noblet, Karege, Dubois and van Milgen1999). The correlation between RFI and weight of the large intestine could partially explain the increased efficiency in LRFI pigs. The lack of effects on the organs that are involved in nutrient absorption such as the small intestine is important, as an increase in organ weight in the HRFI pigs would suggest an increased surface area for absorption. These results in combination with the results from the nutrient transporters suggest an increased absorptive capacity per unit area in LRFI pigs.
Conclusion
In conclusion, nutrient digestibility was found to be associated with RFI. The results suggest that improvements in nutrient digestibility are mediated by changes in intestinal nutrient transporter and enzyme gene expression as well as altered microbial activity.
Acknowledgements
The author would like to acknowledge Ms Bernie Flynn, Mr Paddy Reilly, Mr David Doyle and Ms Denise Cunningham for their technical assistance in this study. This study was funded under the Earth and Natural Sciences Doctoral Studies Programme, which is funded under the programme for Research in Third-Level Institutions and co-funded under the European Regional Development Fund.
Supplementary Material
To view supplementary material for this article, please visit http://dx.doi.org/10.1017/S1751731116000847