Introduction
The role of the media in contemporary societies is hard to ignore, if only because of the fact that public perception and evaluation of various social phenomena frequently correspond to their presentation and interpretation in the media. Researchers draw attention to a peculiar relation between media discourses and public opinion (e.g. Bullock, Wyche and Williams Reference Bullock, Wyche and Williams2001; Clawson and Trice Reference Clawson and Trice2000; Gilens Reference Gilens1996, Reference Gilens1999; Golding and Middleton Reference Golding and Middleton1982; Lemert Reference Lemert and Kennamer1994; Tipton Reference Tipton and Kennamer1994) as well as (mass) behaviour (e.g. van Ginneken Reference van Ginneken2003). It is, for example, frequently claimed that media portrayal of specific social groups is influential in shaping people's perceptions of those groups – predominantly because of a lack of direct contact and exchange with those groups and ensuing reliance on hearsay and the media as main sources of knowledge about them (cf. McCombs and Reynolds Reference McCombs, Reynolds, Bryant and Oliver2009; Thompson Reference Thompson1995). Researchers stress, among others, the framing function of the media, claiming that repeated presentation of specific issues in connection with their attributes is likely to result in audience members choosing those attributes in evaluating the issues in question (e.g. Entman Reference Entman1989; McCombs and Reynolds Reference McCombs, Reynolds, Bryant and Oliver2009; McQuail Reference McQuail2010; van Ginneken Reference van Ginneken2003). Moreover, by providing information on society at large, ‘media voice current norms and values and present an image of life in a particular society’ (Peeters and d'Haenens Reference Peeters and d'Haenens2005: 202), thus helping to establish and maintain relations between various social groups, such as between various ethnic groups, or between younger and older generations. By the same token, they may also disturb the formation or preservation of such relations.
The current study rests on the assumption of an active role of the media in the processes of the (re-)establishment of group boundaries and, in consequence, in reinforcing and/or hindering the creation and/or maintenance of social relations between specific groups, and in particular between older and younger people. Indeed, considering the prevalence of age-segregation in virtually all domains of social life, including institutional and spatial arrangement (Hagestad and Uhlenberg Reference Hagestad and Uhlenberg2005, Reference Hagestad and Uhlenberg2006), and the resulting infrequency of direct contacts between younger and older people (Uhlenberg and de Jong Gierveld Reference Uhlenberg and de Jong Gierveld2004; Vermeij Reference Vermeij, van den Broek, Bronneman-Helmers and Veldheer2010; cf. van Selm, Westerhof and de Vos Reference van Selm, Westerhof and de Vos2007), it is plausible that it is predominantly through the media that a socially shared matrix of intergenerational relations is constructed and/or reinforced; if not directly – e.g. by disseminating specific patterns of behaviour, then indirectly – by propagating specific (group) stereotypes.
Strikingly, the two groups of interest in this study – older and younger citizens – have received rather meagre amounts of attention from media analysts in the Netherlands. Investigation of the Dutch media (re-)construction of older people has been restricted to a series of studies of television commercials (e.g. van Selm and Westerhof Reference van Selm and Westerhof2008; van Selm, Westerhof and de Vos Reference van Selm, Westerhof and de Vos2007; van Selm, Westerhof and Wester Reference van Selm, Westerhof and Wester2009) and there have been few published studies on the media portrayal of youth (Cornelissen Reference Cornelissen2000; de Bruin Reference de Bruin2005; Verhagen Reference Verhagen, ter Bogt and Hibbel2000; Wierstra Reference Wierstra2001). However, taken internationally, the results of past inquiries into the media representation of older and younger generations show considerable correspondence, not only across studies devoted to either of the groups, but also across the two groups. In the light of existing research, both older citizens and younger (adults) appear to be the object rather than the subject of media reporting, deprived of voice and the opportunity to express their perspective on the issues reported (e.g. Bernier Reference Bernier2011; Cornelissen Reference Cornelissen2000; Hartley in Mazzarella Reference Mazzarella and Valdivia2003: 236; cf. Levinsen and Wien Reference Levinsen and Wien2011; Wierstra Reference Wierstra2001). Also, both age groups tend to be portrayed by the media in a negative manner, either through explicitly negative claims or through association with negatively tinted issues. In the case of older people, most common are the depictions of weakness, frailty and infirmness, frequently related to unattractiveness, on the one hand (e.g. Moutner Reference Moutner2007), and victimhood, vulnerability and dependence, on the other (Fealy et al. Reference Fealy, McNamara, Treacy and Lyons2012). This focus on non-self-sufficiency and incapability of autonomous living helps to construct older people as a problem and a burden to their families, communities and society at large (e.g. Martin, Williams and O'Neill Reference Martin, Williams and O'Neill2009; Rozanova Reference Rozanova2006; Zhang et al. Reference Zhang, Harwood, Williams, Ylänne, Wadleigh and Thimm2006). Younger people, on the other hand, are presented predominantly in the context of crime, accidents or moral decay, and problematised as ‘troubling’ and/or ‘troubled’; simultaneously a source and an object of public concern (Delvin Reference Delvin2005, Reference Delvin2006; Wayne et al. Reference Wayne, Henderson, Murray and Petley2008; cf. Bernier Reference Bernier2011).
Remarkably, inquiry into the media representations of older and younger people has seldom been undertaken within a framework that allows (systematic) inter-group comparisons. Few attempts have been made to establish the ‘rank-order’ of under-representation, lack of prominence and/or negativity in media construction of the two groups and thus authorise conclusions as to the nature of presentation vis-à-vis one another. Moreover, only one such study has been conducted with respect to various age groups in the Netherlands (Wierstra Reference Wierstra2001). Yet, looking into the differences in the (media) depictions of various (age) groups is of vital importance for a number of reasons.
First, in accordance with the Stereotype Content Model (Cuddy, Fiske and Glick Reference Cuddy, Fiske and Glick2008; Fiske, Cuddy and Glick Reference Fiske, Cuddy and Glick2006), not all seemingly negative (positive) images are equally or rather similarly negative (positive). In fact, few groups enjoy unequivocally negative or positive stereotypes. Usually, individuals and groups are rated differently on two separate dimensions of stereotypic evaluation – 'warmth’ and ‘competence’. Older people, for example, tend to be rated high on traits related to warmth (e.g. they are often seen as benevolent, generous, helpful or kind) and low on traits associated with competence (e.g. they are frequently stereotyped as forgetful, conservative, narrow minded or dependent). Some ethnic minorities, on the other hand, e.g. Jews and Asians in the United States of America, are likely to be seen as highly skilled, talented and determined (i.e. competent) yet at the same time judged asocial, unfriendly, hostile or even aggressive (i.e. cold). In general, unequivocally negative stereotypes – negative evaluations on both dimensions (i.e. being considered cold and incompetent) – are reserved for groups seen as parasitic, whereas unequivocally positive stereotypes (i.e. being seen as warm and competent) are set aside for the in-group and the high-status (reference) groups.
Second, the content of stereotypes is of paramount importance to the nature of social interactions (Cuddy, Fiske and Glick Reference Cuddy, Fiske and Glick2008; Fiske, Cuddy and Glick Reference Fiske, Cuddy and Glick2006). Specific, usually ambivalent, stereotypes elicit unique emotional reactions, which in turn evoke distinctive patterns of behavioural responses. For example, groups stereotyped as incompetent and cold elicit contempt and disgust, which might lead to harassment or even violence; groups stereotyped as competent yet cold elicit envy, which evokes reactions of obligatory association and convenient co-operation (yet, only as long as the sense of threat remains low); groups seen as warm but not competent elicit pity, which often results in neglect; and groups perceived as warm and competent evoke admiration and elicit reactions of voluntary association and help.
Informed by the insights regarding a relationship between the content of stereotypes and the nature of social interactions, on the one hand, and the active role of the media in the formation and maintenance of stereotypes, on the other, the present study constitutes an attempt to fill the gap in the existing research and to reconstruct the (dominant) re-presentations of Dutch older and younger generations vis-à-vis one other. Since special attention is paid to the mediated distinctiveness of the age groups, the results of the study are interpreted in the light of literature on social distance and (social) practices of ‘othering’.
Social distance, the practices of ‘othering’ and the mass media
The most widespread conception of social distance stresses its relational, affective and subjective nature, and relates to the degree to which individuals and groups within a society feel sympathy towards one another and/or the extent to which they are prepared to interact, e.g. as marriage partners, neighbours, friends, colleagues, etc. (Bogardus Reference Bogardus1925). Nonetheless, Karakayali (Reference Karakayali2009: 541) draws attention to the normative dimension of social distance that relates to the ‘collectively recognised norms about membership status in a group’. As a set of norms specifying the distinctions between ‘us’ and ‘them’, social distance is then conceived as a non-subjective, structural aspect of social relations, knowledge that society socialises to its members. As such, social distance – and the various strategies of distancing – are traceable in the cultural production of a society, including the (mass) media.
Indeed, even though the concept of social distance remains routinely beyond the theoretical framework of media analysts, a number of (recent) studies on the media construction of various social groups draw attention to the media practices of ‘othering’, i.e. practices of setting a social group apart as different. For example, when analysing the various elements of Irish print media portrayals of older people, Fealy et al. (2012: 96) noted the dominant position of the ‘discourse of otherness’, which positioned older people as a ‘distinct social category’ and ‘a group outside of, or different to, the average citizen’. Also, youth, presented in the context of their shortcomings, troubles and transgressions, have become the ‘other’; ‘a group to be protected, saved and/or feared’, consigned to the structural position of ‘theydom’ (Hartley discussed in Mazzarella Reference Mazzarella and Valdivia2003: 233; Mazzarella Reference Mazzarella and Valdivia2003).
The various practices of ‘othering’ identified by media analysts correspond by and large to the strategies of ‘distancing’ identified by researchers on social distance (e.g. Fine Reference Fine, Denxin and Lincoln1994; Hall Reference Hall and Hall2002; Krumer-Nevo and Orly Reference Krumer-Nevo and Orly2010; Tajfel Reference Tajfel1982). They include, among others, the use of group labels (e.g. ‘the pensioners’, ‘the over-seventies’), homogenisation and the ignoring of the within-group diversity (Fealy et al. Reference Fealy, McNamara, Treacy and Lyons2012), the predominantly negative evaluations (Rozanova Reference Rozanova2006), problematisation or even – especially in the case of (ethnic) youth – criminalisation (Faucher Reference Faucher2009; Mazzarella Reference Mazzarella and Valdivia2003).
The aim of the present study is to trace how the different strategies of ‘othering’ or ‘distancing’ are applied by Dutch news media in their (re-)construction of two age groups – older and younger people. Specific research questions addressed in the study relate to the visibility and prominence of the two age groups in the news media coverage and the nature of their presentation. The latter is assessed with respect to the homogeneity of presentation and evaluation, where evaluation is explored on two dimensions: warmth and competence.
Data and method
Analyses presented in this article constitute a part of a broader project, aimed at the re-construction of the media images of various social groups in the Netherlands, including older and younger people as well as ethnic minorities. To assess the dominant media images of the groups under study, a content analysis of daily newspapers, television news editions and an on-line news engine in two research periods was carried out. The sample consisted of news items from the most widely used sources of (political) information, including two national newspapers, de Volkskrant and de Telegraaf; two broadcasting news programmes, NOS journaal (8 pm edition) and RTL nieuws (7:30 pm edition); and the most popular internet news provider nu.nl. The two research periods selected for the analysis encompassed a period of a pre-election campaign and a period following the formation of the new government.Footnote 1 The relevant articles and television news items were selected on the basis of their verbal content, i.e. the presence of specific key terms. Only articles and news items that mentioned (a) human being(s) (actors), such as ‘the elderly’ (de bejaarden) , ‘old-age man/woman’ (oudere man/vrouw), ‘seniors’ (senioren), ‘baby boomers’, ‘pensioners’ (gepensioneerden), ‘[aged] 65+’ (65-plussers), ‘a young girl/man’ (jonge vrouw/man), ‘youth’ (jeugd), ‘students’ (studenten), ‘pupils’ (leerlingen), etc., were included in the sample. This eliminated from our analysis a large pool of articles and news items that referred to abstract concepts and phenomena, such as ‘pension arrangements’ or ‘ageing’, yet contained no human actors. In principle, to be selected for coding, actors had to meet specific age criteria (younger: 15–35 years of age, or older: 55+). This meant that actors described as ‘young’ or ‘students’ yet aged 15 or less were not coded. However, actors referred to as ‘young’ whose exact age was not reported and could not be inferred from the context were always coded. The television news items were additionally coded for their non-verbal (visual) content, such as the presence of attributes which suggest weakness, frailty or infirmness (e.g. a wheelchair, a walking frame) or clues suggesting a specific context of the presentation (e.g. an arrest, a medical intervention, a social occasion).
For reasons of comparability, actors described as belonging to an ethnic minority (e.g. ‘immigrant youth’, ‘Turkish elderly’, ‘a Muslim girl’, ‘minority students’) have been removed from the current analyses. The decision was driven by their virtual absence among older adults, coupled with the relative over-representation of the ethnic youth in the original sample. Since the media portrayal of ethnic youth tends to be more negative than their depictions of youth who are not from ethnic minority groups (e.g. Cushion et al. Reference Cushion, Moore and Jewell2011; Wayne et al. Reference Wayne, Henderson, Murray and Petley2008), it was expected that the over-representation of ethnic youngsters in the sample could have produced biased results. Finally, the analyses reported here have been conducted on a sub-sample consisting of 354 news items and excluding persons portrayed as being from ethnic minority groups.
Sample and relative media visibility of different groups of the population under study (old versus young)

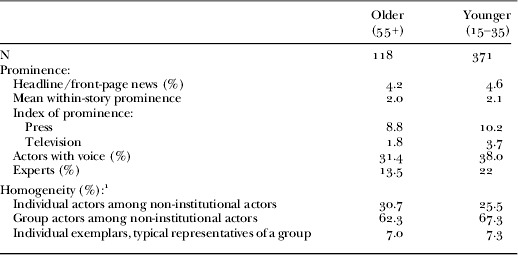
Note: 1. The sample consists of actors that could be classified as ‘younger’ or ‘older’ on the basis of either age or some other age indication, e.g. described as ‘youth’ or ‘elderly’.
Source: 2. http://statline.cbs.nl (Dutch population per month, data for 1 January 2011, accessed 29 November 2013).
All the news items and actors were analysed by means of content analysis. Content analysis is frequently conceptualised as a quantitative technique which allows a systematic study of large corpuses of text (e.g. Neuendorf Reference Neuendorf2002: 10). At the same time, a growing number of studies apply various forms of qualitative, or interpretative, content analysis (cf. Wester, Pleijter and Renckstroft Reference Wester, Pleijter and Renckstroft2004). In the current study, the two approaches – quantitative and qualitative analysis – are combined.
The coding of the material selected for the analysis was conducted in two steps. In step one, a rigorous quantitative analysis was completed by the author and two trained coders. The coding conducted at this stage could be conceptually divided into two levels. The first level, called the ‘news-item level’, involved coding of the general information about the article or television news item and its focus (topic) and entailed a holistic look at the various elements of the news story. At the second level, ‘the actor level’, the news story was broken into utterances (acts of speech, claims) based on the characters they described or evaluated. The inter-coder reliability tests conducted on a sub-sample of 12 per cent of news stories, randomly selected from the news items included in the sample, produced Krippendorff alpha ranging from 0.76 to 1.00 for the measures relevant to the analysis.
In the second step, the statements extracted verbatim from the news messages in step one of the coding (as evidence of a negative, positive or ambivalent depiction of an actor) as well as the comments generated by the coders with respect to every coded actor were re-coded by the author as to the valence (positive versus negative) and the dimension of evaluation (warmth versus competence).
Operationalisation of key variables
Visibility and prominence
Visibility of various groups was measured by a number of news stories featuring a specific type of actor. The prominence of various groups was measured as: (a) the ratio of front-page articles (in printed and online news) or headline news (in visual media) to the total number of stories per group; (b) the relative importance of actors within the news stories on a scale from 1 to 3, where 1=detail and 3=focus of the story; (c) an index of prominence equal to ‘relative importance’ (on a scale from 1 to 3) multiplied by the length of the story (measured by number of words in the body text of the story or the number of seconds in television news items) and divided by 100; (d) the proportion of actors within each category that is given the opportunity to express their views; (e) the proportion of ‘expert’ speakers among the actors with voice (per category).
Homogeneity of presentation
The degree of homogeneity of presentation was measured by the proportions of various types of actors per category. Here, a distinction was made between individual actors, individual exemplars (representatives of a wider category) and group actors.
Evaluation – valence
Negative evaluation was measured through a series of variables, including: (1) featuring in an article with a ‘negative overall theme’, where ‘negative theme’ included public order, conflict and defence, demonstrations, ageing, accidents and catastrophes in ‘broad’ conceptualisation; and public order, conflict and defence, and demonstrations in ‘narrow’ conceptualisation; (2) presentation as a perpetrator, where 0=not reported as a perpetrator and 1=reported as a perpetrator; (3) presentation as a victim of a crime or maltreatment, where 0=not reported as a victim and 1=reported as a victim; (4) presentation as a beneficiary of public goods, where 0=no beneficiary and 1=beneficiary; (5) other explicitly negative qualifications, where 0=no negative qualification and 1=negative qualifications.
Positive evaluation was measured by a dummy pertaining to explicitly positive qualifications, where 0=no positive qualification and 1=positive qualification. Both positive and negative evaluations were re-coded on the basis of statements extracted from the news messages in the process of coding as well as the comments/notes generated by the coders, along two dimensions: warmth and competence.
Evaluation – dimension
A positive evaluation was considered indicative of the benevolence (warmth) of the actor if his/her character, behaviour or intentions were described in terms of friendliness, kindness, agreeableness, helpfulness, charity, honesty and trustworthiness; it was considered indicative of the competence of the actor if their character, behaviour or intentions were described as (indicative of being) smart, motivated, devoted, persistent, skilful, industrious, intelligent, full of vitality, etc.
A negative evaluation was considered indicative of the coldness of the actor if (s)he was presented as unfriendly, disagreeable, unkind, dishonest, free-loading, abusive, aggressive, hostile, threatening, etc.; it was considered indicative of the incompetence of the actor if they were portrayed as foolish, unintelligent, careless, forgetful, weak, etc. Any reference to physical disability, infirmness and/or mental or physical vulnerability (e.g. loneliness, addiction to alcohol) was coded under incompetence, which included also references to prolonged or protracted education (in the case of students). The latter might appear arbitrary. Protracted education might be also interpreted as free-loading and associated with lack of benevolence.
A number of evaluations were coded as mixed/ambivalent qua dimension of evaluation. These were evaluations which included elements of both warmth and competence or were difficult to classify (e.g. ‘such a fresh girl, a good addition to our team’). Descriptions that included both positive and negative elements were coded twice – as positive evaluations (warm, competent or mix) and as negative evaluations (cold, incompetent or mix).
Findings
Visibility and prominence
Information on the structure of the sample included in the current analysis, together with the information about the actual share of the relevant groups in the Dutch population, provides an indication on their relative visibility in the news media coverage. As demonstrated in Table 1, the younger actors are clearly over-represented (almost 78% of characters in the sample are younger as compared to 46% in the relevant sub-group of Dutch population), whereas the older characters are visibly under-represented (22% in the media versus 54% in reality). This pattern reveals the greater conspicuousness of younger than older persons in the Dutch news media. Interestingly, this conspicuousness is not confirmed in the analysis of the media prominence of the actors.
In general, the prominence of characters in the news media can be inferred from the prominence of the items in which they feature (e.g. on the front page in the case of newspapers or in the headlines in the case of television news) and their relative importance within the news story (see Table 2). Of all the actors coded, only 22 appeared in front-page articles or in the headlines of television news editions, 17 of which were younger and five of which were older. This could indicate greater conspicuousness of younger actors in the news reporting. However, if we consider the ratio of prominent to non-prominent actors per group under study, the difference between the older and younger characters appears negligible and is statistically non-significant.
Relative prominence of different groups (older versus younger people)
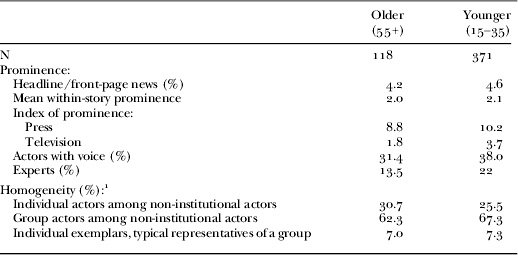
Note: 1. Results with respect to homogeneity are based on a diminished sample (N=114 for the older and N=330 for the younger population).
Significance level: Differences between the groups under study are statistically non-significant (t-test and Pearson's chi-square: p>0.05).
The prominence of the actors can also be detected by comparing their relative importance within news stories. The comparison of the average amount of ‘news space’ devoted to specific groups of actors does not reveal any statistically significant differences between the groups under study. Even when the length of the news item is taken into account – after all, it is not the same to be the focal point of a short agency news item and an extended feature article – the difference in average within-story importance between the older and younger characters remains statistically non-significant across both print and visual news media.
Finally, the prominence of the actors can be measured by whether or not they are given the possibility to contribute to the story by expressing their views and/or commenting on the events/problems described. An examination of the proportion of actors who are indeed given such a possibility reveals no statistically significant differences between the older and younger actors, even though the former are quoted or paraphrased slightly less often than the latter.
Homogeneity
Most of the actors analysed are group actors, described as: the elderly, students, the inhabitants of a specific elderly house, criminal youth, etc. Of the individual actors that feature in the news items analysed, most are individual human beings presented as of interest in their own right; a small proportion of actors are individual exemplars, typical representatives of a group to which they belong (e.g. a student quoted to present the point of view of the majority of students). A negligible proportion of actors are presented as members or spokespersons of various organisations.
When we focus on the non-institutional actors (Table 2), there are hardly any differences in the presentation of older and younger people: 67.3 per cent of the younger and 62.3 per cent of the older characters are group actors, 30.7 per cent of the older and 25.5 per cent of the younger characters are individual actors, and 7 per cent of the older and 7.3 per cent of the younger actors are presented as individual exemplars of the group to which they belong. The differences between the older and younger characters are statistically insignificant.
Evaluation
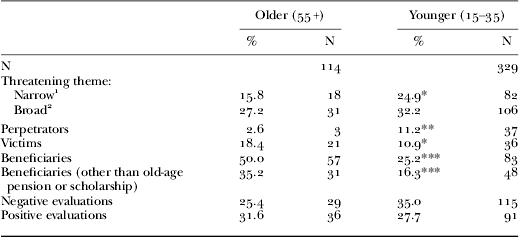
The differences in the media representation of various age groups become most apparent when we consider the various aspects of their (negative) evaluations. As illustrated by results in Table 3, the youth are presented in a (much) more unfavourable light than older generations.
Differences in the evaluation of various groups: percentage and absolute number of actors with a given characteristic
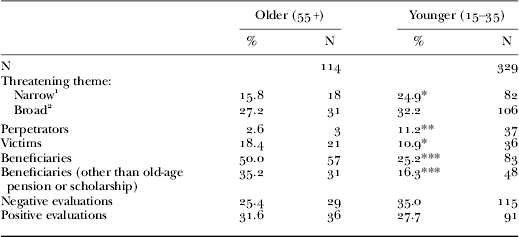
Notes: Samples are limited to non-institutional actors. 1. Narrow theme includes themes regarding public order, conflict and defence, and demonstrations. 2. Broad theme includes themes regarding public order, conflict and defence, demonstrations, ageing, accidents and catastrophes.
Significance levels: * p⩽0.05, ** p⩽0.01, *** p⩽0.001 (Pearson's chi-square).
This is reflected in a number of overtly negative statements (percentage negative). Younger actors are more often ascribed an explicitly negative characteristic or behaviour than older actors (35% versus 25.4%, respectively). Also, younger people are 4.3 times more often than older people represented as perpetrators or public order offenders. They are also more often associated with ‘threatening’ themes (public order, conflict and defence, or demonstrations). Yet, interestingly, once the repertoire of negatively loaded themes is broadened to include ‘ageing and ‘accidents and catastrophes’, the difference between the younger and older characters disappears. This could indicate that the meaning of ‘negative’ or ‘threatening’ may be relative and may depend upon the group under investigation. Last but not least, the older actors are twice as often as the younger characters represented as beneficiaries of the social security system or broadly understood public funds, which – in the context of the on-going debates on austerity measures and the negatively slanted discussions on the social security abuse by migrants, might convey an air of negativity. This difference does not disappear when actors receiving the age-related quasi universal (non-means-tested) benefits (old-age pension or student grants) are eliminated from the analysis.
Noteworthy is that both the younger and the older actors receive an equivalent amount of positive attention.
The dimensions of evaluations
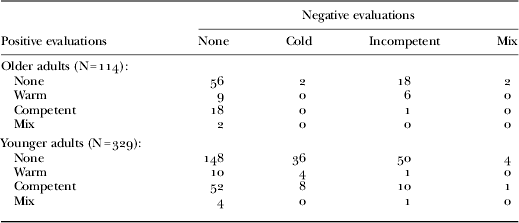
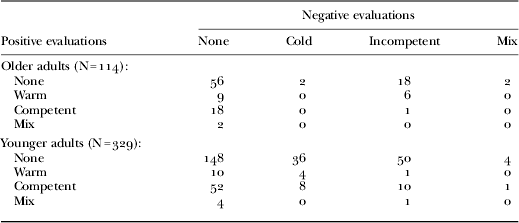
As could be expected on the basis of the Stereotype Content Model, the content of both positive and negative evaluations differs substantially per group analysed (see Table 4). Among the negative depictions of the older characters, dominate the descriptions of sickness, poor health, infirmness, physical, mental and emotional vulnerability, all of which could be regarded as signs of incompetence (Cuddy, Fiske and Glick Reference Cuddy, Fiske and Glick2008; Cuddy, Norton and Fiske Reference Cuddy, Norton and Fiske2005; Fiske, Cuddy and Glick Reference Fiske, Cuddy and Glick2006). In the case of younger actors, the negative descriptions touch almost as often upon hostility and/or problematic and threatening behaviour as upon lack of skills, motivation and/or capabilities (where the latter includes descriptions related to prolonged education), which could indicate a more varied depiction of younger characters than of older actors. This pattern changes, however, when positive evaluations are examined. Once awarded a positive evaluation, younger actors appear exceptionally competent yet not necessarily very warm, whereas older characters appear both warm and competent. This could imply substantial complexity of the evaluative (re-)construction of both older and younger people in the media, with older individuals being relatively often associated with positive counter-stereotypes (competent) and younger persons with negative counter-stereotypes (incompetent). At the same time, however, our results do not depart substantially from the socially dominant representations: senior actors are more often presented as incompetent (negative evaluation) than younger characters, while younger actors are more frequently depicted as competent (positive evaluation). Furthermore, younger actors are more often associated with unfriendliness or even hostility (‘not warm’) than older characters, whereas older actors are far more readily presented as warm and friendly than younger actors. We can therefore conclude that the presence of counter-stereotypes (‘seniors are active and clever’) does not actually challenge the relative position of older people on the two stereotype dimensions – in relation to younger actors, older characters are more often presented as warm and less often as competent.
Frequency of various types of evaluations per age group
Summary and discussion
Based on the assumption of a relationship between the content of stereotypes and the nature of social interactions, on the one hand, and the active role of the media in the formation and/or maintenance of stereotypes, on the other, this research aimed to investigate the images of two age groups, younger and older people, in a selection of Dutch news media. The analysis showed an imbalance in the visibility of the two age groups relative to their share in the Dutch population. While younger actors were clearly over-represented in the media material analysed, the older actors were under-represented. As far as the content of the presentation is concerned, the most notable discrepancies in the media portrayal of the older and younger actors appeared in (the nature of) their evaluation.
In the light of the socio-psychological literature, and especially literature on social distance, the perceptual invisibility (or its opposite: hyper-visibility) of certain groups, their homogenisation and/or (indiscriminate) negativity of depiction could be indicative of the groups’ (social) estrangement and (cultural) ‘otherness’, and suggestive of social distance between the group(s) and the (social or cultural) majority. Although the present study has not, indeed, given the nature of the data, could not have aimed at establishing (the degree of) social distance between the various groups under study and/or between those groups and the imagined/assumed majority (i.e. the public of mainstream media), the results obtained can be used to determine which social groups, if any, are more vulnerable to ‘othering’ in the Dutch media and more in danger of being constructed as socially distinct, different or even deviant.
Comparison of their prominence in national news media gives little support for the media ‘estrangement’ of either the older or the younger generations. Also the level of homogeneity in their description is similar for both groups. Some differences appear only with respect to their overall visibility in the national news media coverage and their evaluation. The under-representation of older actors relative to younger characters might indeed, at least at first sight, suggest a greater ‘estrangement’ of older people. Since the ‘other’ is typically denied visibility and voice, the virtual invisibility of older characters could be a sign of their ‘othering’ and setting aside as more ‘distinct’ than the youth. On the other hand, however, given the sampling procedure and the fact that the sample included only the actors whose age category was explicitly mentioned, the under-representation of older actors may in fact testify to their ‘normalisation’ (in media discourse) as evident from their infrequent description in terms of specific age categorisation, or in other words: non-labelling.
Of far more consequence for the processes of ‘othering’ might be differences in the evaluations of older and younger people. The core of the difference lies, however, not that much in the number of negative or positive evaluations as in their nature. The negative descriptors of older characters seem to relate more often to their (alleged) incompetence (poor health, infirmity, special social needs and dependencies), whereas negative depictions of younger actors appear predominantly related to their lack of warmth (hostility, problematic or threatening behaviour). In the case of positive evaluations the reverse is true: older characters are more often than younger characters presented as warm and younger people are more often presented as competent. Still, the incidence of positive counter-stereotypes is higher for older than for younger actors: senior characters are more often presented as competent (53% of all the positive evaluations of older characters refer to their competence) than younger actors as warm (only 17% of all the positive evaluations of younger actors pertain to their benevolence). This subtle difference might be of paramount importance.
Firstly, research on the content of stereotypes shows that ‘a person perceived as cold may sometimes behave in moral-sociable ways, but will continue to be perceived as unfriendly and untrustworthy’, whereas ‘a person perceived as incompetent, who presumably lacks the ability, can never behave competently without challenging the perceived incompetence’ (Cuddy, Fiske and Glick Reference Cuddy, Fiske and Glick2008: 92). Secondly, both the negative warmth stereotype and the positive competence stereotype appear to be transitive (or ‘contagious’) and spread from one ‘infected’ individual to other individuals in a social network. Hence, it is enough to know one competent older individual to begin doubting the incompetence of all the older people in one's network. In contrast, it is sufficient to be exposed to one hostile or problematic youngster to question the benevolence of other youngsters in one's network. This illustrates the relative strength and stability of stereotypes related to judgements of hostility and non-benevolence and the relative mutability of judgements pertaining to competence. Thirdly, judgements of warmth carry more weight in inducing certain affective and behavioural reactions than judgements of competence (e.g. Lee and Fiske Reference Lee and Fiske2006). In other words, a group perceived as warm is more likely to experience facilitating behaviour than a group perceived as competent; at the same time a group perceived as cold is more likely to experience harm than groups seen as incompetent.Footnote 2
Conclusions
The analyses reported in this paper indicate noteworthy differences in the media representation of various age groups that might contribute to the collective drawing and/or reinforcing of group boundaries. While the differences might be inconspicuous, they are likely to have a lasting influence on the creation and/or maintenance of group relations. Of particular relevance here is the media propensity to evaluate youth with reference to their alleged (lack of) warmth. This is not a trivial finding. According to social psychologists, in-group members tend to be evaluated primarily with respect to competence, while the evaluation of the members of the out-group appears to be determined by their perceived warmth (e.g. Phalet and Poppe Reference Phalet and Poppe1997). This is related to the fact that ‘competence-related terms are more accessible [as most salient and relevant] in the actor [in-group] than the observer [out-group] perspective, whereas moral categories are more accessible in the observer [out-group] position’ (e.g. Wojciszke Reference Wojciszke1994: 230), but also to the fact that competence-related attributes are self- and in-group profitable (the actor and the group gain from efficiency), whereas moral (warmth) attributes are other-profitable (whether the actor is honest or friendly is more relevant for the other than for the actor him-/herself) (Phalet and Poppe Reference Phalet and Poppe1997). Therefore, if interpreted in the light of socio-psychological literature, the present findings could indicate some sort of bias concealed in the media messages that is particularly detrimental to youth.
However, one has to keep in mind that the results with respect to the dimensions of evaluations are based on a qualitative analysis of a relatively small number of evaluative judgements. In most of the messages analysed, the descriptions of the actors did not include any evaluative elements and/or included an ambivalent judgement. Particularly problematic for the coding was the inconsistency between the actor-bound characteristics and the context-bound characteristics, i.e. connotations inherent in the message in which the actor was presented (for similar observations related to the coding of the two stereotype dimensions in the media content, see van Selm, Westerhof and Wester Reference van Selm, Westerhof and Wester2009). While character-bound descriptions constituted the first-choice basis for the current coding, the context of reporting should not be ignored. After all, negative perceptions of and feelings towards the object of description may arise not only from the explicitly negative statements but also from the sheer association with negatively evaluated social phenomena, such as conflict, drama, controversy, violence or deviant behaviour (e.g. d'Haenens and Bink Reference d'Haenens and Bink2006), but also ageing (Martin, Williams and O'Neill Reference Martin, Williams and O'Neill2009).
Acknowledgements
The research reported in this paper was supported by Stichting Instituut GAK (grant number STIG/BK/09040008).