


1. Introduction
Nearly 20 years ago, Murozumi and others (1969) showed that Pb concentrations in Greenland ice had increased about 200-fold since ancient times. Several groups have attempted to extend this work to other elements, and to the Antarctic. However, recent reviews (Wolff and Peel 1985[b], Boutron 1985) have concluded that most of the data obtained since 1969 have been incorrect because of contamination. Only recently have the necessary clean-sampling and analysis techniques been understood, mastered and applied by snow chemists. Boutron and Patterson (1986) have now successfully established the changes in Pb concentration that occurred in Antarctic snow at the end of the Wisconsin glaciation. This has allowed them to define the natural sources of Pb emissions to the atmosphere. However, there is still no reliable time series for Pb in Antarctic snow throughout the industrial period, and for other heavy metals only a few surface values exist that appear to be reliable (Wolff and Peel 1985[a]).
For Greenland, the situation is equally bleak. Apart from the work of Murozumi and others (1969) and Ng and Patterson (1981) on Pb, no data can be considered with confidence. A few data that appear to be reliable have been presented for surface samples from the eastern Arctic Ocean (Mart 1983).
There is, therefore, still a considerable need for reliable time-series data for both polar regions. We have been able to take advantage of an opportunity to collect near-surface snow in Greenland. We present this limited data set, and tentative conclusions from it, in the hope that it will provide a reliable base for more detailed studies later.
2. Experimental Procedures
2.1 Sampling
Samples were collected in June 1984 at site 20D, which is 36 km south-west of Dye 3 in south Greenland (Fig. 1). A scientist, wearing full clean-room clothing, took the samples from a clean sector established up-wind of other field activities. Three steps, each 45 cm in depth, were dug from the surface, using an aluminium shovel, and each horizontal surface was scraped to a depth of a few centimetres with a pre-cleaned PTFE plate. One end of a pre-cleaned acrylic tube 8 cm in diameter was opened, and the tube was forced vertically downwards into each step. The tube was levered out, capped, and finally bagged in polyethylene sleeving. Six tubes were collected, containing two parallel sequences through a snow depth of about 1.3 m from the surface; this should represent just over one year’s snowfall. The samples, in an insulated box, were buried before uplift from the field and transport to Europe. The warmest temperatures were experienced in the field, where daytime air temperatures may have approached 0°C at times. The acrylic tubes and PTFE scraper had been cleaned by immersion for at least 12 h in each of six acid baths (Wolff and Peel 1985[a]).
Map of Greenland, showing sampling sites mentioned in this paper.

2.2 Sub-sampling and analysis
Most of these procedures are described in detail elsewhere (Wolff and Peel 1985[a]).
Samples were kept fozen at −20 °C until analysis. To avoid contamination from the outside of the samples, each “core” was sub-sampled (on a clean-air bench in a −20 °C cold-room) through a freshly prepared surface. The surface was formed by splitting the “core” as it straddled two acrylic tubes. Sub-samples were taken by pushing a pre-cleaned PTFE cylindrical beaker (38 mm inside diameter, 68 mm deep) into the centre of the surface. A smaller (8 mm ID) sub-sampler was also used to take material at various positions across the sample (Wolff and Peel 1985[a]). The residues after sub-sampling were used for oxygen-isotope analysis.
Samples were melted in a microwave oven, and acidified to pH 3. Analyses of Al and Zn were carried out by multiple direct injections (up to 10 × 50 μl aliquots) into a flameless atomic absorption spectrometer (AAS) (Baird Atomic A5100/A347O). Detection limits, dependent on the number of injections, were about 400 pg g−1 Al and <1 pg g<1 Zn. This method was also used for some preliminary analyses of Cd, Cu and Pb in the larger sub-samples and (where volume permitted) for analyses of one or more of these elements in the smaller sub-samples. Although this method usually only provides upper limits for Cd (∼1 pg g−1), Cu (∼20 pg g−1) and Pb (∼30 pg g−1), it also provides an independent check on the results obtained using pre-concentration.
The main analyses for Cd, Cu and Pb on the large sub-samples were carried out by pre-concentrating the metals for 60 min on to tungsten (W) wire loops before analysis by flameless AAS (Wolff and Peel 1985[a], Wolff and others 1981). Detection limits were 0.10 pg g−1 Cd, 0.8 pg g−1 Cu and 2.0 pg g−1 Pb.
For the large sub-sampler, the total procedural blank (from the sub-sampling stage onwards) is <150pg g −1 Al, <0.13pg g−1 Cd, <l pg g−1 Cu, 3 pg g−1 Pb and 2.5 pg g−1 Zn (Wolff and Peel 1985[a]). The blank in the smaller sub-sampler is about double these values. Blanks have been subtracted from all the data presented. Contamination introduced prior to sub-sampling is not included here, and can be assessed only by measuring profiles of concentration across samples, as discussed in section 3.1 below.
One sample was analysed for Pb by isotope-dilution mass spectrometry (1DMS). Three adjacent sub-samples were taken, and pooled together into a conventional polyethylene bottle cleaned in the lead-isotope laboratory at California Institute of Technology. The bottle was transported to that laboratory and analysed for Pb only, after acidification to ∼pH 2, using the techniques described by Boutron and Patterson (1983).
3. Results
3. 1 Contamination
One full profile of concentration across a sample was obtained for Zn, using the small sub-sampler. An approximately constant concentration (of 20 ± 6 pg g−1) was measured across the core, including the outer surface. For other samples, small sub-samples were taken near the outer surface and analysed for single elements. In every case the concentration was below the detection limit for direct multiple injections. These results, taken together with the fact that the samples showed no evidence of even limited melting, suggest that the central sections were not significantly contaminated.
For three samples, the concentration of a single element in a small sub-sample taken near the outside of the core was considerably lower than the corresponding value in the large, central sub-sample. It must be assumed that, in these cases, the large sub-samples had suffered spurious contamination because of the difficulty of handling this size of “core”. All data for these samples have been eliminated from further consideration, although other elements may have been acceptable. Changes in procedure, which have already been implemented, should preclude such problems in future studies.
3.2 Presentation of data
Data from the two sample sequences have been matched, using the oxygen-isotope stratigraphy to provide a unified depth scale. The dates assigned to the final profile accord with the isotope stratigraphy reported by Mayewski and others (1986). Metal data for the unified sample sequences (the blanks have been subtracted) are presented in Figure 2. The mean concentrations are Al 17.5 ng g−1, Cd 0.74 pg g−1, Cu 6.2 pg g−1, Pb 28 pg g−1 and Zn 27 pg g−1. The isotope profile shows that a full year has been sampled, so that these values should be close to annual means.
Profiles of oxygen-isotope ratio (δ), Al, Cd, Cu, Pb and Zn with depth at a sampling site near Dye 3. Snow surface as at June 1984. Where duplicate samples cover overlapping depth ranges, the lines have been drawn through an average position between them.

3.3 Comparison of data obtained by different techniques
For Pb, a sample from the first sequence analysed by IDMS gave 39 pg g−1. Samples covering part of the same depth range on the second sequence, and analysed by AAS, gave 22 pg g−1 and 26 pg g−1. Bearing in mind the different range of depths covered, and likely horizontal inhomogeneities in the snow, this result indicates a satisfactory agreement between the two methods.
Some samples were analysed for Cd, Cu or Pb both by direct multiple injection into the AAS, and after W wire pre-concentration (see Table 1). For most analyses, data from the direct injections method were limited by the detection limit. Although all analyses were carried out at pH 3, the direct injections method should be capable of analysing small undissolved particles that are not measured by the W wire method. The evidence that direct injections do not give higher concentrations is therefore reassuring and sets severe limits on the extent to which measured concentrations may have been reduced by incomplete analysis.

For the analyses by direct injections, 5 injections were used For all samples except + (2 injections) and * (10 injections).
4. Discussion
4.1 Seasonal variation
A clear winter-spring concentration peak is seen for Al, Cu, Pb and Zn. The existence of a winter-spring maximum in aerosol concentration in the Arctic for metals such as Cu, Pb and Zn, and for SO,4,2−, is well established (Barrie and Hoff 1985, Heidam 1985). In modern snowfall, winter-spring maxima have been observed for acidity in the Canadian Arctic (Barrie and others 1985), for SO,4,2− at Dye 3 in Greenland (Finkel and others 1986), and perhaps for dissolved organic carbon at Dye 3 (Twickler and others 1986). Murozumi and others (1969) also reported a winter maximum for Pb in near-surface snow near Camp Century. It appears that pollutant species are more easily injected into the Arctic troposphere from the industrialized mid-latitudes in winter and early spring, when the polar front is farther south and stable air masses allow pollutants to accumulate. In the summer, the Arctic troposphere is more isolated from these pollutant source areas.
A winter-spring peak in Al, which is of crustal origin, has been reported previously in snow at interior Greenland sites (Langway and others 1977). Microparticle concentrations at sites including Dye 3 also peaked in late winter-early spring (Hammer 1977).
It therefore seems that the winter/early-spring peak seen in our profiles is consistent with earlier studies, and with models of the way in which the Arctic troposphere behaves. However, it should be pointed out that the highest concentration point for Al, Cu, Pb and Zn occurred in samples that included a 2 cm thick ice layer which probably formed less than 2 weeks before the sampling date (implying <30cm percolation). The possibility that some limited redistribution of impurities has taken place within the snow-pack cannot be dismissed.
Cd shows a rather flat profile at this site, suggesting a separate source or input mechanism. We currently have no explanation for it.
Several years’ data, from this and other sites, are needed to confirm the seasonal cycle, and to define any role that summer melting (with formation of ice layers) may have.
4.2 Relationship between the elements
Both Cu and Pb are significantly (<0.1% level) correlated with Al; this still holds (but less significantly) even if the highest data point is omitted. Pb is also well correlated with Cu (1%) and Zn (5%), but in this case the correlation ¡s strongly dependent on the highest point. Of course, a good correlation does not imply that the elements involved necessarily have the same source; it would be equally consistent with two separate sources (crustal and anthropogenic), transported by similar mechanisms. Caution must also be exercised because the possibility remains that not all crustal metal has been analysed by this method.
The extent to which elements may be crustally derived can be assessed crudely by calculating a crustal enrichment factor (EF):

where x is the metal, C is the concentration in snow, and E is the concentration in average crustal material (Taylor 1964). This equation follows earlier authors in assuming that Al is entirely crustal. Soils and rocks may vary from mean composition by a factor, estimated at ≤3 for Pb (Boutron and Patterson 1986). If derived EFs lie within these limits, then the metal could be of entirely crustal origin. For the samples in this study, mean EFs (with range of values in parentheses) were: Cd 83 (4–240), Cu 1.5 (0.3–3.5), Pb 20 (5–57), Zn 9 (0.7–25).
The low EF for Cu, and its good correlation with Al, suggest a large crustal component for this element. The crustal component becomes an important part of the Zn input only during major injections of dust. The crustal source can play only a minor role for Pb and Cd, which must therefore derive from other sources.
Where the EF is close to unity, another method may be attempted. A regression of Cu against Al gives a very strong correlation, with an intercept of 3.1 ± 0.6 pg g−1, and a gradient of (0.16 ±0.02) x 10−3. This could be interpreted simply as indicating a crustal component superimposed on a fairly constant (pollution?) background of 3.1 pgg−1. The gradient is actually approximately one-quarter of the average crustal ratio, implying either that for this interpretation the source rock or soil was depleted in Cu, or that our W wire analysis cannot measure all the Cu bound up in aluminosiiicates. If the crusta! source rock-type or (as is probable) the magnitude of the background vary in the course of the year, then these factors will interfere with the analysis. Nevertheless, within wide limits this method gives an idea of the relative importance of the crustal source, and a rough estimate of possible pollutant Cu deposition.
4.3 Sources of the elements
We assume that Al is entirely crustal, and have already shown that a large proportion of the Cu and (for some samples) Zn may also be crustal. The other likely sources are sea-salt aerosol, volcanic emissions and anthropogenic sources.
We can index the sea-salt contribution from the chloride concentration (Mayewski and others 1986), using the heavy-metal composition of the ocean (Flegal and Patterson 1983, Bruland 1980). Even allowing for enrichment in sea spray (Boutron and Patterson 1986, Weisel and others 1984), the average sea-salt contribution is <2% for all these elements.
We estimate volcanic Pb following Boutron and Patterson (1986), calculating the volcanic portion of non-sea-salt sulphate estimated from Mayewski and others (1986). For Pb, the contribution is always <l pg g−1. For other elements, it does not seem possible from the literature to deduce a consistent value for the metal/sulphur ratio in volcanic emissions, so no realistic estimate can be made.
Murozumi and others (1969) and Ng and Patterson (1981) have shown that ancient snow from north Greenland contained at most 1.4 pg g−1 Pb. This would be close to the amount expected from crustal sources alone. A calculation (based on Al) for Dye 3 in south Greenland suggests an average crustal input of 2.5 pg g−1. The remaining lead in modern snow is probably anthropogenic. For the other elements, there are no reliable measurements in older ice (Wolff and Peel 1985[b]), so no trends can be deduced that can help us to determine the pollution input. However, in the absence of other sources it seems probable that most of the Zn that is not crustal is anthropogenic, as is most of the Cd. Only a long temporal record can confirm this conjecture, and further data on possible volcanic inputs are needed.
4.4 Comparison with other data
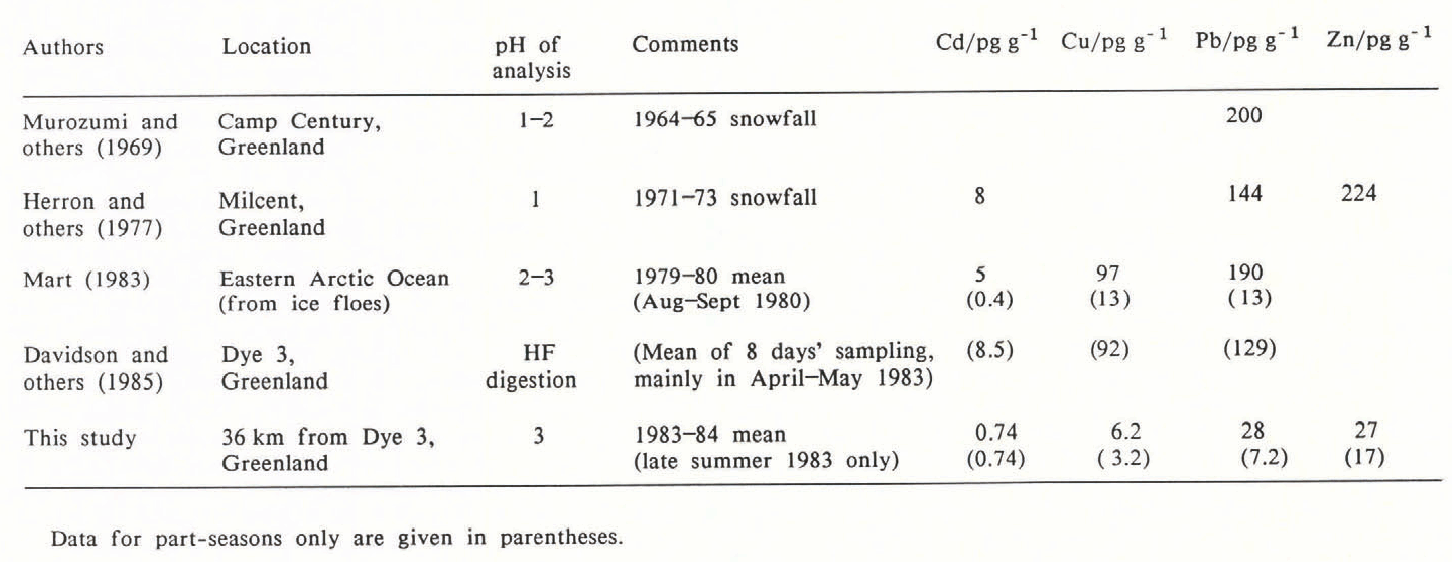
Two recent reviews concluded that most of the data for heavy metals in even recent Greenland snow were probably wrong (Boutron 1985, Wolff and Peel 1985[b]). Table II gives the data considered most reliable by Wolff and Peel (1985[b]) for Greenland and the Arctic Ocean, along with some more recent data from Dye 3.
Our late-summer data are in reasonable agreement with the late-summer data of Mart (1983). Otherwise, our data for the heavy metals are considerably lower than all other previously published data for snowfall during the last 20 years. The various sites considered have different altitudes, different accumulation rates and are subject to different meteorological influences. However, data on other species do not suggest that we can attribute such large discrepancies to these factors. Possible causes of the differences may be:
-
(1) Our methods may not be measuring total metal (at least for Cd, Cu and Pb), since we analyse at pH 3. Various pieces of evidence suggest that this is not the cause of the discrepancy:
(a) Both Mart (1983) and Murozumi and others (1969) worked at pH values that, like ours, would not be expected to attack insoluble crustal material. Only Davidson and others (1985) have attempted a complete acid digestion.
(b) We have previously presented evidence (Wolff and Peel 1985[a]) that all but the most firmly bound material in aluminosilicates should be dissolved at pH 3. Only for Cu is there any likelihood that a major part of the metal is in the aluminosilicates.
(c) The analyses carried out by direct injection into the AAS should give total metal concentrations. They indicate that our W wire method is not significantly under-analysing.
-
(2) It is possible that Herrón and others (1977) or Davidson and others (1985) could have suffered contamination. The latter authors sampled “several km upwind of Dye 3”, but effects from the base cannot be ruled out entirely and may be important. Neither group of workers used sub-sampling. However, there is insufficient information for a realistic assessment of possible contamination to be made. Whatever the cause, we cannot reconcile the data of these authors with our results. The carefully controlled work of Ng and Patterson (1981) suggests that contamination is not a major problem in most of the data presented by Murozumi and others (1969).
-
(3) Our site might be inherently cleaner than those used by other authors. However, modern increases in NO3 − and SO4 1− at Dye 3 (Mayewski and others 1986) appear to be similar to those at other sites (Herron 1982). Because of the higher snow-accumulation rate at Dye 3, dry deposition will be less important there, but relative to a site like Camp Century the concentration should only be lowered by at most 20% (based on the assumption that dry deposition is between 10 and 35% of the total deposition (Davidson and others 1985)).
-
(4) Davidson and others (1985) may have collected snow that was unrepresentative of the year’s snowfall. It seems improbable, however, that this could account for a discrepancy of the magnitude observed.
-
(5) A number of factors may have affected the annual mean data of Mart (1983), which refer to samples collected from ice floes in the Arctic Ocean. First, these samples were collected by a different method from the one he used for his summer samples, and contamination cannot be ruled out. Furthermore, melting and refreezing of the snow from previous years may have resulted in a concentration of impurities. Finally, his snow will have sampled air from the lower troposphere, whereas snow at our site (2600 m) samples the middle troposphere.
-
(6) The atmosphere may genuinely have become cleaner since sampling in the 1960s and 1970s. World consumption of Cd, Cu, Zn and Pb has increased over the last ten years (World Bureau of Metal Statistics 1985). However, the major source of pollutant Pb in the atmosphere is probably emissions from petrol (gasoline)-driven vehicles. Usage of lead additive in petrol fell by over 70% in the U.S.A. between 1970 and 1984 (data from Boyle and others 1986). Significant reductions in the permitted lead content of petrol in Europe were also made before 1984 (Royal Commission on Environmental Pollution 1983), although further reductions are being made now. Further data are required for an assessment of the importance of Pb emissions from petrol consumption in the U.S.S.R. (personal communication from J. Pacyna). Although most of the Arctic region is probably affected mainly by pollution from the Eurasian sector (Barrie 1986), both North American and European sources may be important for Greenland (Heidam 1986). On this basis, it seems possible that lead levels could have fallen by up to 70% since the work of Murozumi and others (1969). Taken together with the lower dry-deposition contribution at Dye 3, this may allow Murozumi and others’ (1969) data to be reconciled with ours. Herron and others’ (1977) Pb data may also be consistent with this interpretation, but their data for other elements are not compatible with ours.
5. Conclusions
Our heavy-metal data are the lowest so far reported for Greenland snow, but give values still considerably higher (Cd 3×, Cu 3×, Pb 4×, Zn 8×) than the best data for Antarctic snow (Wolff and Peel 1985[a], Boutron and Patterson 1986). This reflects the predominance of pollutant emissions in the Northern Hemisphere and the limited inter-hemispheric exchange in the troposphere. Our data show evidence of a clear maximum in the concentration of Pb, Zn and crustal elements in winter and spring snowfall, but this may be partly an artefact caused by redistribution of elements during summer melting. It appears to parallel the well-documented input of mid-latitude emissions into Arctic air masses in these seasons.
For the first time, we have shown that Cu is barely enriched above crustal abundance in Greenland snow. One explanation of our Pb data is that they may be showing a reduced concentration due to the imposition of controls on emissions.
In view of the fact that important conclusions cannot be made on the basis of so limited a data set, it is urgent that further samples are collected by those scientists who can make correct analyses at these concentrations. In particular, a time series covering the last century is required for both Greenland and the Antarctic. This will eventually allow a characterization of the natural souces of these metals (as has already been achieved for Pb by Boutron and Patterson (1986)), and of the context in which increases due to pollution should be seen.
Acknowledgements
DAP visited Greenland as a guest of the US Polar Ice Coring Office and the National Science Foundation. The authors thank Dr H Clausen for help in transporting the samples, and Dr H Clausen and Dr N Gundestrup for oxygen-isotope analyses. The IDMS analysis was carried out while EWW was a guest of Dr C Patterson at California Institute of Technology. EWW thanks Dr C Patterson, Mrs D Settle, Dr H Maring and Mr C Haraldsson for advice and assistance.



