Dairy cows typically are fed large amounts of concentrates in their diets to meet the high requirements of energy and other nutrients for milk production. Yet, the inclusion of large amounts of concentrates (i.e. >45% in dry matter) in the diet often occurs at the expense of the proportion of structural carbohydrates (Zebeli et al. Reference Zebeli, Dijkstra, Tafaj, Steingass, Ametaj and Drochner2008). These feeding practices often result in a high risk of developing subacute ruminal acidosis (SARA; Zebeli et al. Reference Zebeli, Mansmann, Ametaj, Steingass and Drochner2010) associated with important shifts in the proportions of microbial fermentation acids in the rumen, mostly in favour of lactate and propionate and against the production of acetate and butyrate (Enemark, Reference Enemark2008). The latter products are important precursors of the milk fatty acid synthesis de novo in the mammary gland, and their down-regulation may lead to low milk fat content (NRC, 2001).
In recent years, a variety of possible feed additives have been investigated to modulate rumen fermentation characteristics in cattle fed concentrate-rich diets, such as the use of direct-fed microbials (DFM; Ghorbani et al. Reference Ghorbani, Morgavi, Beauchemin and Leedle2002; Beauchemin et al. Reference Beauchemin, Yang, Morgavi, Ghorbani, Kautz and Leedle2003). DFMs have become a major area of interest in recent years, partly owing to increased demand from regulatory agencies and consumers for natural, non-antibiotic feed additives. Besides the use of live yeast products, the DFM research has focused also on two major types of bacteria: lactic acid producers and lactic acid utilizers. The use of lactic acid utilizing bacteria as a DFM has been the focus of research owing to their ability to metabolize lactic acid into volatile fatty acids (VFA). Megasphaera elsdenii and Selenomonas ruminantium are the two major lactic acid utilizers present in the rumen. M. elsdenii has gained more attention as it ferments 60–80% of lactate in the rumen (Counotte et al. Reference Counotte, Prins, Janssen and Debie1981) as well as lacking catabolite repression, i.e. its utilization of lactate does not decrease with the introduction of other fermentable substrates, such as glucose (Russell & Baldwin, Reference Russell and Baldwin1978). In practical use, M. elsdenii dosing has been shown to decrease concentrations of rumen lactate in ruminants fed concentrate rich diets (Henning et al. Reference Henning, Horn, Leeuw, Meissner and Hagg2010a, Reference Henning, Horn, Steyn, Meissner and Hagg2010b).
Additionally, M. elsdenii supplementation has been associated with favourably altering the rumen VFA profile by increasing acetate and butyrate production as well as increasing lactate uptake, which may result in pH stabilization that favours the growth of acetate- and butyrate-producers in the rumen (Henning et al. Reference Henning, Horn, Leeuw, Meissner and Hagg2010a, Reference Henning, Horn, Steyn, Meissner and Hagg2010b), thus increasing the availability of precursors for de-novo synthesis of milk fat in the mammary gland. However, most of the trials that have reported positive effects in relation to M. elsdenii treatment included a strong insult to the rumen environment, whether through concentrate dosing into the rumen, or the adaptation to a concentrate-rich diet (Aikmann et al. Reference Aikman, Henning, Horn and Humphries2009; Leeuw et al. Reference Leeuw, Siebrits, Henning and Meissner2009; Henning et al. Reference Henning, Horn, Leeuw, Meissner and Hagg2010a, Reference Henning, Horn, Steyn, Meissner and Hagg2010b). Information with regard to effects of M. elsdenii in mid-lactation dairy cows fed diets relatively high in barley-based concentrates is still rare. Barley grain contains large amounts of rapidly degradable starch, which can cause rumen perturbations associated with lowered milk fat content. For example, in a recent experiment conducted by our team, with early lactation dairy cows fed 45% barley grain-based concentrate diet, rumen pH dropped below 6·0 and this was associated with systemic inflammation and lowered milk fat content (Zebeli & Ametaj, Reference Zebeli and Ametaj2009).
It is well established that if rumen pH drops below 6·0, fibre degradation in the rumen is impaired (Mouriño et al. Reference Mouriño, Akkarawongsa and Weimer2001; Zebeli et al. Reference Zebeli, Mansmann, Ametaj, Steingass and Drochner2010) and the production of acetate and butyrate is decreased, affecting milk fat synthesis in the mammary gland. In fact, milk fat depression syndrome is more common in mid-lactation than in early-lactation cows, in which a low milk fat synthesis in the mammary gland is often compensated by mobilization of body fat reserves due to negative energy balance (NRC, 2001). It is known that M. elsdenii uses glucose and lactate as its main substrates to produce butyrate (Marounek et al. Reference Bauman and Griinari1989). Butyrate absorbed by rumen epithelium is converted to β-hydroxybutyrate (BHBA), which provides about one-half of the first four carbons of de-novo synthesized fatty acids in dairy cattle (Bauman & Griinari, Reference Bauman and Griinari2003). Moreover, about one-half of the milk fatty acids synthesized in the mammary gland of ruminants are derived from de-novo synthesis from acetate and butyrate (Bauman & Davis, Reference Bauman, Davis, Larson and Smith1974). We hypothesized that supplementation with M. elsdenii might improve the rumen environment by modulating its fermentation profile, resulting in better milk fat composition in mid-lactation Holstein cows fed a 45% barley-based concentrate diet.
Therefore, the objective of this experiment was to examine the effects of ruminal M. elsdenii dosage on rumen fermentation patterns as well as on milk yield and composition, especially milk fat content, in mid-lactation dairy cows. The preprandial and postprandial profiles of plasma energy variables such as glucose, BHBA, non-esterified fatty acids (NEFA), insulin, cholesterol, and lactate were evaluated to determine whether potential alterations in the rumen metabolism due to M. elsdenii administration were also reflected in energy metabolism in mid-lactation dairy cows.
Materials and Methods
Animals and diet
All experimental procedures were approved by the University of Alberta Animal Care and Use Committee for Livestock and animals were cared for in accordance with the guidelines of the Canadian Council on Animal Care (1993). Eight primiparous, ruminally fistulated (Ø 100 mm, Bar Diamond, Parma ID, USA) Holstein cows (680±30 kg body weight) were enrolled in the experiment. At the start of the trial, milk production averaged 31 kg/d and cows were 170±35 days in milk. Cows were assigned to one of two dosage treatments in a paired 2×2 crossover design for milk yield characteristics. There were two experimental periods consisting of 21 d each, with the first 11 d of each period designated an adaptation phase, which was followed by 10 d of sampling and measurements. According to the manufacturer's specifications, a suspension of 35 ml of M. elsdenii ATCC 25940 (American Type Culture Collection, Manassas VA, USA) of rumen origin and containing 108 cfu/ml was inoculated daily during the whole experimental period (21 d) via rumen fistula to each cow pertaining to the M. elsdenii (MEGA) group, whereas control (CTR) cows were inoculated with 35 ml of carrier only (0·15 m-saline). Reinforced clostridial medium (RCM) was used to culture the M. elsdenii at 39°C in an anaerobic environment. A portion of M. elsdenii culture was transferred to RCM medium containing mineral salts, cysteine-HCl, yeast extract, a mixture of glucose, maltose and fructose as substrates, and incubated for 24 h at 39°C under anaerobiosis. The cells were counted under a phase-contrast microscope. The following formula was used to calculate the number of cfu of M. elsdenii: log (number of colonies×dilution)=cfu/ml.
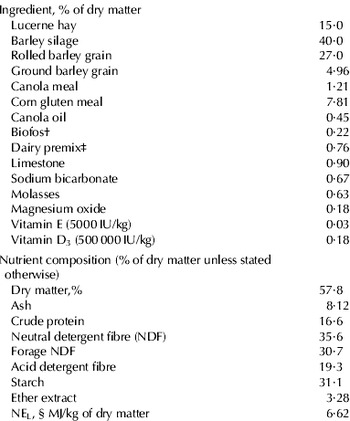
Cows were fed a total mixed ration (TMR) once daily at 8.00 that contained 27% rolled barley grain, 15% lucerne hay, 40% barley silage, and 18% protein, energy and vitamin-mineral supplement (Table 1). The cows were fed for ad-libitum intake to permit at least 5% orts. For the duration of the experiment cows were housed in individual tie stalls and had free access to water.
Ingredients and chemical composition of the total mixed ration

† Contained monocalcium phosphate and dicalcium phosphate in the ratio 2:1 (Champion Feed Services Ltd., Barrhead, Alberta, Canada)
‡ Contained calcium 0·1%, phosphorus 0·6%, sodium 11·5%, magnesium 0·3%, potassium 0·7%, sulphur 0·23%, zinc 5000 mg/kg, copper 1170 mg/kg, manganese 3100 mg/kg, iodine 80 mg/kg, cobalt 6·2 mg/kg, vitamin A 1 265 000 IU/kg, vitamin D 142 000 IU/kg, vitamin E 3800 IU/kg
§ Determined as the susm of NEL of individual feeds in a feeding level at 3-times maintenance (NRC, 2001)
Composition of the diet was determined by first drying diet samples at 55°C for 72 h. Samples were then ground through a 1-mm screen with a Wiley mill (Thomas-Wiley, Philadelphia PA, USA) and further analysed for dry matter (DM), ash, neutral detergent fibre (NDF), acid detergent fibre (ADF), crude protein (CP) and starch. Diet DM was determined by drying at 135°C for 2 h (AOAC, 2002; method 930·15). Ash content was determined by drying feed samples in a furnace at 550°C for 5 h (AOAC, 2002; method 942·05) while NDF and ADF determinations were analysed using heat-stable amylase and sodium sulphite for NDF (Van Soest et al. Reference Van Soest, Robertson and Lewis1991). Diet CP was determined by flash combustion with gas chromatography and a thermal conductivity detector (Carlo Erba Instruments, Milan, Italy). Starch levels in the diets were quantified using an enzymic colorimetric method with EnzyChrom assay kit (BioAssay Systems, Hayward CA, USA). Ingredients and chemical composition of the diet is displayed in Table 1.
Rumen fermentation profile
To evaluate rumen fermentation profile, the pH, VFA and lactate concentrations in the rumen fluid were measured. About 250 ml of the rumen fluid was collected shortly before the morning feeding on days 1, 3, 5, 7 and 10 of each measurement period to determine the preprandial responses at various days. In addition, on day 21 of the experimental period, rumen fluid samples were taken every 2-h starting from 8.00 until 20.00 to evaluate the postprandial responses. Rumen fluid samples were collected and pH was measured according to the procedure described in our previous paper (Iqbal et al. Reference Iqbal, Zebeli, Mazzolari, Bertoni, Dunn, Yang and Ametaj2009). In brief, fluid was collected from a tube fitted with a strainer and syringe that was inserted through the rumen cannula into the ventral rumen sac. A portable pH meter (Accumet AP61, Fischer Scientific, Ottawa, Ontario, Canada) was used to measure pH of the rumen fluid shortly after sampling. To measure VFA concentrations, 100 ml of rumen fluid was centrifuged at 2010 g at 4°C for 20 min (Rotata 460 R, Hettich Zentrifugan, Tuttlingen, Germany). Two replicates of 5 ml each were extracted from the supernatant and stored at −20°C until analysis. Volatile fatty acids were separated and quantified by gas chromatography (Varian 3700, Varian Specialties Ltd., Brockville, Ontario, Canada) using a 15-m (0·53-mm i.d.) fused silica column (DB-FFAP column; J&W Scientific, Folsom CA, USA). Concentration of lactate (d- and l-lactate) in the rumen fluid supernatants was determined using commercially available lactate assay kits (Biomedical Research Service Center, Buffalo NY, USA). All samples were tested in duplicate and the lactate concentration was determined by reading the optical density values on a microplate spectrophotometer (Spectramax 190, Molecular Devices Corporation, Sunnyvale CA, USA) at 492 nm.
Plasma metabolites
For preprandial measurements blood was collected via the coccygeal vein using 10-ml vacutainer tubes coated with a sodium heparin anticoagulant (Becton Dickinson, Franklin Lake NJ, USA) on days 1, 3, 5, 7 and 10 of the measurement period. Blood was also collected at every 2-h interval on day 10 of the measurement period from 8.00 to 20.00 for postprandial measurements. Blood was stored on ice and centrifuged (Rotata 460 R, Hettich Zentrifugan, Tuttlingen, Germany) within 20 min of collection at 3000 g at 4°C for 20 min to obtain plasma. Plasma was then stored at −20°C until analysis for cholesterol, glucose, NEFA, BHBA, insulin and lactate using commercially available kits on a microplate spectrophotometer (Spectramax 190, Molecular Devices Corporation) according to technical specifications described previously (Iqbal et al. Reference Iqbal, Zebeli, Mazzolari, Dunn and Ametaj2010).
Milk composition and feed intake
Milk samples were collected on days 1, 3, 5, 7 and 10 of the measurement period at 5.00 and 15.00. Milk was analysed for fat, CP, milk urea nitrogen (MUN) and lactose by mid-infrared spectroscopy at the Central Milk Testing Laboratory (CanWest DHI, Edmonton, Alberta, Canada). Milk production and feed intake were measured for each individual cow during the last 10 d of each experimental period. The difference between total daily feed given and the total feed refusals the next morning for each cow was used to calculate the feed intake.
Statistical analysis
All data were analysed using the MIXED procedure of SAS (SAS Institute Inc., Version 9.1.3) according to the following model:

Where
Yijklmn=observations for dependent variables,
μ=overall mean,
Si=fixed effect of diet sequence i (i=1 to 2),
C(S)j(i)=random effect of cow j nested within diet sequence i (j=1 to 8),
Pk=fixed effect of period k (k=1 to 2),
Tl=fixed effect of measurement time l (l=1 to 5 for days, and 1 to 7 for hours),
Dm=fixed effect of diet l (l=1 to 2),
TDlm=fixed effect of diet by time interaction,
eijklmn=random residual effect
Measurements collected at different times, on the same cow, were considered as repeated measures in the ANOVA, whereby the effects of day and hour were evaluated separately in the model. The Si and C(S)j(i) terms were included in the model to determine any potential carryover effect. The variance-covariance structure of the repeated measures was modelled separately for each response variable according to the lowest values of the fit statistics based on the Bayesian information criteria and an appropriate structure was fitted. Degrees of freedom were approximated by the method of Kenward-Roger (ddfm=kr), and differences at each time point between treatments were conducted with SLICE option of SAS. LSM and the respective sem were computed. Significance was declared at P⩽0·05, while a tendency was considered at 0·05<P⩽0·10.
Results
Rumen fermentation profile
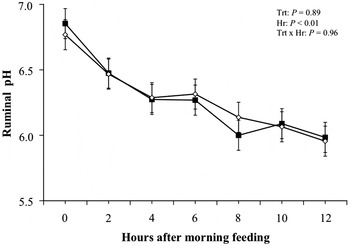
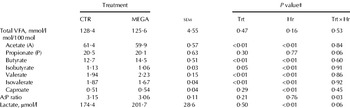
Measurements of rumen pH were not affected by M. elsdenii administration, and these values did not reach levels lower than 5·8 during the entire period measured (Fig. 1). However, there was an effect (P<0·01) of sampling hour on rumen pH, which decreased consistently after morning feeding. Postprandial data of VFA and lactate in the rumen are displayed in Table 2. Changes were observed in the postprandial rumen VFA profile due to M. elsdenii dosage. Decreased rumen proportions of acetate (P<0·01), isobutyrate (P=0·05) and isovalerate (P<0·01) were observed in MEGA cows compared with the CTR ones. Instead, VFA production shifted in M. elsdenii cows to butyrate and valerate, both of which increased (P<0·01) proportionally.
Hourly variation of rumen pH in lactating Holstein cows ruminally dosed with (◊) or without (▪) Megasphaera elsdenii (LSM±sem; n=8; Trt=effect of treatment; Hr=effect of sampling hour; Trt×Hr=effect of treatment by sampling hour interaction).

Postprandial concentration† of short-chain fatty acids in rumen fluid of lactating Holstein cows receiving (MEGA) and not receiving (CTR) Megasphaera elsdenii administered into the rumen

† Samples were taken on the last day of each sampling period at 0, 2, 4, 6, 8, 10 and 12 h after morning feeding (n=8)
‡ Trt=effect of treatment; Hr=effect of sampling hour; Trt×Hr=effect of treatment by sampling hour interaction, LSM±sem; n=8
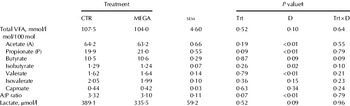
Inoculation with M. elsdenii had a minor effect on changes in the day-to-day VFA patterns and lactate (Table 3). Data showed that treatment did not affect the concentration of total VFA in the rumen fluid, but tended to increase the molar proportion of propionate (P=0·09), and lower the acetate to propionate ratio (P=0·07). There was an interaction trend (P=0·09) for treatment and day for butyrate, as on day 3, butyrate was greater in M. elsdenii-dosed cows than CTR (data not shown). There was also a tendency for proportions of acetate, propionate, valerate, isovalerate and the A:P ratio to be affected by sampling day.
Preprandial concentration† of short-chain fatty acids in the rumen fluid of lactating Holstein cows receiving (MEGA) and not receiving (CTR) Megasphaera elsdenii administered into the rumen

† Samples were taken prior to morning feeding on days 1, 3, 5, 7 and 10 of each measurements period
‡ Trt=effect of treatment; D=effect of sampling day; Trt×D=effect of treatment by sampling day interaction, LSM±sem; n=8
Plasma metabolites
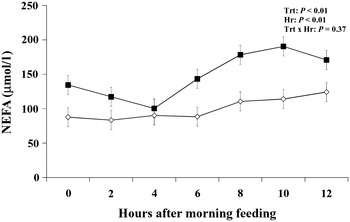
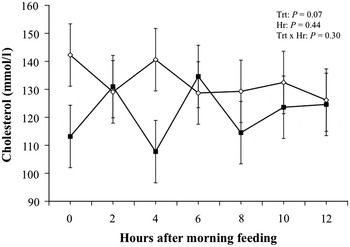
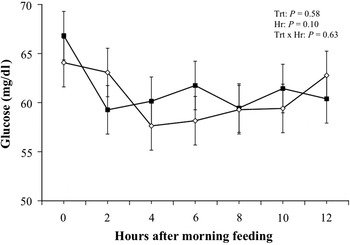
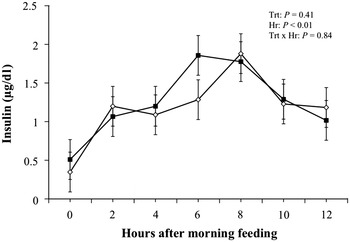
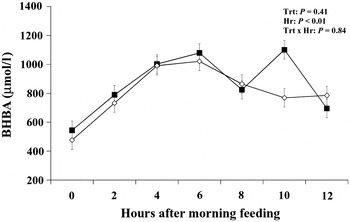
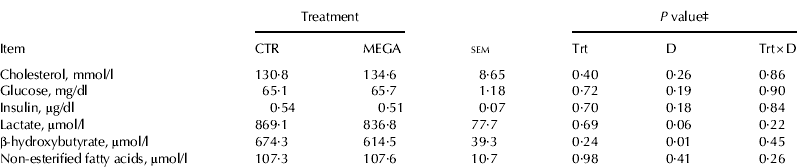
The only plasma metabolites affected by treatment were cholesterol and NEFA. Concentrations of NEFA in the plasma were lower in MEGA cows after the morning feeding (Fig. 2). Sampling hour also affected plasma NEFA in this study (Fig. 2). On the other hand, plasma concentrations of cholesterol tended to be greater in cows treated with M. elsdenii (Fig. 3) when measured postprandially. There was a tendency (P=0·10) for glucose to be affected by sampling hour, with the lowest plasma concentrations of glucose reached between 4 and 8 h after feeding (Fig. 4). The decrease in glucose corresponded with an increase in insulin, which was also affected (P<0·01) by hour, and was greatest between 6 and 8 h after feeding (Fig. 5). Postprandial concentrations of BHBA were not affected by the treatments (Fig. 6); however, plasma BHBA was increased in both groups of cows after the morning feeding.
Postprandial variation of plasma non-esterified fatty acids in lactating Holstein cows ruminally dosed with (◊) or without (▪) Megasphaera elsdenii (LSM±sem; n=8; Trt=effect of treatment; Hr=effect of sampling hour; Trt×Hr=effect of treatment by sampling hour interaction).

Postprandial variation of plasma cholesterol in lactating Holstein cows ruminally dosed with (◊) or without (▪) Megasphaera elsdenii (LSM±sem; n=8; Trt=effect of treatment; Hr=effect of sampling hour; Trt×Hr=effect of treatment by sampling hour interaction).

Postprandial variation of plasma glucose in lactating Holstein cows ruminally dosed with (◊) or without (▪) Megasphaera elsdenii (LSM±sem; n=8; Trt=effect of treatment; Hr=effect of sampling hour; Trt×Hr=effect of treatment by sampling hour interaction).

Postprandial variation of plasma insulin in lactating Holstein cows ruminally dosed with (◊) or without (▪) Megasphaera elsdenii (LSM±sem; n=; Trt=effect of treatment; Hr=effect of sampling hour; Trt×Hr=effect of treatment by sampling hour interaction).

Postprandial variation of plasma β-hydroxybutyrate of lactating Holstein cows ruminally dosed with (◊) or without (▪) Megasphaera elsdenii (LSM±sem; n=8; Trt=effect of treatment; Hr=effect of sampling hour; Trt×Hr=effect of treatment by sampling hour interaction).

With regard to preprandial measurements the only difference that occurred in plasma metabolites was a tendency (P=0·06) of sampling day to affect lactate (Table 4) indicating a day-to-day variation in the levels of this variable. Plasma cholesterol, glucose, NEFA, BHBA and insulin were not affected (P>0·10) by any of the tested treatments (Table 4).
Preprandial plasma metabolites† of lactating Holstein cows receiving (MEGA) and not receiving (CTR) Megasphaera elsdenii administered into the rumen

† Samples were taken prior to morning feeding on days 1, 3, 5, 7 and 10 of each measurement period
‡ Trt=effect of treatment; D=effect of sampling day; Trt×D=effect of treatment by sampling day interaction, LSM±sem; n=8
Feed intake and milk composition
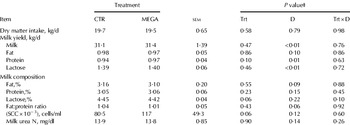
For the CTR and MEGA treatments, cows consumed on average 19·5 and 19·7 kg DM/d, and they produced 31·1 and 31·4 kg milk/d, respectively; there was no difference in both these variables between groups in this study (Table 5). There was a tendency (P=0·10) for milk protein yield to be increased in cows treated with M. elsdenii, and there was also a tendency (P=0·06) for lactose percentage to be reduced (Table 5). Somatic cell counts (SCC) tended (P=0·06) to be greater in MEGA cows than CTR animals.
Feed intake and milk properties† of lactating Holstein cows receiving (MEGA) and not receiving (CTR) Megasphaera elsdenii administered into the rumen

† Samples were taken prior to morning feeding on days 1, 3, 5, 7 and 10 of each measurements period
‡ Trt=effect of treatment; D=effect of sampling day; Trt×D=effect of treatment by sampling day interaction, LSM±sem; n=8
Discussion
We hypothesized that ruminal dosage with M. elsdenii would improve the rumen environment by modulating its fermentation profile, resulting in better milk fat performance of mid-lactation dairy cows. Indeed, the most notable finding of this study was that M. elsdenii led to shifts in the profile of various VFA, which were marked by an increase in butyrate proportion. Greater proportions of butyrate in the rumen are known to have positive consequences for the health and integrity of the rumen epithelium (Mentschel et al. Reference Mentschel, Leiser, Mulling, Pfarrer and Claus2001). Also, there was a decrease of ruminal acetate but a tendency to increase preprandial propionate proportion in response to M. elsdenii administration. Decreases in acetate production and increases in propionate have been found previously in early-lactation dairy cows dosed with M. elsdenii (Aikmann et al. Reference Aikman, Henning, Horn and Humphries2009). Also, in another trial conducted with steers, ruminally bolused with M. elsdenii, there were reductions in propionate, but increases in butyrate and decreases in acetate (Henning et al. Reference Henning, Horn, Steyn, Meissner and Hagg2010b), similar to the changes seen in the present trial.
The greater proportions of butyrate and valerate, and the tendency for more preprandial propionate as well as the lower proportions of acetate in the rumen fluid in response to M. elsdenii dosage are indicative of metabolic shifts in the rumen, leading to a stimulation of butyrate, valerate and propionate fermentation. Previous work also supports these changing VFA proportions due to M. elsdenii, as it has been shown that the major end products of M. elsdenii metabolism are butyrate and propionate (Counotte et al. Reference Counotte, Prins, Janssen and Debie1981). Indeed, propionate and butyrate derive from lactate through the reductive route, found in multiple lactate-utilizing bacteria in the rumen, including M. elsdenii (Satter & Esdale, Reference Satter and Esdale1968). The reduction in the proportions of acetate in the rumen fluid can be attributed to the fact that utilization of acetate is consistent with the operation of the butyryl coenzyme A–acetyl coenzyme A transferase route for butyrate synthesis (Barcenilla et al. Reference Barcenilla, Pryde, Martin, Duncan, Stewart, Henderson and Flint2000).
Other results of this study indicated that proportions of the two branched-chain VFA (BCVFA), isobutyrate and isovalerate, were decreased in cattle treated with M. elsdenii. BCVFA, while produced in much smaller proportions than the three major VFA, have been implicated as growth factors for some cellulolytic bacteria (Allison et al. Reference Allison, Bryant and Doetsch1962). The main source of BCVFA is deamination of branched-chain amino acids by M. elsdenii (Miura et al. Reference Miura, Horiguchi and Matsumoto1980; Andries et al. Reference Andries, Buysse, De Brabander and Cottyn1987). The mechanism(s) underlying the decrease of BCVFA in the rumen fluid of MEGA cows might be related to their utilization by cellulolytic bacteria (Rychlik et al. Reference Rychlik, LaVera and Russell2002).
The fact that rumen lactate and total VFA concentration did not change in this study supports the results for rumen pH, which were not different between the groups. It is well known that lactate is not accumulated in the rumen fluid of dairy cows fed diets far beyond the SARA levels (Nocek & Kautz, Reference Nocek and Kautz2006; Iqbal et al. Reference Iqbal, Zebeli, Mazzolari, Bertoni, Dunn, Yang and Ametaj2009), similar to this study. Indeed, lactate was low in the current study (<1 mm) and can also be explained by the fact that diets were formulated to provide sufficient structural fibre and, therefore, the produced lactate was probably rapidly metabolized to propionate and butyrate.
It should be pointed out that administration of M. elsdenii in our study was not used for prevention of SARA because it is known that mid–late-lactation dairy cows are not at risk from this disorder. Indeed, cows in both control and MEGA groups had rumen pH values above 5·9 (Fig. 1), despite the relatively high proportion of barley-based concentrate in the diet (45% in DM). In a previous trial with early-lactation cows a similar diet caused a stronger decline in the rumen pH, which was associated with a dramatic rise in the concentration of endotoxin in the rumen and milk fat depression (Zebeli & Ametaj, Reference Zebeli and Ametaj2009). Evidently, mid–late-lactation cows are less responsive to a high-grain diet and more resistant to rumen metabolic disorders than early-lactation cows.
Another interesting finding of this study was the difference between preprandial and postprandial responses in the concentrations of VFA in rumen fluid. For example, preprandial data indicated that propionate percentage tended to be greater and acetate to propionate ratio tended to be lower in MEGA cows, whereas no differences were observed, for the same variables, during the postprandial measurements. Conversely, changes in the concentrations of acetate, butyrate, valerate and BCVFA in the rumen were more pronounced in MEGA cows during the postprandial period. These time-related differences can be attributed to the substrate availability (i.e. lactate) and, most importantly, to the metabolic activity of M. elsdenii, which can change with rumen pH (Counotte et al. Reference Counotte, Prins, Janssen and Debie1981). The latter authors determined that the proportions of VFA produced by M. elsdenii from lactate in the rumen vary with rumen pH. For example, elevated pH values, an event corresponding to fermentation during the preprandial period, stimulates production of propionate, whereas lowering of pH may shift the fermentation of lactate more towards butyrate and valerate (Counotte et al. Reference Counotte, Prins, Janssen and Debie1981).
Surprisingly, the major alterations that occurred in the postprandial rumen VFA profiles did not translate into major changes in the plasma concentrations of energy metabolites. One of the modifications that occurred was a minor postprandial difference in cholesterol concentrations; MEGA cows did show a tendency for greater circulating cholesterol than CTR cows. Effects of supplementing Propionibacteria on plasma cholesterol have not been consistent in lactating dairy cows. For example, Aleman et al. (Reference Aleman, Stein, Allen, Perry, Lehloenya, Rehberger, Mertz, Jones and Spicer2007) found greater plasma cholesterol concentrations during the periparturient period in response to supplementation with Propionibacteria in multiparous cows, but not in the primiparous cows. Animals included in our study were mid-lactation primiparous cows. It is well established that blood cholesterol in ruminants derives mainly from endogenous synthesis in the epithelial cells of the gastrointestinal tract, adipose tissue and hepatocytes (Liepa et al. Reference Liepa, Beitz and Linder1978). Glucose and VFA such as acetate are the major precursors of the de-novo synthesis of cholesterol in ruminants (Liepa et al. Reference Liepa, Beitz and Linder1978). Because plasma glucose did not differ between the groups, differences in rumen acetate, butyrate and propionate between MEGA and CTR cows might be rather responsible for differences in plasma cholesterol in this study; however, understanding of the underlying mechanisms and the physiological significance of this finding requires further investigation.
Another finding of this study was lower postprandial NEFA in the plasma of cows treated with M. elsdenii. Although the precise reason for lower plasma NEFA is not clear, it is possible that the decrease in rumen acetate postprandially might have affected the overall synthesis and the release of NEFA from adipose tissue. Acetate is a substrate for lipogenesis in ruminants and is taken up by adipose tissue and mammary gland for de-novo synthesis of lipids (Bergman & Wolff, Reference Bergman and Wolff1971). We also speculate that a greater availability of glucogenic precursors such as propionate and valerate in the rumen fluid might have contributed to the lowered concentration of NEFA in the plasma of treated cows due to their inhibitory effect on NEFA release by adipose tissue (Nelson & Cox, Reference Nelson and Cox2005). It should be pointed out that there was no difference between the two treatment groups in the preprandial concentrations of NEFA in the plasma.
This investigation also showed no difference in the concentrations of plasma BHBA. BHBA derives mainly either from oxidation of NEFA in the hepatocytes or from the metabolism of butyrate in the rumen epithelium. Because rumen butyrate concentrations were greater in MEGA cows, a similar response of BHBA in the plasma was also expected in the latter cows. However, this was not the case since no difference was observed for plasma BHBA in this study. The lower oxidation of NEFA might have equalized a potentially greater BHBA synthesis in the rumen epithelia due to M. elsdenii, hence resulting in no difference of plasma BHBA between MEGA and CTR cows.
The results also showed no differences in the concentrations of insulin and glucose in the plasma of MEGA and CTR cows. The lack of differences in the plasma concentrations of these two variables was not expected because administration of M. elsdenii modulated glucogenic rumen precursors in this study. It is known that insulin facilitates glucose consumption by suppressing lipolysis and utilization of free fatty acids in body cells and therefore increases cell demand for glucose (Nelson & Cox, Reference Nelson and Cox2005). On the other hand, insulin also lowers circulating free fatty acids through promotion of their re-esterification into triacylglycerols by up-regulation of genes associated with lipogenic enzymes in adipose tissue (Nelson & Cox, Reference Nelson and Cox2005). Since both these processes are more emphasized during intensive metabolic periods such as during the transition period, and because cows in our study were in mid-lactation, it is hypothesized that the effects of MEGA on energy variables might be stronger during such intensive metabolic periods. Indeed, Aleman et al. (Reference Aleman, Stein, Allen, Perry, Lehloenya, Rehberger, Mertz, Jones and Spicer2007) found a strong insulin and glucose response in dairy cows fed different doses of Propionibacteria during the transition period. However, our results are similar to those from several trials that supplemented different DFMs, such as Propionibacterium and Enterococcus in feedlot cattle (Ghorbani et al. Reference Ghorbani, Morgavi, Beauchemin and Leedle2002; Beauchemin et al. Reference Beauchemin, Yang, Morgavi, Ghorbani, Kautz and Leedle2003), but again contrast with others, which also using Enterococcus and yeast, observed significant increases in plasma concentrations of insulin and/or glucose in cows during the transition period (Nocek et al. Reference Nocek, Kautz, Leedle and Block2003; Nocek & Kautz, Reference Nocek and Kautz2006).
Administration of M. elsdenii only minimally affected the variables of milk composition in this study. Milk fat is the component of milk most affected by a high-grain diet and its resulting effects on rumen fermentation profile (NRC, 2001). This is also the reason why milk fat content is often used as an indicator of fibre adequacy and the risk of SARA in dairy cows (Zebeli et al. Reference Zebeli, Dijkstra, Tafaj, Steingass, Ametaj and Drochner2008). Milk fat and its ratio with milk protein were relatively low throughout the study (i.e., on average 3·1% and 1·01, respectively) which in turn indicate a high risk of SARA. However, because rumen pH was above 5·8 until 12 h after feeding, it is not clear at present which other factors might have contributed to this overall low milk fat content of cows in this study. It is also important to note that even though butyrate, an important precursor of milk fat synthesis de novo, was increased milk fat content was not improved in MEGA cows. Because administration of M. elsdenii increased concentration of rumen butyrate, an increase in milk fat content was expected in this study. However, this did not occur, probably because of the lower acetate and greater propionate proportions in the rumen in the MEGA cows. The decrease in acetate and increase in propionate might have counteracted an increased rumen butyrate; preventing an increase in milk fat content.
Results of the study also showed that there was a tendency for greater SCC in the milk of cows treated with MEGA. It is, however, important to note that although MEGA cows had greater SCC than CTR cows, both groups of cattle had counts well below 150 000, indicating healthy udders.
Taken together, our data indicated that M. elsdenii has the potential to modulate rumen fermentation profile in cows fed typical mid-lactation diets with 45% concentrate (DM basis), and that were not subjected to the stress of a dietary change. However, the fact that these effects were only slightly reflected in changes in plasma metabolites and milk composition does not support M. elsdenii dosing for this production category of dairy cattle that were not challenged with a rumen SARA insult. Because M. elsdenii may have more beneficial effects on metabolic health when cows are at highest risk for metabolic disturbances, such as during the transition period, further research should include testing M. elsdenii dosage in cows immediately pre- and post-partum to determine whether supplementation would have greater effects during this high-risk transition period.