I. INTRODUCTION
Owing to the ferroelectric, piezoelectric, and pyroelectric properties,Reference Nalwa1 poly(vinylidene fluoride) (PVDF) and its copolymers have attracted substantial research attention as an important family of crystalline polymers for a broad range of applications, including nonvolatile memories,Reference Ducharme, Reece, Othon and Rannow2–Reference Furukawa, Takahashi and Nakajima6 transducers/actuators,Reference Nalwa1, Reference Chen and Payne7–Reference Brochu and Pei9 and electrical energy storage.Reference Chu, Zhou, Ren, Neese, Lin, Wang, Bauer and Zhang10–Reference Guan, Wang, Yang, Guan, Han, Wang and Zhu15 In PVDF homopolymer, the chain conformation is fairly adaptable and crystal polymorphism is often observed with at least four polymorphic phases: (i) polar all trans β phase (form I), (ii) the nonpolar TGTG′ α phase (form II), (iii) polar TGTG′ δ phase (form IIp), and (iv) polar TTTGTTTG′ γ phase (form III).Reference Tashiro and Nalwa16, Reference Lovinger17 Among these modifications, the ferroelectric phases (β, δ, and γ) are responsible for the ferro-, piezo-, and pyroelectric properties. Generally speaking, the nonpolar α phase is kinetically favorable and can be easily formed under normal crystallization conditions.Reference Nalwa1, Reference Tashiro and Nalwa16, Reference Gregorio and Cestari18 The ferroelectric β phase, on the contrary, is thermodynamically more stable and can be obtained by high-pressure crystallization from the melt or mechanical stretching and/or electric poling of the nonpolar α phase.Reference Tashiro and Nalwa16 In addition, the γ phase can be obtained by either solution casting from strongly polar solvents, such as N,N-dimethylformamide (DMF), N,N-dimethylacetamide (DMAc), and dimethyl sulfoxide, or crystallization at high temperatures.Reference Tashiro and Nalwa16
In a recent study, the general principle for the formation of ferroelectric β phase in PVDF was rationalized.Reference Zhong, Zhang, Su, Wang, Fong and Zhu19 Fundamentally, the nucleation of ferroelectric phases should be strongly influenced by the interactions between the local electric field and PVDF dipoles. These local field–dipole interactions can be of different forms, including ion–dipole, dipole–dipole, hydrogen bonding, and external electric field–dipole interactions. Generally speaking, the stronger the interactions between the local electric field and PVDF dipoles, the easier the nucleation of the ferroelectric phases. Meanwhile, the growth rate of ferroelectric phases after nucleation with respective to the rates of nucleation and growth of the nonpolar α phase, if nucleated, determines the relative amount of ferroelectric phases in PVDF. If the nucleation of the nonpolar α phase can be suppressed, a pure ferroelectric phase will be obtained.
(i) Ferroelectric phase formation from a heterogeneous phase. This situation refers to PVDF crystallization in the presence of pre-existing heterogeneous interfaces. These interfaces can be either nonpolar or polar. Nonpolar interfaces include glasses, metals, and (nonpolar) polymers. For example, transcrystallization (surface-induced crystallization) of PVDF has been observed from the surfaces of several nonpolar polymers, namely, poly(ethylene terephthalate), polytetrafluoroethylene, and polyimide; however, only the nonpolar α phase is observed.Reference Benkhati, Tan and Jungnickel20 Polar interfaces can be either inorganic or polymeric. Inorganic polar interfaces include those from inorganic salts [e.g., (001) surfaces in KBr and NaCl,Reference Lovinger21–Reference Miyazaki, Takeda, Akasaka, Sakai and Hoshiko24 charged nanoplatelets (e.g., mica and layered silicatesReference Priya and Jog25–Reference Wu, Xie and Yang29)] or even electron-rich carbon nanotubes.Reference He, Xu, Hue and Song30, Reference Kim, Hong and Seo31 The strong local electric field near these inorganic interfaces can effectively induce the nucleation of polar (ferroelectric) phases in PVDF. However, at locations far away from these polar interfaces, nonpolar α phase will be nucleated, leading to the coexistence of both nonpolar and ferroelectric phases in the composites. Therefore, the amount of induced ferroelectric phases depends on the content of these inorganic fillers or the surface-to-volume ratio in the system. For polar polymer interfaces, such as in PVDF blends with nylon 11, ferroelectric phases will be nucleated with their c-axes parallel to the interface.Reference Li and Kaito32, Reference Li and Kaito33 For locations away from the polar polymer interfaces, the nonpolar α phase can be nucleated by foreign particles, leading to the coexistence of both nonpolar and ferroelectric phases in PVDF. In general, the lower the PVDF content (or the smaller the PVDF domains) in these blends, the higher the surface-to-volume ratio and thus the higher the ferroelectric phase content. Intriguingly, only the nonpolar α phase is observed when polar nylon 11 is replaced by nonpolar nylon 6.Reference Kim, Cho and Yoon34–Reference Na, Xu, Lv, Li, Tian and Zou36 Therefore, hydrogen bonding may not be a necessary requirement for the formation of ferroelectric PVDF phases. Instead, the polar local crystalline phases in nylon 11 should be responsible for the nucleation of ferroelectric phases in PVDF.
(ii) Electrospinning effect. During electrospinning, both fast elongation of spinning jet/filament and external electric field–dipole interaction will facilitate the formation of ferroelectric phases in PVDF. When polar inorganic or polymeric interfaces are present, the nucleation and growth of the nonpolar α phase will be completely suppressed and pure ferroelectric phases will be obtained.Reference Zhong, Zhang, Su, Wang, Fong and Zhu19 For nonpolar polymer (e.g., polysulfone) interfaces, ferroelectric phases will coexist with the nonpolar α phase in electrospun PVDF blend fibers.Reference Zhong, Zhang, Su, Wang, Fong and Zhu19
In this study, crystal orientation and polymorphism formation in stretched electrospun PVDF/polyacrylonitrile (PAN) blend fibers during melt-recrystallization were studied using wide-angle x-ray diffraction (WAXD) and Fourier transform infrared (FTIR) spectroscopy. After melt-recrystallization for PVDF, a significant amount of ferroelectric β crystals was retained in addition to the formation of nonpolar α crystals. A polarized FTIR study showed that the degree of orientation of ferroelectric β-PVDF crystals along the fiber axes was higher than that of nonpolar α crystals, suggesting that the β-PVDF crystals should form at the PVDF/PAN interfaces because of strong dipolar and hydrogen bonding interactions between vinylidene fluoride (VDF) and acrylonitrile (AN) units.
II. EXPERIMENTAL SECTION
A. Materials
PVDF was purchased from Sigma-Aldrich (St. Louis, MO). Its number-average molecular weight (Mn) was 71,000 g/mol, and the polydispersity index (PDI) was 2.54. The PAN (SAF 3K; Courtaulds, Ltd., Essex, UK) was a copolymer with 92.8 wt% of acrylonitrile, 1.2 wt% of itaconic acid, and 6.0 wt% of methyl acrylate.Reference Lai, Zhong, Yue, Chen, Zhang, Vakili, Wang, Zhu, Liu and Fong37 Its Mn was 4,905,450 g/mol and PDI was 1.3 as determined by size-exclusion chromatography (SEC) using DMF as the solvent. DMAc and tetrahydrofuran (THF) were purchased from Fisher (Pittsburgh, PA) and used without further purification. An organosoluble polyimide (6FDA–PFMB) synthesized from 2,2-bis(3,4-dicarboxyphenyl) hexafluoropropane dianhydride (6FDA) and 2,2-trifluoromethyl-4,4-diaminobiphenyl (PFMB) was used to confine the electrospun blend fibers for melt-recrystallization studies. The glass transition temperature (T g) of 6FDA–PFMB was around 340 °C.Reference Li, Kim, Kulig, Savitski, Brittain, Harris, Cheng, Hubbard and Singer38
B. Electrospinning of PVDF/PAN blend fibers
To prepare the PVDF/PAN blend solution, PVDF was first dissolved in 80/20 (wt/wt) DMAc/THF at a predetermined concentration of 2.5 wt%. PAN was then added into the corresponding PVDF solution to reach a PVDF/PAN weight ratio of 20/80. To achieve optimal mixing for electrospinning, the mixture solution was kept under stirring for 12 h before ultrasonication at a power of 6 W using a Vibra-Cell ultrasonic processor (Sonics and Materials, Inc., Newton, CT) for ca. 30 min. Finally, a milk-like (macrophase-separated) mixture solution was obtained and immediately used for electrospinning and the total spinning time was within 1 h. Note that prolonged standing of the PVDF/PAN solution at ambient conditions for over 24 h resulted in complete phase separation into two immiscible layers (the PVDF-rich phase at the bottom and the PAN-rich layer on the top because PVDF has a higher density than PAN). The electrospinning setup consisted of a syringe pump, a high voltage supply (0–60 kV), and a home-made rotating drum as the collector. The PVDF/PAN mixture solution (2–3 mL) was loaded into a syringe with an 18-gauge needle and mounted onto the syringe pump. The optimal voltage was identified as 10–12 kV at a pump rate of 0.5 mL/h and a collector-to-needle tip distance of 12 cm. The spinning time was within 1 h to avoid coarsening of phase separation and possible variation in the composition of the mixture solution. After collection, the electrospun fibers were dried in vacuum at 50 °C for 3 days to thoroughly remove all solvents.
C. Stretching and recrystallization of PVDF/PAN blend fibers
A bundle of nonwoven PVDF/PAN 20/80 blend fibers was mechanically stretched at 110 °C by fixing its one end and then hanging a constant weight (1–5 g depending on the amount of fibers) at the other end in a Blue M G01300A gravity oven (White Deer, PA). An apparent draw ratio of 500% was obtained after stretching the as-spun fiber bundle at 110 °C for 10 h. Some stretched fibers were coated with 6FDA–PFMB to confine the PVDF/PAN 20/80 blend fibers for the melt-recrystallization studies. Typically, the stretched fibers were repeatedly dipped into a 1 wt%6FDA–PFMB/acetone solution, followed by being dried in a vacuum oven at room temperature for 24 h. The polyimide-coated PVDF/PAN 20/80 blend fibers were melted at 200 °C for 5 min before (i) isothermal crystallization at 130 °C for 1 h or (ii) quenching to ice water at 0 °C. Because the T g (340 °C) of 6FDA–PFMB was much higher than the annealing temperature (200 °C), the molten PVDF was effectively confined within the polyimide-coated blend fibers.
D. Instrumentation and characterization
Scanning electron microscopy (SEM) observation of electrospun fibers was performed on a JEOL JSM-6510 SEM (Tokyo, Japan). Samples were sputter-coated with gold before SEM observation. SEC was carried out with a Waters Breeze 2 HPLC equipped with a Waters 2410 differential refractive index detector and a Waters 2487 dual absorbance wavelength ultraviolet detector (Milford, MA). HPLC grade DMF was used as the solvent at a flow rate of 1.0 mL/min. Two Varian PolarGel-M mixed bed columns (Palo Alto, CA) were kept at 40 °C, and polystyrene standards were used for conventional calibration.
FTIR study of electrospun fibers was conducted on a Nicolet Nexus 870 FTIR spectrometer (Madison, WI) in the transmission mode. The scanning range was from 4000 to 400 cm−1. A total of 64 scans were collected at a resolution of 2 cm−1. For polarized FTIR on oriented blend fibers, an infrared polarizer was used. The angle of polarization was varied between 0 and 90° with 0° defined as parallel to the fiber axes. All polarized FTIR spectra were collected at room temperature.
Two-dimensional (2D) WAXD was performed on a Rigaku MicroMax 002+ diffractometer (Tokyo, Japan) operating at 45 kV and 0.88 mA, equipped with a Linkam HFS91 hot stage (Surrey, UK). A Confocal Max-Flux optics (Osmic, Inc., Troy, MI) was used with a sealed tube microfocus x-ray source, giving a highly focused beam of monochromatic Cu Kα radiation (wavelength λ = 0.1542 nm). The sample-to-detector distance was kept at 80.6 mm. The d-spacing was calibrated using silver behenate with the first-order reflection at a scattering vector q = 1.076 nm−1, where q = (4πsinθ)/λ with θ being the half scattering angle. One-dimensional (1D) WAXD profiles were obtained by integrating the corresponding 2D WAXD images radially using Polar X-ray Diffraction software (Stonybrook Technology and Applied Research, Stony Brook, NY).
III. RESULTS AND DISCUSSION
A. Morphology of as-spun and stretched electrospun PVDF/PAN 20/80 blend fibers
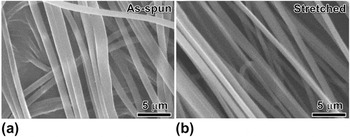
Bead-free electrospun fibers of the PVDF/PAN 20/80 (wt/wt) blend (in the form of overlaid mat or nonwoven fabric) were prepared at a total polymer concentration of 12.5 wt% using 80/20 (wt/wt) DMAc/THF as the solvent. The fiber diameters ranged from 0.6 to 1.56 μm with an average value of 0.93 μm [Fig. 1(a)]. After stretching at 110 °C to an apparent draw ratio of 500%, the PVDF/PAN 20/80 blend fibers appeared to be well-aligned along the stretching direction [i.e., the diagonal direction in Fig. 1(b)]. The fiber diameters decreased to 0.57–1.03 μm with an average value of 0.68 μm. Assuming a constant volume, the effective draw ratio was calculated to be 187%, much smaller than the apparent draw ratio of 500%. This was understandable because the initial stretching was used to straighten and align fibers in the nonwoven fabric; while in the later stage, the stretching force could be applied to the aligned fibers for effective elongation. On the basis of previous studies,Reference Zhong, Zhang, Su, Wang, Fong and Zhu19, Reference Na, Liu, Li, Zhao, Zhao and Yuan39–Reference Zhong, Wang, Zhang, Li, Fong and Zhu41 PVDF should more or less form a continuous phase in the PAN matrix although the PVDF content was only 20 wt%. This was different from a quiescent immiscible polymer blend with a weight composition of 20/80, and it could be attributed to the fast elongation rate during electrospinning of the polymer blend solution. After mechanical stretching, it was reasonable that the co-continuous morphology in electrospun PVDF/PAN 20/80 blend fibers would largely remain.
Scanning electron microscope (SEM) micrographs of (a) as-spun and (b) stretched (with an apparent draw ratio of 500%) electrospun poly(vinylidene fluoride)/polyacrylonitrile (PVDF/PAN) 20/80 blend fibers.

B. Crystal orientation and polymorphism studied by WAXD and conventional FTIR
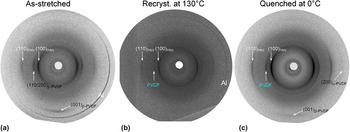
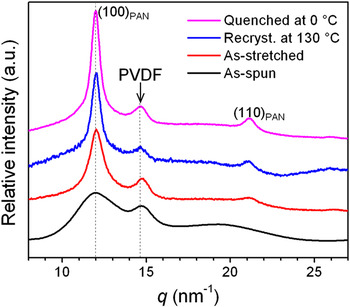
Crystal orientation and polymorphism for both PAN and PVDF were studied by 2D and 1D WAXD, as shown in Figs. 2 and 3, respectively. First, the as-spun (nonwoven) PVDF/PAN 20/80 blend fibers exhibited broad reflections for both PAN and PVDF (see Fig. 3), indicating that the time was not enough for them to crystallize into large crystallites during electrospinning. After crystallization, PAN had a hexagonal phase with the (100)PAN reflection at 11.96 nm−1.Reference Colvin and Storr42, Reference Liu and Ruland43 PVDF showed a broad reflection peak around 14.70 nm−1. On the basis of our recent report, PVDF crystallized into the ferroelectric β phase after electrospinning and it was attributed to both the stretching force and the applied electric field during electrospinning.Reference Zhong, Zhang, Su, Wang, Fong and Zhu19 After mechanical stretching at 110 °C, both (100)PAN and (110/200)β-PVDF reflections became sharper (see Fig. 3) and appeared on the equator [Fig. 2(a)]. Meanwhile, the (110)PAN reflection appeared on the equator and the (001)β-PVDF reflection was emerged on the meridian. This was attributed to the crystal perfection due to both mechanical stretching and thermal annealing at 110 °C. No α-PVDF reflections were observed in the 2D WAXD pattern in Fig. 2(a), confirming that PVDF was in the ferroelectric β-form after electrospinning and mechanical stretching.
Two-dimensional wide-angle x-ray diffraction (WAXD) patterns of PVDF/PAN 20/80 blend fibers: (a) as-stretched, (b) recrystallized at 130 °C, and (c) quenched into ice water at 0 °C. The outer most sharp reflections in (a) and (b) were attributed to aluminum since an aluminum foil was used as to collect fibers during electrospinning.

One-dimensional WAXD profiles for as-spun, as-stretched, recrystallized at 130 °C, and quenched (in ice water) at 0 °C electrospun PVDF/PAN 20/80 blend fibers.

After melting the as-stretched PVDF/PAN 20/80 blend fibers at 200 °C for 3 min, a significant amount of PVDF was found to leach out from the blend fibers. To avoid PVDF leaching due to melting, a high T g organosoluble polyimide, 6FDA–PFMB, was dip-coated onto the blend fibers using acetone as the solvent. After melting at 200 °C, the polyimide-coated PVDF/PAN 20/80 blend fibers were either isothermally recrystallized at 130 °C (for 1 h) or quenched in ice water at 0 °C. After melt-recrystallization, the coated polyimide was dissolved/removed by repeatedly dipping into pure acetone for a number of times until the FTIR spectrum showed no residue peaks from 6FDA–PFMB (data not shown). The corresponding 2D WAXD patterns and 1D WAXD profiles are shown in Figs. 2(b) and 2(c) and Fig. 3, respectively. For the blend fibers recrystallized at 130 °C, the (100)PAN and (110)PAN reflections became even sharper due to the crystal perfection induced by thermal annealing at 200 °C. The PVDF reflection was seen at 14.6 nm−1, which was between the (110/200)α-PVDF at 14.25 nm−1 and (110/200)β-PVDF at 14.70 nm−1. This suggested that PVDF might crystallize into both α and β phases. For the blend fibers quenched at 0 °C, the PVDF reflection peak was also seen at 14.6 nm−1. In addition, weak (001)β-PVDF and even weaker (200)α-PVDF reflections were observed in Fig. 2(c), indicating the coexistence of both α and β PVDF crystals after the melt-recrystallization process.
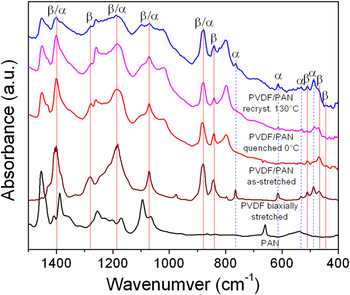
To confirm the WAXD results and gain more insights, an FTIR study was carried out and the results are shown in Fig. 4. For comparison, the FTIR spectra of pure PAN and biaxially stretched PVDF were also included. For biaxially stretched PVDF, which contained 27.5% α phase and 19.6% β phase, both α and β absorption peaks in FTIR were observed.Reference Guan, Wang, Pan, Wang and Zhu13 For as-stretched PVDF/PAN 20/80 blend fibers, only β absorption peaks were seen at 440, 469, 509, 840, 1278 cm−1, confirming that the as-stretched PVDF/PAN blend fibers only had the β phase. For melt-recrystallized PVDF/PAN 20/80 blend fibers, the β absorption peaks were still observed. In addition, some α absorption peaks were observed at 489, 532, 614, and 756 cm−1. These further confirmed the WAXD results in Figs. 2 and 3 that melt-recrystallization of the PVDF/PAN 20/80 blend fibers resulted in the formation of the kinetically favored α phase in PVDF. Compared to the stretched PVDF/PAN fibers melt-recrystallized at 130 and 0 °C, the sample recrystallized at 130 °C had a higher α content than the one quenched at 0 °C. This was consistent with a recent report that fast crystallization favored the formation of ferroelectric β crystals for PVDF.Reference Gradys, Sajkiewicz, Adamovsky, Minakov and Schick44
Fourier transform infrared (FTIR) spectra for PAN, biaxially stretched PVDF, and different PVDF/PAN 20/80 blend fibers: as-stretched, recrystallized at 130 °C, and quenched (in ice water) at 0 °C. Peak assignments for α and β PVDF phases are also indicated in the plot.

C. Crystal orientation and ferroelectric phase formation studied by polarized FTIR
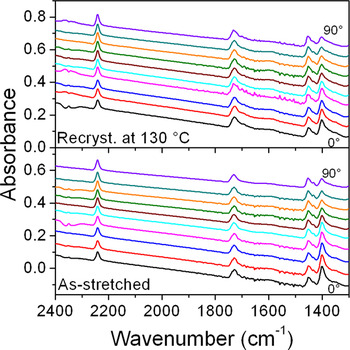
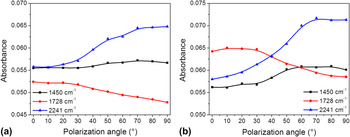
Figure 5 shows the polarized FTIR spectra for as-stretched and 130 °C recrystallized PVDF/PAN 20/80 blend fibers between 1300 and 2400 cm−1. In this region, the absorption bands at 1450 [δ(CH2) bending], 1728 [v(C=O) stretching, from itaconic acid and methyl acrylate units], and 2241 [v(C≡N) stretching] cm−1 were assigned to PAN. The increase of absorbance background at higher wavenumbers (or the slope in the baseline) could be attributed to the increased scattering of infrared light from the blend fibers. With increasing the polarization angle, the intensities of these absorption bands varied. Detailed analyses are shown in Fig. 6. For as-stretched PVDF/PAN blend fibers [Fig. 6(a)], the C≡N stretching band at 2241 cm−1 increased its absorbance with increasing the polarization angle and reached maximum at 90°. The absorbance for the CH2 bending band at 1450 cm−1 also increased with increasing the polarization angle, although the change was much smaller. Because C≡N stretching and CH2 bending were perpendicular to the PAN main chain in the crystals, these polarized FTIR results indicated that PAN chains in the crystals were parallel to the stretching direction. It was interesting to note that the C=O stretching band at 1728 cm−1 decreased its absorbance with increasing the polarization angle. Supposedly, the itaconic acid and methyl acrylate units should not be included in PAN crystals and the C=O stretching should be randomly oriented in the amorphous phase. However, we consider that these comonomer units could locate in the tie molecules between neighboring PAN lamellae. Therefore, they might also exhibit some orientation when the PAN lamellae were oriented by stretching. Because C=O stretching mostly aligned parallel to the chain direction, its absorbance should decrease with increasing the polarization angle. For the PVDF/PAN blend fibers quenched to 0 °C, similar trends were observed for the PAN absorption bands at 1450, 1728, and 2241 cm−1. However, the magnitudes in the change of absorbance were larger than those for the 130 °C recrystallized PVDF/PAN 20/80 blend fibers. This could be attributed to the crystal perfection when the fibers were annealed at 130 °C.
Polarized FTIR spectra between 1300 and 2400 cm−1 for as-stretched and 130 °C recrystallized PVDF/PAN 20/80 blend fibers at different polarization angles.

Absorbance at 1450, 1728, and 2241 cm−1 as a function of polarization angle for (a) as-stretched and (b) 130 °C recrystallized PVDF/PAN 20/80 blend fibers.

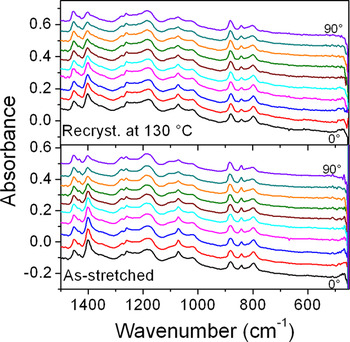
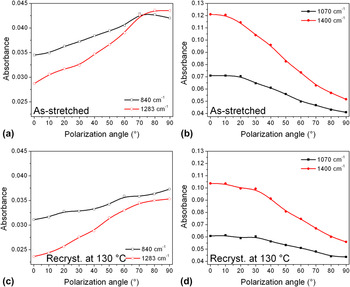
Figure 7 shows the polarized FTIR spectra for as-stretched and 130 °C recrystallized PVDF/PAN 20/80 blend fibers between 450 and 1500 cm−1. Again, the increase of absorbance background at higher wavenumbers (or the slope in the baseline) could be attributed to the scattering of infrared light from the blend fibers. In this region, the absorption bands at 840 and 1283 cm−1 were attributed to pure β PVDF crystals and the absorption bands at 1070 and 1400 cm−1 were attributed to both α and β PVDF crystals. With increasing the polarization angle, the absorbance in these bands varied and detailed analyses are shown in Fig. 8. For as-stretched PVDF/PAN blend fibers, the absorption in bands at 840 and 1283 cm−1 increased with increasing the polarization angle from 0 to 90° [Fig. 8(a)], whereas the absorption in bands at 1070 and 1400 cm−1 decreased with increasing the polarization angle from 0 to 90° [Fig. 8(b)]. The band at 840 cm−1 was assigned, in terms of potential energy distribution (PED), to r(CH2)(60) − v a(CF2)(31), and the band at 1283 cm−1 was assigned to v s(CF2)(40) − v s(CC)(22) + δ(CCC)(15).Reference Kobayashi, Tashiro and Tadokoro45 Here, v a stands for antisymmetric stretching, v s symmetric stretching, r rocking, and δ scissoring. The numbers in parenthesis represent the PED distribution obtained by the normal coordinate treatment for a single chain. Because the major contributions for the 840 cm−1 band [i.e., r(CH2)] and the 1283 cm−1 band [i.e., v s(CF2)] were perpendicular to the PVDF chains, the absorbance for these bands was the highest when the polarizer was perpendicular to the chain axes (or the stretching direction). On the other hand, the band around 1070 cm−1 was assigned to v a(CC)(54) − w(CF2)(22) + w(CH2)(24) for the β crystal and v s(CC)(65) for the α crystal.Reference Kobayashi, Tashiro and Tadokoro45 Here, w stands for wagging. The band around 1400 cm−1 was assigned to w(CH2)(58) − v a(CC)(35) for the β crystal and δ(CH2)(29) + w(CH2)(29) − v a(CC)(24) for the α crystal.Reference Kobayashi, Tashiro and Tadokoro45 Because the major contributions for the 1070 cm−1 band [v a(CC), w(CF2), w(CH2), and v s(CC)] and the 1400 cm−1 band [w(CH2), v a(CC), w(CH2), and v a(CC)] were parallel to the chains, their absorbance was the highest when the polarization angle was zero and the lowest when the polarization angle was 90°.
Polarized FTIR spectra between 450 and 1500 cm−1 for as-stretched and 130 °C recrystallized PVDF/PAN 20/80 blend fibers at different polarization angles.

Absorbance at (a and c) 840 and 1283 cm−1 and at (b and d) 1070 and 1400 cm−1 as a function of polarization angle for (a and b) as-stretched and (c and d) 130 °C recrystallized PVDF/PAN 20/80 blend fibers.

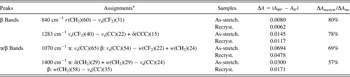
When the stretched PVDF/PAN 20/80 blend fibers were recrystallized at 130 °C, similar trends were observed for the β crystal absorption bands at 840 and 1283 cm−1 [Fig. 8(C)] and for the β/α crystal absorption bands at 1070 and 1400 cm−1 [Fig. 8(d)]. However, the magnitudes of the changes in absorbance, ΔA = |A 90° − A 0°|, for the 130 °C recrystallized sample were smaller than those for the as-stretched sample (see Table I). Meanwhile, when comparing the ratio of change in absorbance between the 130 °C recrystallized fibers and the as-stretched fibers, ΔA recryst./ΔA str., the ΔA recryst./ΔA str. values for the α/β absorption bands were always lower than those for the pure β absorption bands (see Table I). For example, the ΔA recryst./ΔA str. values for the β absorption bands were around ∼80%, whereas the values for the α/β absorption bands were around ∼57–69%. This result suggested that the orientation of β crystals was better than that of α crystals in the melt-recrystallized PVDF/PAN blend fibers.
Fourier transform infrared peak assignments and changes in absorbance between 0 (A 0°) and 90° (A 90°). Polarization angles for as-stretched and 130 °C recrystallized poly(vinylidene fluoride)/polyacrylonitrile (PVDF/PAN) 20/80 blend fibers.

a Potential energy distribution (PED) of α and β PVDF crystals.Reference Kobayashi, Tashiro and Tadokoro45 The numbers in parenthesis represent the PED distribution obtained by the normal coordinate treatment for a single chain.
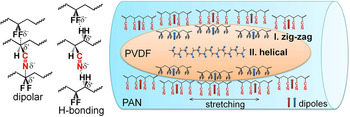
Through a previous study,Reference Zhong, Zhang, Su, Wang, Fong and Zhu19 we have understood the formation of ferroelectric β phase in electrospun PVDF/PAN blend fibers. The fast elongation (of spinning jet/filament) and electric field poling during the electrospinning process favor the zig-zag conformation of PVDF chains and thus result in the ferroelectric β phase. However, this does not explain the formation of the ferroelectric β phase in melt-recrystallized PVDF/PAN blend fibers because both elongation and electric field are absent. From the above results, we propose a possible mechanism for the formation of the ferroelectric β phase in melt-recrystallized PVDF/PAN blend fibers. As shown in Fig. 9, elongated PVDF domains are located in the PAN matrix in electrospun blend fiber with a co-continuous morphology. Therefore, most PVDF/PAN interfaces are parallel to the fiber axes. Because both PVDF and PAN are polar polymers, there are strong dipolar and hydrogen bonding interactions between VDF and AN units, as shown in the left panel of Fig. 9. They are similar to the dipolar and hydrogen bonding interactions proposed for PVDF/nylon 11 blends.Reference Li and Kaito32, Reference Li and Kaito33, Reference Gao and Scheinbeim46 After electrospinning and mechanical stretching, PAN chains in the crystals orient parallel to the blend fiber axes. At the PVDF/PAN interfaces, there are strong intermolecular interactions, favoring the zig-zag conformation in PVDF chains. Therefore, the ferroelectric β phase is formed near the PVDF/PAN interfaces during melt-recrystallization. This explains why the β-PVDF chains are parallel to the fiber axes. However, these interactions become weaker or even vanish further away from the interface. Therefore, in the center of the PVDF domain, the kinetically favored α phase still forms from melt-recrystallization. However, the α crystal orientation becomes poorer than that of the ferroelectric β phase near the PVDF/PAN interfaces. Intriguingly, the α crystal orientation still keeps parallel to the fiber axes. This is different from the stretched PVDF/nylon 11 blends, where the α crystal orientation intimately depends on the recrystallization temperatureReference Li and Kaito32, Reference Li and Kaito33: (i) below 50 °C, the c-axis of the α crystalline form is oriented parallel to the stretching direction, (ii) above 100 °C, the a-axis of the α crystals is oriented parallel to the stretching direction, (iii) between 75 and 100 °C, a tilt orientation of the a-axis of the α crystals with respect to the stretching direction is observed, and (iv) above 100 °C, the content of α crystals gradually decreases with increasing the temperature. We speculate that this difference may come from different PVDF domain sizes. In other words, the PVDF domain size is much smaller in the electrospun PVDF/PAN blend fibers than in conventional melt blends of PVDF and nylon 11. When PVDF is confined in submicron spaces, the confinement effect for its crystallization becomes much stronger and thus parallel α crystal orientation is obtained, possibly due to the parallel β crystals near the PVDF/PAN interfaces. Finally, the relative amount of the α crystals depends on the crystallization rate. At a high crystallization rate (e.g., quenched in ice water at 0 °C), less nonpolar α crystals are formed. At a normal crystallization rate (e.g., isothermally crystallized at 130 °C), more nonpolar α crystals are obtained.
Schematic representation of the polymorphism formation in melt-recrystallized PVDF/PAN blend fibers. The left panel shows possible dipolar and hydrogen bonding interactions between PAN and PVDF.

IV. CONCLUSIONS
In summary, crystal orientation and polymorphism of PVDF during melt-recrystallization of electrospun PVDF/PAN 20/80 blend fibers were investigated. Mechanical stretching was used to align the as-spun nonwoven blend fibers for the study of crystal orientation. WAXD and FTIR results showed that pure ferroelectric β-PVDF crystals were obtained after mechanical stretching at 110 °C, and both polar β-PVDF and PAN crystals were oriented with their chain axes parallel to the fiber axes. After melt-recrystallization for PVDF, coexistence of ferroelectric β and nonpolar α crystals were observed. Polarized FTIR study showed that the degree of orientation of ferroelectric β-PVDF crystals along the fiber axes was higher than that of nonpolar α crystals. Therefore, it was concluded that the β-PVDF crystals should be formed at the PVDF/PAN interfaces because of strong dipolar and hydrogen bonding interactions between VDF and AN units. The α-PVDF crystals should form in the center of the PVDF domain (or far away from the PVDF/PAN interface). Meanwhile, the blend fibers recrystallized at 130 °C exhibited a lower β-crystal content than the one quenched in ice water at 0 °C, suggesting that a fast crystallization rate favored the β-crystal formation.
ACKNOWLEDGMENTS
This work was supported by National Science Foundation (DMR-0907580). R. Su and G. Zhong acknowledge the Chinese Scholar Council for financial support. The authors thank Professor Gary Wnek and Mr. Linghui Meng at Case Western Reserve University for helping with electrospinning.