Introduction
In recent years, improvements in medical interventions and the availability of new therapies have resulted in an increase, not only in longevity (Moons et al., Reference Moons, Budts and De Geest2006), but also in the number of older people with chronic disease and disability. In such a scenario, ensuring a good quality of life (QoL) might well constitute the primary goal of medical and social interventions, and an outcome indicator both in clinical research and in program and service evaluation.
QoL is a multidimensional and complex construct consisting of four main areas: objective environment, behavioral competence (including health), perceived quality of life and subjective wellbeing (Lawton, Reference Lawton1997; Lau et al., Reference Lau, Cummins and McPherson2005). As a result, a wide range of QoL measurement tools available, often including different combinations of objective and subjective indicators (McDowell, Reference McDowell and McDowell2006).
Subjective wellbeing, measured directly by questioning people as to how they feel about their lives, provides a broad, global, comprehensive view of QoL (Lau et al., Reference Lau, Cummins and McPherson2005). The International Wellbeing Index (IWI), which is made up of the Personal Wellbeing Index (PWI) (International Wellbeing Group, 2006) and the National Wellbeing Index (NWI) (Cummins et al., Reference Cummins, Eckersley, Pallant, Van Vugt and Misajon2003), is a generic measure of a given population's or nation's perceived wellbeing. The PWI and NWI have been translated into several languages including Spanish, and their psychometric properties have been established in various studies (Cummins et al., Reference Cummins, Eckersley, Pallant, Van Vugt and Misajon2003; Lau et al., Reference Lau, Cummins and McPherson2005; Tiliouine et al., Reference Tiliouine, Cummins and Davern2006; Davey et al., Reference Davey, Chen and Lau2009; Renn et al., Reference Renn, Pfaffenberger, Platter, Mitmansgruber, Cummins and Hofer2009). Moreover, the PWI has been used for relatively large population studies (Casas et al., Reference Casas, Figuer, Gonzalez and Malo2007; Chen and Davey, Reference Chen and Davey2009; Smyth et al., Reference Smyth, Nielsen and Zhai2010; Yiengprugsawan et al., 2010) and for assessing the impact of physical conditions on subjective wellbeing (Lau et al., Reference Lau, Chi, Cummins, Lee, Chou and Chung2008; Glazov et al., Reference Glazov, Schattner, Lopez and Shandley2009). However, there are no studies that have specifically focused on the psychometric functioning of the PWI and NWI among older adults. This is extremely important, since there has been a growing interest in wellbeing issues affecting this section of the population (World Health Organization, 2002).
Accordingly, this study sought to (1) analyze the psychometric attributes of the PWI and NWI in a Spanish sample of community-dwelling people aged 60 years and over; (2) ascertain the functioning and usefulness of these indices in this age group; (3) and identify factors associated with the subjective wellbeing of this population.
Methods
Sample
The study was designed as a national, cross-sectional survey on global QoL in community-dwelling adults aged 60 years and over.
The sample was randomly selected from the 2001 Spanish Population and Housing Census, and stratified by autonomous region (Comunidad Autónoma)(14 groups), town population size (7 groups), gender and age (60–70, 71–84 and 85 years and over).
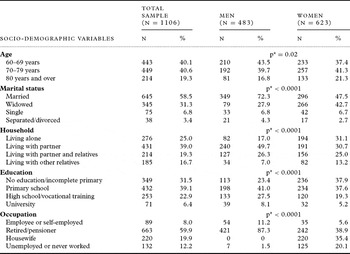
The sample was made up of 1106 adults, of whom 56.3% were women, mean (± standard deviation) age of 72.1 ± 7.8 years. The socio-demographic characteristics of the sample are shown in Table 1 and display significant gender-related differences in terms of marital status, household arrangement, educative level and occupation (Table 1).
Socio-demographic characteristics of the sample by gender

* χ2 test
Participants were surveyed using face-to-face, home-based questionnaires. Individuals with suspected cognitive deterioration as per Pfeiffer's Short Portable Mental Status Questionnaire (Pfeiffer, Reference Pfeiffer1975) (more than four errors) were excluded.
Ethical aspects
Prior written informed consent was obtained from all participants, and the study was formally approved by the Institutional Review Board of the Carlos III Institute of Health.
Assessments
The participants’ socio-demographic data were collected and the following rating scales applied: the IWI, a combination of the PWI and NWI (Cummins et al., Reference Cummins, Eckersley, Pallant, Van Vugt and Misajon2003; International Wellbeing Group, 2006; Renn et al., Reference Renn, Pfaffenberger, Platter, Mitmansgruber, Cummins and Hofer2009); a Comorbidity Index, adapted from the Cumulative Illness Rating Scale for Geriatrics (CIRS-G) (Miller et al., Reference Miller1992); the Functional Independence Scale (FIS) (Martinez-Martin et al., Reference Martinez-Martin2009a) and the Barthel Index (Mahoney and Barthel, Reference Mahoney and Barthel1965) for evaluating functional ability; the Hospital Anxiety and Depression Scale-Depression subscale (HADS-D) (Zigmond and Snaith, Reference Zigmond and Snaith1983); the Sense of Coherence Scale (SOC), short version (Lundberg and Nyström Peck, Reference Lundberg and Nyström Peck1995), for assessing general orientation to life; the Loneliness Scale-6 items (de Jong Gierveld and van Tilburg, Reference de Jong Gierveld and van Tilburg2006); the Duke-UNC Functional Social Support Questionnaire (DUFSS) (Broadhead et al., Reference Broadhead, Gehlbach, de Gruy and Kaplan1988); and the EQ-5D index and visual analogue scale (VAS) (EuroQol Group, 1990) for evaluation of health-related quality of life. These instruments were chosen because, as has been shown in previous studies with Spanish samples, they afford a valid and reliable measure of subjective wellbeing-related aspects.
The PWI (International Wellbeing Group, 2006) comprises seven items measuring satisfaction with standard of living, health, achieving in life, relationships, safety, community-connectedness and future security, a set of domains that represent the first level deconstruction of “satisfaction with life as a whole”. As it is more widely used, the 7-item rather than the 8-item version of the PWI was chosen. The NWI (Cummins et al., Reference Cummins, Eckersley, Pallant, Van Vugt and Misajon2003; Renn et al., Reference Renn, Pfaffenberger, Platter, Mitmansgruber, Cummins and Hofer2009) assesses satisfaction with life in a given country, and is made up of six items, i.e. economic situation, state of the environment, social conditions, government, business and national security. Both instruments are scored on a Likert-type scale from 0 (completely dissatisfied) to 10 (completely satisfied). The same scale was applied to two items assessing satisfaction with life as a whole and life in Spain.
In all cases, higher scores in the above instruments reflect a higher level of the construct being measured.
Data analysis
As most scales did not fit a normal distribution, non-parametric statistics were used for hypothesis testing. Descriptive statistics were applied to socio-demographic data. Since the IWI is represented by two independent scores, the following psychometric properties were explored separately for the PWI and NWI: acceptability; internal consistency; convergent and discriminative validity; and precision.
Acceptability (completeness of data and score distribution) was assessed on the basis of data quality (with >95% of fully computable data being deemed acceptable), score ranges, closeness of means to medians, floor and ceiling effects (patients scoring in the lowest and highest values of the scale; maximum accepted for both: 15%), and skewness of score distributions (limits: −1 to +1) (Martinez-Martin et al., Reference Martinez-Martin2009a).
With regard to internal consistency (extent to which items included in a scale measure the same construct), the following were analyzed: Cronbach's α coefficient (minimum accepted value: 0.70; Martinez-Martin et al., Reference Martinez-Martin2009a); item homogeneity (mean of the inter-item correlation coefficients; criterion value: ≥0.30; Martinez-Martin et al., Reference Martinez-Martin2009a); and item-total correlation corrected for overlap (relationship between any given item and the sum of the other items belonging to the same subscale; criterion value: ≥0.30; Martinez-Martin et al., Reference Martinez-Martin2009a). Three exploratory factor analyses (EFAs), using principal components method with varimax rotation, were conducted to determine IWI, PWI and NWI structure.
For convergent validity (correlation with other measures of the same or similar constructs), we hypothesized that the PWI would be strongly associated with the HADS-D, Loneliness Scale, DUFSS, SOC, EQ-5D, and the “satisfaction with life” item (Spearman's rank correlation coefficient, rS > 0.50; Juniper et al., Reference Juniper, Guyatt, Jaeschke and Spilker1996); and that it would be moderately associated with the FIS, Barthel Index and NWI (rS = 0.35–0.50; Juniper et al., Reference Juniper, Guyatt, Jaeschke and Spilker1996).
To check discriminative validity (a scale's ability to differentiate between groups of patients), the sample was grouped by gender, age (60–69, 70–79 and 80 years and over), education, level of functional social support (by DUFSS score), and HADS-D cut-off point for depression (Zigmond and Snaith, Reference Zigmond and Snaith1983). Wilcoxon-Mann-Whitney and Kruskal-Wallis tests were then applied to compare PWI and NWI scores according to the above groups.
PWI and NWI precision was assessed by means of the standard error of measurement (SEM) for a single observation (SEM = SD × √ [1 – α]) (Beaton et al., Reference Beaton, Bombardier, Katz and Wright2001), setting an arbitrary criterion value of SEM ≤ half a standard deviation (indicative of Cronbach's α ≥0.75).
To identify the determinants of personal wellbeing, a step-wise linear regression analysis of the PWI was performed, with the study variables being previously grouped, using an EFA and the principal components method with varimax rotation. The resulting factors were taken as independent variables in the regression model.
Results
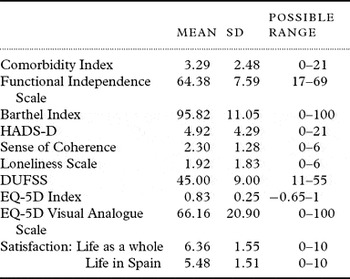
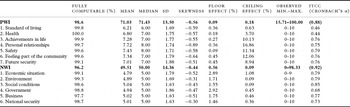
Descriptive statistics of the applied rating scales are shown in Table 2. Mean scores were as follows: PWI, 71.0 ± 13.5, range 15.7–100; NWI, 49.5 ± 14.4, range 0–98.3. Insofar as data quality and acceptability were concerned (Table 3), 98.6% of the PWI and 96.2% of the NWI data were computable. The difference between mean and median was 0.40 for PWI and 0.49 for NWI total scores. No prominent floor or ceiling effects were detected in the PWI and NWI total scores.
Descriptive statistics of the applied rating scales

SD = standard deviation; HADS-D = Hospital Anxiety and Depression Scale, Subscale Depression; DUFSS = Duke-UNC Functional Social Support Scale.
Data quality, acceptability and internal consistency of the PWI and NWI

SD = standard deviation; Min. = minimum; Max. = maximum; ITCC = Item-total corrected correlation; PWI = Personal Wellbeing Index; NWI = National Wellbeing Index.
As regards internal consistency, Cronbach's α was 0.88 for the PWI, and 0.92 for the NWI. Item homogeneity was 0.52 for the PWI and 0.65 for the NWI. Item-total corrected correlation ranged from 0.44 to 0.79 for the PWI, and from 0.68 to 0.85 for the NWI (Table 3).
When an EFA was applied to the PWI, two factors emerged that accounted for 65.9% of the variance, each factor corresponding to a series of PWI and NWI items respectively. In addition, the EFA identified one factor in the PWI accounting for 60.14% of the variance, and one factor in the NWI accounting for 71.38% of the variance.
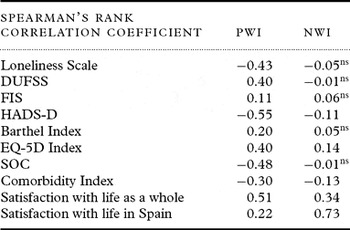
With reference to convergent validity (Table 4), the PWI showed a correlation of 0.50 with the “satisfaction with life” item, and −0.54 with the HADS-D, whereas the NWI showed a correlation of 0.73 with the “satisfaction with the nation” item. Moderate correlation coefficients were observed between the PWI and the SOC, Loneliness Scale, EQ-5D and DUFSS (|rS| = 0.40–0.48). The PWI and NWI registered a correlation of 0.14 with each other. While correlation between the PWI and age, albeit low (0.17), was significant (p < 0.001), that of the NWI and age did not prove significant (rS = −0.03).
Convergent validity of the PWI and NWI

n.s. = non-significant. All others, significant at a p = 0.01 level.
PWI = Personal Wellbeing Index; NWI = National Wellbeing Index; DUFSS = Duke-UNC Functional Social Support Scale; FIS = Functional Independence Scale; HADS-D = Hospital Anxiety and Depression Scale, Subscale Depression; SOC = Sense of Coherence Scale.
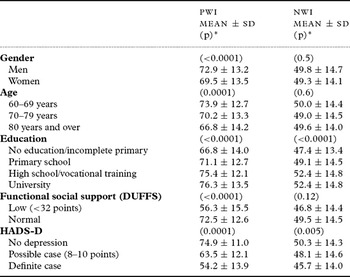
Table 5 shows PWI and NWI mean scores by subject group. Women, older subjects, and persons with less social support, a lower educational level or suspected depression scored lower on the PWI (p < 0.0001) than did the remaining respondents. In the case of the NWI, worse scores corresponded to persons with a lower educational level (p = 0.005) or suspected depression (p = 0.05).
Known-groups validity of the PWI and NWI

*Mann-Whitney or Kruskal-Wallis tests.
SD = standard deviation; DUFFS = Duke-UNC Functional Social Support Scale; HADS-D = Hospital Anxiety and Depression Scale – Subscale Depression.
The SEM was 4.67 for the PWI and 4.06 for the NWI (with ½SD being 6.75 for the PWI, and 7.2 for the NWI).
The EFA assembled the variables of the study into four groups that accounted for 55.8% of the variance. These were: Factor 1 (psychosocial), composed of the DUFSS, Loneliness, HADS-D and SOC scales; Factor 2 (functional), composed of the FIS, Barthel Index and EQ-5D Index; Factor 3 (health state), composed of the EQ-5D VAS and Comorbidity Index; and Factor 4 (socio-demographic), composed of gender, age, marital status and living arrangements. For the PWI, the regression model (F = 16.89, p < 0.001) accounted for 46.8% of the variance. The psychosocial factor proved to be the main determinant of the PWI (β = −0.59, p < 0.0001), followed by the health state (β = −0.25, p < 0.0001) and functional factors (β = 0.22, p < 0.0001).
Discussion
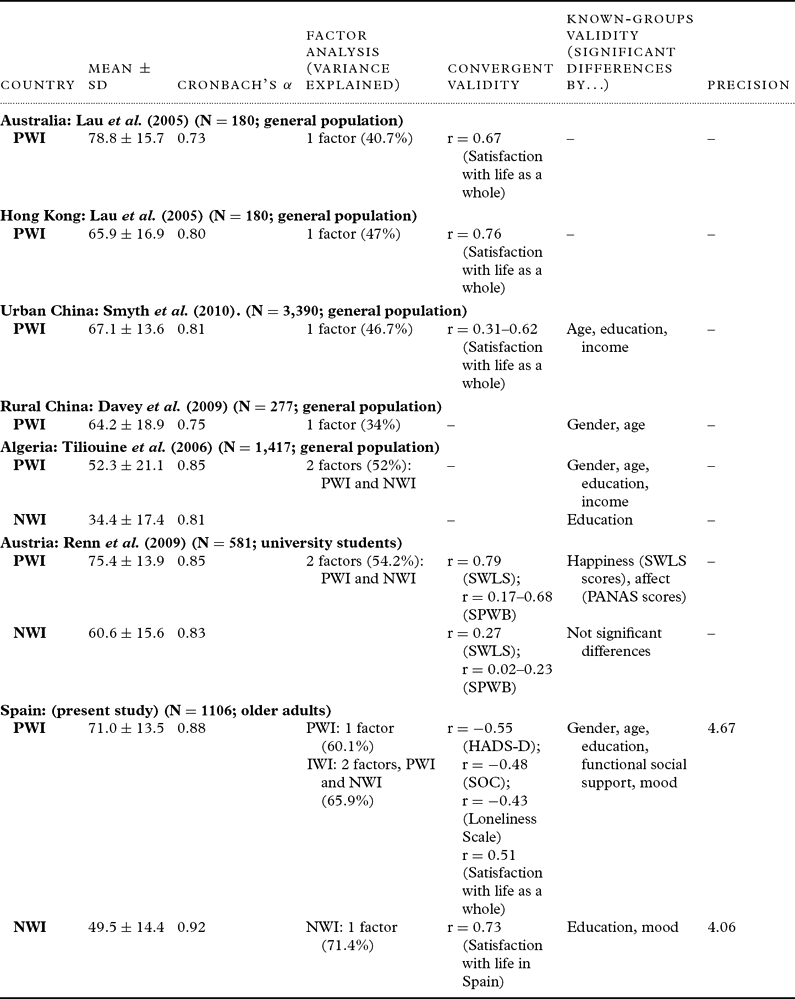
The aim of the present study was to analyze the psychometric properties of the IWI in community-dwelling persons aged 60 years and over. This was the first validation study of this scale in this population group, though it had been previously validated in other countries for use in the general population (Cummins et al., Reference Cummins, Eckersley, Pallant, Van Vugt and Misajon2003; Lau et al., Reference Lau, Cummins and McPherson2005; Tiliouine et al., Reference Tiliouine, Cummins and Davern2006; Renn et al., Reference Renn, Pfaffenberger, Platter, Mitmansgruber, Cummins and Hofer2009). Although some of these other studies included older subjects as a part of the sample, they were not specifically designed to validate the scale in this age group (Table 6).
Comparison between PWI and NWI validation studies
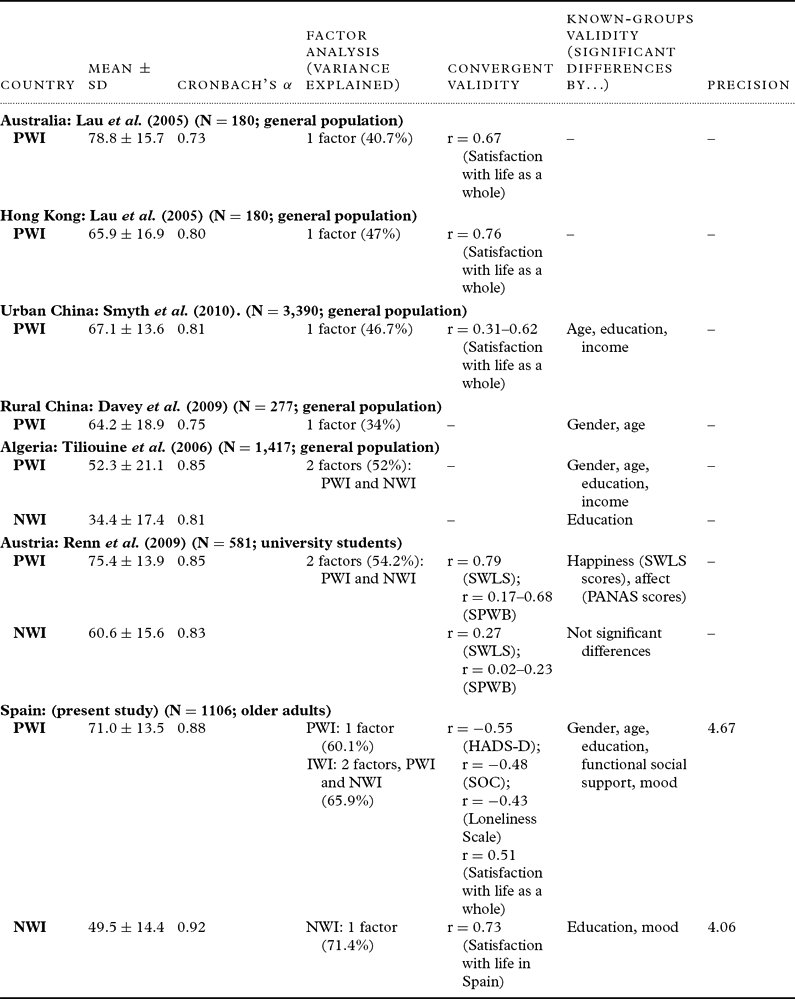
SWLS = Satisfaction with Life Scale; SPWB = Scales of Psychological Well-being; PANAS = Positive and Negative Affect Scale; HADS-D = Hospital Anxiety and Depression Scale, Subscale Depression; SOC = Sense of Coherence Scale.
In general, data quality and acceptability were satisfactory, reflecting that most items are adequate for and relevant to the respondents. The percentage of missing data was less than 5% for both the PWI and NWI. The PWI “future security” and NWI “business” items had the highest percentage of missing data, a finding probably related to the characteristics of the study population (elderly people with a low educational level). All items, except for the NWI item on “economic situation”, covered the whole range of scores (0–10), and only the PWI “personal relationships” item displayed a slight ceiling effect. As a whole, these results are in line with previously reported findings (Renn et al., Reference Renn, Pfaffenberger, Platter, Mitmansgruber, Cummins and Hofer2009).
PWI and NWI internal consistency was likewise adequate. Cronbach's α coefficients were slightly higher in this than in previous studies (Chen and Davey Reference Chen and Davey2009; Cummins et al., Reference Cummins, Eckersley, Pallant, Van Vugt and Misajon2003; Lau et al., Reference Lau, Cummins and McPherson2005; Tiliouine et al., Reference Tiliouine, Cummins and Davern2006; Lau et al., Reference Lau, Chi, Cummins, Lee, Chou and Chung2008; Davey et al., Reference Davey, Chen and Lau2009; Renn et al., Reference Renn, Pfaffenberger, Platter, Mitmansgruber, Cummins and Hofer2009; Smyth et al., Reference Smyth, Nielsen and Zhai2010; Yiengprugsawan et al., 2010). The PWI “health” and “standard of living” items yielded the lowest item-total corrected correlation coefficients (0.44 and 0.46, respectively), yet these were still over the minimum acceptable value. Further studies using confirmatory factor or Rasch analysis techniques would help confirm the PWI structure in this population group.
As in other studies (Tiliouine et al., Reference Tiliouine, Cummins and Davern2006; Renn et al., Reference Renn, Pfaffenberger, Platter, Mitmansgruber, Cummins and Hofer2009), the structure in the two IWI subscales is supported by the EFA. Similarly, the EFA results for the PWI and NWI also agreed with those reported by previous studies (Table 6).
With regard to convergent validity, as expected the PWI and the NWI showed a high level of correlation with the items addressing “satisfaction with life as a whole” and “satisfaction with life in Spain” respectively, and the PWI correlated with the HADS-D. The moderate coefficient of correlation between the PWI and EQ-5D indicates that they assess only partially associated aspects of the “quality of life” construct. The PWI also showed a moderate level of correlation with the Loneliness Scale, DUFSS and SOC, all of which measured QoL-related concepts. Accordingly, the PWI and the NWI can be deemed to have shown satisfactory convergent validity.
The PWI total score was significantly higher for men than for women. While some studies have reported that men enjoy better subjective wellbeing than women (Tiliouine et al., Reference Tiliouine, Cummins and Davern2006; Davey et al., Reference Davey, Chen and Lau2009; Yiengprugsawan et al., 2010), the relationship between gender and wellbeing is far from clear (Pinquart and Sorensen, Reference Pinquart and Sorensen2001; Cummins, et al., Reference Cummins, Eckersley, Pallant, Van Vugt and Misajon2003). Compared to their male counterparts, the women in our sample were older, mostly widowed, had a lower educational level, tended to be housewives and showed a greater tendency to live alone (Table 1), all of which are characteristics that have been previously associated with a poorer quality of life (Pinquart and Sorensen, Reference Pinquart and Sorensen2001; Lau et al., Reference Lau, Chi, Cummins, Lee, Chou and Chung2008).
As regards the association between the PWI and age, whereas some authors have observed a decline in personal wellbeing with age (Davey et al., Reference Davey, Chen and Lau2009), others have reported that after age 55, personal wellbeing tends either to improve (Tiliouine et al., Reference Tiliouine, Cummins and Davern2006; Smyth et al., Reference Smyth, Nielsen and Zhai2010) or at least remain stable (Cummins et al., Reference Cummins, Eckersley, Pallant, Van Vugt and Misajon2003; Netuveli and Blane, Reference Netuveli and Blane2008). Our results suggest a decline in personal wellbeing with age. Nevertheless, personal wellbeing at this time in life is influenced by many factors other than age alone (e.g. physical health, housing conditions, income, personality, etc.) (Schneider et al., Reference Schneider, Driesch, Kruse, Nehen and Heuft2006).
Furthermore, people with less functional social support and suspected depression also scored lower on the PWI (Table 5). Depression and lack of social networks have been shown to have a negative impact on quality of life in old age (Netuveli and Blane, Reference Netuveli and Blane2008).
The relative importance of the influence of different factors on the PWI was specifically analyzed using a multiple regression model. The results indicate that, above and beyond socio-demographic differences, psychosocial factors (depression and functional social support) are an important predictor of the PWI.
NWI scores were significantly higher for persons with higher educational levels and lower for those with suspected depression (Table 5). The relationship between the NWI and education was explored in Algeria (Tiliouine et al., Reference Tiliouine, Cummins and Davern2006) with the opposite result (higher scores among groups having no formal education or having primary school education), possibly reflecting the influence of the different socio-cultural settings.
The SEM, an index of precision, quantifies the error of the observed score. Values found in the present study (4.67 for the PWI and 4.06 for the NWI) proved clearly lower than the respective ½ SDs. The PWI and the NWI thus showed satisfactory precision in a cross-sectional setting, indicative of potentially satisfactory responsiveness (Terwee et al., Reference Terwee, Dekker, Wiersinga, Prummel and Bossuyt2003).
Mention should be made of some limitations of our study. In the first place, there is no gold standard for subjective wellbeing. However, this is so for all psychological constructs, and the PWI is internationally accepted as a measure of subjective wellbeing. In addition, though a re-test might have been desirable, personal wellbeing is characterized by its relative stability, even at advanced ages (Cummins et al., Reference Cummins, Eckersley, Pallant, Van Vugt and Misajon2003).
In this study, both the PWI and NWI displayed good acceptability and proved to be reliable, valid and precise measures of subjective wellbeing in the community-dwelling Spanish population aged 60 years and over. Research in psychogeriatrics would greatly benefit from a valid and reliable instrument such as the IWI, which could be used as an outcome measure in interventions.
Conflict of interest
None.
Description of authors' roles
C. Rodriguez-Blazquez designed the study, performed the statistical analysis and drafted the paper. B. Frades-Payo and A. Ayala assisted with the statistical analysis and reviewed the paper for important conceptual content. M. J. Forjaz, P. Martinez-Martin, G. Fernandez-Mayoralas and F. Rojo-Perez helped design the study and reviewed the paper for important conceptual content.
Acknowledgments
This study was supported by the Spanish Ministry of Science & Innovation (National R+D+i Plan: ref. SEJ2006-15122-C02-00).
Members of the Spanish Group on Quality of Life and Ageing: M. Joao Forjaz, Pablo Martinez-Martin, María Eugenia Prieto-Flores, Belen Frades-Payo, Carmen Rodriguez-Blazquez and Concepcion Delgado-Sanz at the Carlos III Institute of Health; and Gloria Fernandez-Mayoralas, Fermina Rojo-Perez, Karim Ahmed-Mohamed and Raul Lardies-Bosque at the Spanish National Research Council.