




1 Introduction
The laminar–turbulent transition process in high-speed boundary layers is difficult to investigate. In experimental facilities not all relevant conditions for free flight can be matched at once (Marineau et al. Reference Marineau, Grossir, Wagner, Leinemann, Radespiel, Tanno, Wadhams, Chynoweth, Schneider and Wagnild2018), whereas in the numerical investigations one of the main difficulties is to generate a representative free-stream disturbance environment to match those in the experimental facilities or in free flight, as these are largely unknown. Various possible free-stream disturbance mechanisms that may be relevant for laminar–turbulent transition in ground-based wind tunnel tests and/or free flight were summarized by Bushnell (Reference Bushnell1990). A theoretical model developed by Fedorov (Reference Fedorov2013) for one of the disturbance sources identified by Bushnell (Reference Bushnell1990) showed that solid particulates can excite instability waves in the high-speed boundary layer upon impact on the vehicle surface. Building on the theoretical model by Fedorov (Reference Fedorov2013), direct numerical simulations (DNS) by Chuvakhov, Fedorov & Obraz (Reference Chuvakhov, Fedorov and Obraz2019) showed that particle impact generates a wave packet that may ultimately lead to transition on a  $14^{\circ }$ half-angle wedge at
 $M=4$. That investigation has shown that wave packets are not only a model for ‘natural’ transition (initiating the breakdown process by broadband disturbances), but that the investigation of a wave packet in high-speed boundary layers also has relevance as it can be considered to be a model of disturbances that are generated in the boundary layer by particle impact.
For stability and transition investigations of high-speed boundary layers, wave packets initiated by a short-duration pulse disturbance have been previously considered as a model of ‘natural’ transition and for the understanding of the relevant nonlinear transition mechanisms (see, for example, Mayer, Laible & Fasel (Reference Mayer, Laible and Fasel2009, Reference Mayer, Laible and Fasel2011a), Sivasubramanian & Fasel (Reference Sivasubramanian and Fasel2014), Salemi et al. (Reference Salemi, Fasel, Wernz and Marquart2014) and Salemi & Fasel (Reference Salemi and Fasel2015)). The development and breakdown of a wave packet to a turbulent spot was investigated by Sivasubramanian & Fasel (Reference Sivasubramanian and Fasel2012) for a straight cone geometry and by Chuvakhov, Fedorov & Obraz (Reference Chuvakhov, Fedorov and Obraz2018) for a flat plate at Mach 6. The dynamics and characteristics of isolated turbulent spots in a high-speed boundary layer triggered by a large-amplitude localized disturbance were studied by Krishnan & Sandham (Reference Krishnan and Sandham2006a,Reference Krishnan and Sandhamb), Jocksch & Kleiser (Reference Jocksch and Kleiser2008) and Redford, Sandham & Roberts (Reference Redford, Sandham and Roberts2012). The characteristics of merging of turbulent spots were discussed by Krishnan & Sandham (Reference Krishnan and Sandham2006c). The only hypersonic experiments where a wave packet was initiated by a pulse (using a pulsed-glow perturber) to generate a turbulent spot were carried out by Casper, Beresh & Schneider (Reference Casper, Beresh and Schneider2014), who also provided an excellent overview of the work on turbulent spots for incompressible and compressible (high-speed) flow.
The focus of the results discussed in the present paper is on the development of a wave packet from the linear stages all the way to the late nonlinear stages. It is of particular interest which nonlinear mechanisms will prevail in the breakdown of a wave packet that is initiated by a short-duration pulse through a small ‘hole’ (compact disturbance source). Due to the notable differences (i.e. much wider computational domain in the azimuthal direction) compared to the ‘controlled’ fundamental breakdown (Hader & Fasel Reference Hader and Fasel2019) and the random forcing DNS (Hader & Fasel Reference Hader and Fasel2018) for the same geometry and flow conditions, it is not at all clear a priori if a wave packet will lead to the same dominant nonlinear mechanisms as for controlled or random forcing, or if it may result in entirely different breakdown scenarios. For a short-duration pulse disturbance, initially highly oblique disturbance waves are introduced into the computational domain due to the very small size of the forcing hole. The presented wave packet simulation will answer the question if these oblique disturbance waves will remain relevant far downstream and lead to a different nonlinear breakdown. Although the short-duration pulse forcing generates a broad disturbance spectrum, similar to the random forcing (Hader & Fasel Reference Hader and Fasel2018), for the pulse forcing the phases between the forced disturbance components are initially fixed relative to each other, which is not the case for random forcing. These differences may have a major impact on the ensuing nonlinear coupling processes between the various disturbance wave components and may thus influence the nonlinear mechanisms. A highly resolved wave packet simulation all the way to the late nonlinear stages, as presented in this paper, will provide answers for a series of important questions raised above.
2 Computational set-up
For the DNS presented here, the flared cone geometry (nose half-angle  $\unicode[STIX]{x1D703}_{cone}=1.4^{\circ }$, cone length
 $L_{cone}=0.52~\text{m}$, cone flare
 $r_{flare}=3~\text{m}$) and the flow conditions (Mach number
 $M=6$, stagnation pressure
 $p_{0}=140~\text{psi}$, stagnation temperature
 $T_{0}=420~\text{K}$, unit Reynolds number
 $Re_{1}=10.82\times 10^{6}~\text{m}^{-1}$) of the experiments in the Purdue quiet tunnel (BAM6QT) were used (Chynoweth Reference Chynoweth2018). The nose radius of the flared cone is small enough (
 $r_{nose}=0.1016~\text{mm}$) so that it can be considered to be a sharp cone. A schematic of the computational domain together with the reference Cartesian (
 $x,y,z$) and body-fitted (
 $\unicode[STIX]{x1D709},\unicode[STIX]{x1D702},\unicode[STIX]{x1D701}$) coordinate systems are provided in figure 1. The local cone radius,
 $r_{cone}(x)$, is measured perpendicular from the cone axis to the surface of the cone. The unrolled coordinate is calculated as
 $\unicode[STIX]{x1D701}=\unicode[STIX]{x1D711}r$. For the investigations presented here, a simulation strategy was employed that has been successfully used for previous ‘controlled’ breakdown simulations (see, for example, Laible & Fasel (Reference Laible and Fasel2011), Mayer, Von Terzi & Fasel (Reference Mayer, Von Terzi and Fasel2011b), Sivasubramanian & Fasel (Reference Sivasubramanian and Fasel2015) and Hader & Fasel (Reference Hader and Fasel2019)) and is described in detail in Laible (Reference Laible2011). The fluid is considered to be a perfect gas (air) with a constant Prandtl number (
 $Pr=0.71$) and a constant ratio of specific heats (
 $\unicode[STIX]{x1D6FE}=1.4$), and the viscosity is calculated using Sutherland’s law.
The initial conditions for the wave packet simulation in the computational domain (figure 1) are obtained from an axisymmetric (zero angle of attack) precursor calculation using a finite volume code (for details, see Gross & Fasel (Reference Gross and Fasel2008)). The wall is assumed to be isothermal ( $T_{w}=300$ K) because the wall temperature of the model remains nearly constant in the experiments due to the very short run times of the BAM6QT (see Chynoweth Reference Chynoweth2018). This results in a wall to recovery temperature ratio of
 $T_{w}/T_{r}=0.83$, which is unrealistically high compared to values encountered in free flight due to the low static free-stream temperature of the BAM6QT (
 $T_{\infty }=51.22~\text{K}$). Conventional tunnels such as the Arnold Engineering Development Complex (AEDC) Hypervelocity Wind Tunnel 9 (
 $T_{w}/T_{r}=0.3$, Marineau (Reference Marineau2016)) or the T5 Reflected Shock Tunnel at Caltech (
 $0.05<T_{w}/T_{r}<0.12$, Jewell, Leyva & Shepherd (Reference Jewell, Leyva and Shepherd2017)) reach more realistic wall to recovery temperature ratios but have higher levels of free-stream noise and are therefore not considered to be ‘quiet’ tunnels. The wave packet simulation was carried out with an in-house-developed high-order-accurate compressible Navier–Stokes code (for details, see Laible & Fasel (Reference Laible and Fasel2011) and Laible (Reference Laible2011)).
At the inflow and the free-stream boundary five grid points are used to enforce the laminar base flow values obtained from the precursor calculation. Periodicity and symmetry conditions are imposed at the azimuthal boundaries, and at the outflow boundary a buffer region is employed with a ramp function (Meitz Reference Meitz1996) that effectively ‘relaminarizes’ the flow.
The inflow of the domain is located at  $x=0.15$ m and the outflow at
 $x=0.5254$ m. The nose region was deliberately omitted in this investigation in order to focus all computational resources on the nonlinear development further downstream. The choice of the location of the inflow boundary was based on results from primary linear instability calculations using a low-amplitude pulse calculation (Hader & Fasel Reference Hader and Fasel2019), which showed that the second mode is already amplified at
 $x=0.15$ m. This avoids having to compute through the stable region of the boundary layer, where the disturbance waves are decaying.
Schematic of computational domain.

Cross-section plane for the flared cone showing an axisymmetric wave and oblique waves with  $k_{c}=2$ and
 $k_{c}=4$.

In the wall-normal direction the computational domain extends from the surface of the cone up to  $\unicode[STIX]{x1D702}=0.09$, which corresponds to approximately 100 boundary layer thicknesses at the outflow boundary. Using such a relatively large extent of the computational domain perpendicular to the wall avoids spurious reflections of the disturbance waves at the free-stream boundary that are radiated from the boundary layer and could potentially interfere with the wave packet.
In the azimuthal direction the computational domain is one quarter of the cone ( $0\leqslant \unicode[STIX]{x1D711}\leqslant \unicode[STIX]{x03C0}/2$). Thus, in the azimuthal direction even integer multiples of the azimuthal wavenumber (
 $k_{c}=2\unicode[STIX]{x03C0}/\unicode[STIX]{x1D706}_{\unicode[STIX]{x1D701}}$) can be resolved, as schematically depicted in figure 2. Employing the symmetry and periodicity boundary conditions in the azimuthal direction, the largest azimuthal wavelength that can be captured is
 $\unicode[STIX]{x1D706}_{\unicode[STIX]{x1D701}}(x)=r_{cone}(x)\unicode[STIX]{x03C0}$, as shown in the normalized cone cross-section or in the unrolled coordinate (normalized with the local circumference) in figure 2. The wave components that are resolved in the azimuthal computational domain are provided as a solid line and the periodic extensions are given as dashed lines in figure 2. Note that odd wavenumbers
 $k_{c}=1,3,\ldots$ are not resolved and non-symmetric effects are suppressed in the presented simulation due to the use of symmetry conditions.
Grid density functions of the grid-line distribution in the streamwise ( $x$) and the wall-normal (
 $\unicode[STIX]{x1D702}$) direction (a), and estimates of the grid spacing in wall units in the streamwise, the wall-normal and the azimuthal directions, respectively, using the laminar and turbulent skin-friction estimates (b) according to White (Reference White2006).

The streamwise, the wall-normal and the azimuthal direction are resolved with  $n_{x}=6650$,
 $n_{\unicode[STIX]{x1D702}}=350$ and
 $n_{\unicode[STIX]{x1D711}}=299$ points, respectively. The outflow ramp was applied at the last 150 points in order to avoid reflections of the disturbances from the outflow boundary. The grid density functions for the streamwise and the wall-normal directions are provided in figure 3(a). The grid-line distribution in the streamwise direction is equidistant at the beginning of the computational domain and then refined towards the outflow so that the smaller length scales associated with the nonlinear breakdown regime can be resolved. The grid points in the wall-normal direction are clustered near the wall in order to resolve the expected large wall-normal gradients of the disturbance quantities in the nonlinear regime. Inside the boundary layer an equidistant grid-line spacing of
 $\unicode[STIX]{x0394}\unicode[STIX]{x1D702}=2\times 10^{-5}~\text{m}$ was used while outside the boundary layer a polynomial stretching function was applied. The grid-line spacing at the wall was determined by using approximately one hundred points per laminar boundary layer thickness. An equidistant grid-line spacing was used in the azimuthal direction. The quality of the grid in the respective coordinate directions was evaluated a priori using an approximation of the wall units based on the theoretical laminar and turbulent skin-friction estimates for a straight cone geometry (White Reference White2006) provided in figure 3(b). At the beginning of the computational domain the wall units based on the laminar and turbulent estimate of the skin-friction coefficient are
 $4\leqslant \unicode[STIX]{x0394}x^{+}\leqslant 6$, but then drop below one for both estimates at
 $x\approx 0.35$ m (figure 3b). The rescaled grid-line spacing at the surface of the cone in the wall-normal direction is smaller than one for the entire length of the computational domain. Thus, the viscous sublayer would be well resolved in a turbulent boundary layer. Due to body divergence, the
 $\unicode[STIX]{x0394}\unicode[STIX]{x1D701}^{+}$ values, based on the turbulent estimate, continuously increase from approximately 1 at the inflow to 8 at the outflow. The resolution in all directions would even be sufficient to capture the nonlinear breakdown of the wave packet to a turbulent spot (although not considered here) because the grid resolution is even better than that used by Mayer et al. (Reference Mayer, Von Terzi and Fasel2011b) for breakdown simulations of a Mach 3 boundary layer on a flat plate all the way to turbulence.
The wave packet was initiated with a short-duration pulse through a blowing and suction hole at the wall. The forcing shape functions in the streamwise and the azimuthal direction were ‘monopoles’ of the form
 $$\begin{eqnarray}g_{\unicode[STIX]{x1D719}}=\cos \left(\frac{\unicode[STIX]{x03C0}}{2}\tilde{\unicode[STIX]{x1D719}}\right)^{3},\quad \text{with}~\tilde{\unicode[STIX]{x1D719}}=\frac{2\unicode[STIX]{x1D719}-(\unicode[STIX]{x1D719}_{e}+\unicode[STIX]{x1D719}_{s})}{(\unicode[STIX]{x1D719}_{e}-\unicode[STIX]{x1D719}_{s})},\end{eqnarray}$$
where  $\unicode[STIX]{x1D719}$ is either the streamwise direction (
 $x$) or the azimuthal direction (
 $\unicode[STIX]{x1D711}$) and the subscripts
 $s$ and
 $e$ denote the start and end location of the forcing hole. The spatial forcing functions are designed such that continuity up to the second derivative is ensured to avoid discontinuities in the derivatives of the finite-difference solver. These spatial forcing functions introduce a wide range of disturbance wavelengths – in both the
 $x$ and
 $\unicode[STIX]{x1D711}$ direction – into the computational domain. The pulse is forced in time as follows:
 $$\begin{eqnarray}g_{t}=\left\{\begin{array}{@{}ll@{}}-\sin (2\unicode[STIX]{x03C0}f_{pulse}), & \text{for}~0\leqslant t\leqslant T_{pulse},\\ 0, & \text{for}~t>T_{pulse},\end{array}\right.\end{eqnarray}$$
where  $T_{pulse}=1/f_{pulse}$ is the pulse duration (forcing interval) and
 $f_{pulse}$ is the forcing frequency. The complete pulse forcing function for generating the wave packet is then
 $$\begin{eqnarray}g(x,\unicode[STIX]{x1D711},t)=A_{0,pulse}g_{x}g_{\unicode[STIX]{x1D711}}g_{t},\end{eqnarray}$$
where  $A_{0,pulse}$ is the initial forcing amplitude of the pulse disturbance and the functions
 $g_{x}$ and
 $g_{\unicode[STIX]{x1D711}}$ are defined by (2.1).
3 Results
For the results presented in this paper the initial forcing amplitude was  $A_{0,pulse}=10^{-3}$, which was chosen based on initial test calculations (not shown here for brevity) for a smaller domain to ensure the wave packet will reach the nonlinear stages within the computational domain. For this cone geometry, at these flow conditions, disturbances with approximately
 $f=300~\text{kHz}$ resulted in the largest second-mode N-factors (Hader & Fasel Reference Hader and Fasel2019). Therefore, the pulse was centred around
 $f_{pulse}=300~\text{kHz}$ (
 $T_{pulse}=3.33~\unicode[STIX]{x03BC}\text{s}$), to guarantee that the most relevant second-mode disturbances were initialized with the pulse forcing. The location of the blowing and suction hole was approximately 100 grid points downstream of the inflow boundary to avoid possible reflections of upstream travelling disturbance waves at the inflow boundary. Note that even though the flared cone is very slender at the tip, with an initial half-angle of
 $\unicode[STIX]{x1D703}_{cone}=1.4^{\circ }$, the angle of the tangent to the surface of the cone continuously increases in the downstream direction and is approximately
 $4.7^{\circ }$ at the location of the forcing hole. This is in the same range as the slender, straight cone geometry used for the Caltech T5 transition experiments (Jewell et al. Reference Jewell, Parziale, Leyva and Shepherd2016), where unpredictable turbulent spots were generated by particulate impact on the model surface. The forcing hole was resolved with approximately 15 grid points in each direction, which then determined the hole dimensions (
 $x_{s}=0.170~\text{m}$,
 $x_{e}=0174~\text{m}$,
 $\unicode[STIX]{x1D711}_{s}=-0.08~\text{rad}$,
 $\unicode[STIX]{x1D711}_{e}=0.08~\text{rad}$). The size of the forcing hole has to be small to force a wide range of streamwise and azimuthal wavenumbers. The amplitude spectrum extracted at the forcing location shown in figure 4 confirms that disturbances with a wide range of frequencies (
 $0<f<600~\text{kHz}$) and azimuthal wavenumbers (
 $-100\leqslant k_{c}\leqslant 100$) were introduced into the computational domain. This covers the frequency range of the linearly most unstable axisymmetric second modes and the azimuthal wavenumber range which resulted in the strongest fundamental resonances that were found from a secondary instability analysis (Hader & Fasel Reference Hader and Fasel2019).
The instantaneous wall pressure signals at the centreline of the ensuing wave packet, as shown in figure 5, indicate a rapid increase of the wave packet amplitude and a significant spreading in the streamwise direction as it propagates downstream. The wave packet appears to be ‘linear’ until a clear modulation of the envelope can be observed at  $t=0.4~\text{ms}$ (figure 5), suggesting that the wave packet has become nonlinear. The maximum of the pressure disturbance at the respective time instant is marked with a square and the locations where the envelope reaches 1 % of the maximum are highlighted with circles to obtain a qualitative measure of the ‘spread’ of the wave packet in the streamwise direction.
Amplitude spectrum obtained with the short-duration pulse at the forcing location.

Pressure disturbance on the surface of the cone at the symmetry line for various time instances (▪ (green), maximum pressure disturbance; ●, 1 % of maximum pressure disturbance).

Instantaneous pressure disturbance contours in the symmetry (centre) plane (top) and on the unrolled surface (bottom) at select time instances.

To inspect the shape of the wave packet, the instantaneous pressure disturbance contours on the unrolled surface of the flared cone and in the vertical symmetry (centre) plane are presented in figure 6 for several time instances. In the symmetry plane (figure 6, top) the laminar and the transitional boundary layer thickness (obtained from the time-averaged flow field) are given for reference. The green solid lines on the unrolled surface (figure 6, bottom) are the maximum value of the envelope and the black solid lines denote the ‘footprint’ of the wave packet obtained as 1 % of the maximum envelope value, as schematically shown in figure 5. The dashed lines depict the maximum of the wave packet envelope (green) and the wave packet ‘footprint’ (black) for time instances, where the instantaneous pressure disturbance contours are not shown, in order to provide an overview of how the shape of the wave packet changes with time and location. The contour levels for each of the displayed time instances were adjusted relative to the respective maximum values. The wave packet is dominated by axisymmetric and shallow waves, indicated by the essentially two-dimensional wave fronts in the unrolled coordinate system. At  $t=0.5333~\text{ms}$, when the wave packet has reached the strongly nonlinear stages, a strong modulation of the pressure disturbance contours can be observed in figure 6. The contours in the symmetry plane show that the pressure fluctuations are contained within the boundary layer. The sudden appearance of streamwise streaks observed at
 $t=0.5333~\text{ms}$ in figure 6 (bottom) will be discussed in more detail below. The present results here exhibit some notable differences compared to the results for a nonlinear wave packet on a straight cone for the BAM6QT conditions (see Sivasubramanian & Fasel Reference Sivasubramanian and Fasel2014), which showed the development of strong, oblique waves at the side of the wave packet as it propagated downstream. In addition, no streamwise streaks were observed for a wave packet simulation for a straight cone.
The spectra extracted at various downstream distances in figure 7 indicate that the fundamental breakdown is the relevant nonlinear mechanism of the late nonlinear stages of the wave packet, illustrated by the spectral broadening in the azimuthal wavenumber for a relatively narrow frequency band. At  $x=0.32~\text{m}$, only the linearly most amplified axisymmetric second mode (
 $f=300~\text{kHz}$) is detectable. Farther downstream at
 $x=0.40~\text{m}$, nonlinearly generated higher harmonics of the linearly unstable frequency range as well as steady modes can be observed, and the spectra have substantially broadened in the azimuthal wavenumber space. Towards the end of the computational domain, at
 $x=0.48~\text{m}$, the spectra show that a wide range of frequencies and azimuthal wavenumbers have reached large amplitudes, which is an indication that the wave packet has progressed deep into the nonlinear breakdown regime. The spectrum at
 $x=0.48~\text{m}$ exhibits no noticeable interaction between the
 $f\approx 300~\text{kHz}$ modes and the corresponding subharmonic (
 $f\approx 150~\text{kHz}$) modes, suggesting that subharmonic breakdown is likely not a dominant nonlinear mechanism for the presented geometry and flow conditions. Furthermore, the spectra indicate an interaction between an axisymmetric (fundamental) mode with a frequency of
 $f\approx 300~\text{kHz}$ (mode (300, 0)) and oblique waves of the same frequency with an azimuthal wavenumber of
 $k_{c}\approx 80$ (modes
 $(300,\pm 80)$). The sudden development of a steady streamwise disturbance wave with
 $k_{c}=80$ is indicative of an interaction of the dominant axisymmetric mode with the oblique waves (
 $(300,0)-(300,\pm 80)\rightarrow (0,\pm 80)$), while the generation of a steady disturbance wave with
 $k_{c}=160$ may be due to a self-interaction (higher harmonic) of the oblique waves (
 $(300,80)-(300,-80)\rightarrow (0,160)$). These interactions are consistent with a fundamental breakdown mechanism. The fact that the oblique waves with
 $f=300~\text{kHz}$ and
 $k_{c}=80$ dominate the late nonlinear stages of the wave packet development is rather remarkable. So is the fact that this is consistent with the ‘controlled’ fundamental breakdown discussed in Hader & Fasel (Reference Hader and Fasel2019). In the wave packet simulation, no particular nonlinear mechanism was favoured a priori, and the much larger domain size used in the azimuthal direction allowed for a wide range of azimuthal wavenumbers to be ‘selected’ in the transition process.
Contours of the pressure disturbance amplitude extracted at the wall for select downstream locations.

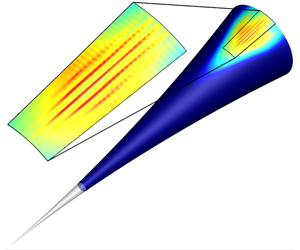
Time-averaged Stanton number contours on the surface of the cone and a corresponding close-up of the streak region (a), the Stanton number development in the downstream and azimuthal direction at a location where the streaks are present (b), the Stanton number distribution in the azimuthal direction at various downstream locations (c), and a comparison of the normalized Stanton number distribution in the azimuthal direction obtained from the wave packet, a controlled fundamental breakdown and a random forcing DNS (d).

The flow field was averaged in time as the wave packet propagated through the computational domain. The time-averaged contours of the Stanton number on the surface of the cone in figure 8(a) now clearly exhibit the streamwise streaks, with a spacing of  $\unicode[STIX]{x0394}\unicode[STIX]{x1D701}/r_{cone}(x)\approx 2\unicode[STIX]{x03C0}/80$ rad, that appear towards the downstream end of the computational domain, and which were already observed in figure 6 (bottom), albeit for the instantaneous pressure contours. The ratio of the azimuthal wavelength of a disturbance mode corresponding to
 $k_{c}=80$ and the local boundary layer thickness where the streaks are present is approximately 2.5. A close-up of the streak region (see figure 8a) and the development of the time-averaged Stanton number in the downstream direction for two different azimuthal locations are displayed in figure 8(b). For reference, the laminar and turbulent estimates for a straight cone geometry, calculated according to White (Reference White2006), are also shown in figure 8(b). At approximately
 $x=0.37~\text{m}$ the time-averaged Stanton number starts to deviate from the laminar base flow estimate and continuously rises to approach the turbulent estimate (figure 8b, bottom). As shown in figure 8(c), the time-averaged Stanton number increases in the azimuthal direction until maxima (peaks) develop. For
 $x=0.46~\text{m}$ an onset of spanwise oscillations of the Stanton number can be observed in figure 8(c) at spanwise locations where the ‘hot’ streaks were observed in figure 8(a). The amplitude of the spanwise Stanton number oscillations increases in the downstream direction while spreading in the azimuthal direction, as can be observed for
 $x=0.48~\text{m}$ in figure 8(c). Streamwise ‘hot’ streaks of high heat transfer have also been found in a DNS of ‘controlled’ fundamental breakdown (Hader & Fasel Reference Hader and Fasel2019), as well as in a DNS where the disturbances were introduced by random forcing (Hader & Fasel Reference Hader and Fasel2018). Most importantly, ‘hot’ streaks were also observed in experiments conducted in the Purdue quiet tunnel (Chynoweth Reference Chynoweth2018), where temperature sensitive paint (TSP) was used to identify the streaks. A comparison of the Stanton number (normalized using peak values) obtained from the controlled fundamental breakdown, the random forcing DNS and the wave packet, at locations where the streaks are present (see figure 8d), indicates that for all three cases the streak spacing in the azimuthal direction is approximately
 $\unicode[STIX]{x0394}\unicode[STIX]{x1D701}/r_{cone}(x)\approx 2\unicode[STIX]{x03C0}/80$ rad. This spacing relates to approximately 80 streaks appearing around the entire circumference of the cone. Indeed, the streak count agrees reasonably well with the 78 streaks (2.5 % difference) that were observed in the experiments (Chynoweth et al. Reference Chynoweth, Schneider, Hader, Fasel, Batista, Kuehl, Juliano and Wheaton2019).
A visualization using the magnitude of the density gradient (pseudo-schlieren) is useful for qualitative comparison to schlieren images obtained in experiments (see, for example, Casper et al. (Reference Casper, Beresh, Henfling, Spillers and Pruett2013)). The pseudo-schlieren contours in the symmetry plane for two different time instances in figure 9 exhibit rope-like structures, which can be indicative of large-amplitude second-mode waves in transitional boundary layers. These structures propagate downstream and begin to break down to smaller scales towards the end of the computational domain at  $t=0.5333~\text{ms}$. The downstream development of the pressure disturbance amplitude at the wall for a wide range of disturbance modes is provided in figure 10. The axisymmetric modes (
 $k_{c}=0$) are highlighted to confirm that the wave packet is dominated by two-dimensional (second mode) disturbances for a large downstream extent. In addition, select modes with the dominant second-mode frequency (
 $f=300~\text{kHz}$), both axisymmetric and oblique, are highlighted as well. Note the steady streamwise mode with the azimuthal wavenumber
 $k_{c}=80$ that was found to be the dominant mode responsible for the streak generation in a DNS of ‘controlled’ fundamental breakdown, and a DNS of nonlinear breakdown that was initiated by broadband random forcing. Axisymmetric and shallow (small
 $k_{c}$) waves dominate for a large downstream extent of the computational domain. This is consistent with the observations made from the pressure disturbance contours in figure 6. Towards the end of the computational domain around
 $x\approx 0.4~\text{m}$ oblique disturbance waves with larger azimuthal wavenumbers are growing significantly, which leads to a modulation of the wave packet in the azimuthal direction and thus distorts the axisymmetric wave fronts.
Magnitude of the density gradient (pseudo-schlieren) in the symmetry plane for two different time instances.

Downstream development of the pressure disturbance amplitude at the wall, with select modes dominating the wave packet breakdown highlighted (—— (cyan), axisymmetric modes).

To identify the vortical structures of the flow field that dominate the nonlinear processes, the instantaneous  $Q$-isosurfaces, coloured with the instantaneous streamwise vorticity, are presented in figure 11. A clear onset of the nonlinear breakdown, indicated by the appearance of smaller scales, can be observed. The streamwise vorticity contours reveal counter-rotating structures in the ‘core’ of the wave packet, which is consistent with the findings for the ‘controlled’ fundamental breakdown (Hader & Fasel Reference Hader and Fasel2019), where the streaks were directly linked to the counter-rotating steady streamwise vortices. The generation of smaller scales and the close-up of the vortical structures in the top–down view and the symmetry plane (figures 11b and 11c) confirm that the wave packet has reached the late nonlinear stages of the laminar–turbulent transition process.
 $Q$-isocontours (
 $Q=5000$) coloured with the instantaneous streamwise vorticity contours at
 $t=0.5333~\text{ms}$: (a) isometric view, (b) top–down view, and (c) the
 $Q$ contours in the symmetry plane.

4 Conclusions
Highly resolved DNS were carried out to investigate the nonlinear development and breakdown of a wave packet that was initiated by a short-duration pulse disturbance. The contours of the time-averaged Stanton number on the surface of the cone revealed that in the strongly nonlinear transition stages, ‘hot’ streamwise streaks appear. Such streaks have also been observed in wind tunnel ‘natural’ transition experiments at Purdue University (for example, Chynoweth et al. Reference Chynoweth, Schneider, Hader, Fasel, Batista, Kuehl, Juliano and Wheaton2019) using TSP, and in DNS of ‘controlled’ fundamental breakdown (Hader & Fasel Reference Hader and Fasel2019), as well as in DNS where transition was initiated by random (broadband) forcing (Hader & Fasel Reference Hader and Fasel2018). The (spanwise) streak spacing obtained from the wave packet simulation is very close to that found in the ‘controlled’ (fundamental) breakdown DNS and the random forcing DNS, and is in reasonable quantitative agreement (2.5 % difference) with the experimental measurements. Thus, the results in the present paper provide further evidence that fundamental resonance is indeed the relevant nonlinear breakdown mechanism for the BAM6QT flared cone experiments.
Acknowledgements
This work was supported by AFOSR grant FA9550-15-1-0265, with Dr I. Leyva serving as the programme manager. Computer time was provided by the DoD HPCMP. The views and conclusions contained herein are those of the authors and should not be interpreted as necessarily representing the official policies or endorsements, either expressed or implied, of the Air Force Office of Scientific Research or the U.S. Government.
Declaration of interests
The authors report no conflict of interest.
Supplementary movie
Supplementary movie is available at https://doi.org/10.1017/jfm.2019.1011.



