Introduction
Antipsychotics were discovered nearly half a century ago and remain the mainstay in the treatment of psychosis. Numerous controlled clinical trials leave little doubt regarding their efficacy; however, the time course of their effects and the reasons why some patients respond and others do not, remain unclear (Agid et al. Reference Agid, Kapur, Arenovich and Zipursky2003; Kapur et al. Reference Kapur, Arenovich, Agid, Zipursky, Lindborg and Jones2005; Leucht et al. Reference Leucht, Busch, Hamann, Kissling and Kane2005; Kinon et al. Reference Kinon, Chen, Ascher-Svanum, Stauffer, Kollack-Walker, Sniadecki and Kane2008). A major shortcoming of most of the currently published clinical trials is that they treat the entire group of patients (receiving drug or placebo) as a collective and ignore the large inter-individual differences within the group. In this paper, we illustrate the magnitude of inter-individual variability of response in a standard clinical trial and then use growth mixture modelling (GMM) to identify the optimal number of distinct response trajectories. We also focus on identifying the trajectories that differentiate antipsychotic-treated patients from placebo-treated patients.
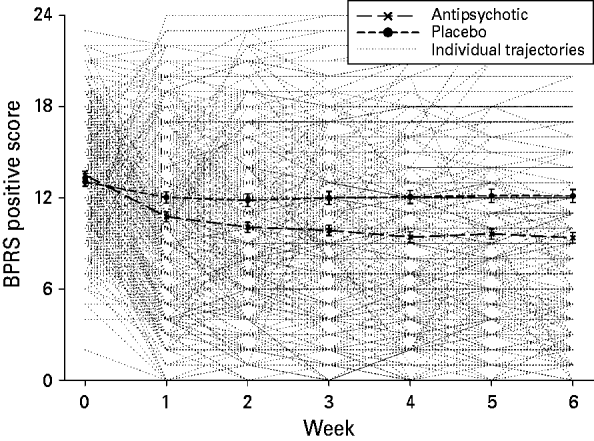
It is customary to present the results of large trials in aggregate. However, as Fig. 1 demonstrates, these simple and smooth group curves obscure the very complex reality of the individual response profiles that contribute to the mean data. In addition, the results are often dichotomized using a fixed level of improvement at endpoint (e.g. 30% improvement), with the implicit assumption that this provides a natural divide in the degree of response. As Fig. 1 shows, there is no such natural point of division that can form the basis of declaring a responder/non-responder boundary. Furthermore, the depiction of data as a ‘drug’ curve and a ‘placebo’ curve gives the impression that the two modalities lead to qualitatively distinct trajectories of response, a clear ‘placebo’ trajectory and a clear ‘drug’ trajectory, which separate quickly and then continue to maintain that difference over time. The inspection of individual data for patients on drug versus placebo shows that there are no such simple distinctions. Although this group approach may be sufficient for drug-approval studies evaluating whether the drug is, on average, more effective than placebo, it does not provide any insight into the complexity of the antipsychotic response within groups and across individuals.
The individual and group response in patients treated with placebo and antipsychotics, with last observation carried forward.

In the 1980s Quitkin and co-workers (Quitkin et al. Reference Quitkin, Rabkin, Ross and Stewart1984; Stewart et al. Reference Stewart, Quitkin, McGrath, Amsterdam, Fava, Fawcett, Reimherr, Rosenbaum, Beasley and Roback1998) identified this as an issue in depression trials and suggested the use of a ‘pattern analysis’ to categorize individual response trajectories (Rothschild & Quitkin, Reference Rothschild and Quitkin1992). More recently, Stassen et al. (Reference Stassen, Delini-Stula and Angst1993, Reference Stassen, Angst, Hell, Scharfetter and Szegedi2007) have used ‘survival analytic models’ and ‘cure models’ to examine trajectories of antidepressant versus placebo response in depression trials. To our knowledge, this issue has not been studied systematically in schizophrenia; however, two recent developments make it possible and important to examine response patterns in schizophrenia. First, it has now been shown that antipsychotic response starts quickly (within 2 weeks) and predicts long-term (6- to 12-week) outcomes, thus making it possible to look at early patterns and trajectories (Agid et al. Reference Agid, Kapur, Arenovich and Zipursky2003; Kapur et al. Reference Kapur, Arenovich, Agid, Zipursky, Lindborg and Jones2005; Leucht et al. Reference Leucht, Busch, Hamann, Kissling and Kane2005; Kinon et al. Reference Kinon, Chen, Ascher-Svanum, Stauffer, Kollack-Walker, Sniadecki and Kane2008). Second, advances in statistical models allow distinct trajectories of change over time to be identified (Muthén & Shedden, Reference Muthén and Shedden1999; Muthén et al. Reference Muthén, Brown, Masyn, Jo, Khoo, Yang, Wang, Kellam, Carlin and Liao2002) without committing to a priori definitions (e.g. 30% improvement) of responder/non-responder. Levine & Rabinowitz (Reference Levine and Rabinowitz2008) recently used a latent class analysis approach to identify such trajectories in antipsychotic-treated patients and observed four parallel trajectories with modest response (19–43% improvement), with one distinctive trajectory that starts off more symptomatic than average but shows a dramatic 59% improvement in 4 weeks on antipsychotics. Although Levine & Rabinowitz (Reference Levine and Rabinowitz2008) did not analyse placebo-treated patients and therefore antipsychotic cannot be dissociated from placebo response in their analysis, they do show the viability of such approaches in the study of antipsychotic response.
In terms of using these data-driven approaches to differentiate drug-response trajectories from placebo-response trajectories, Muthén & Brown (Reference Muthén and Brown2009) have recently shown how GMM, another data-driven approach that models heterogeneity in longitudinal data, can be applied to differentiate drug response from placebo response in the case of depression. The advantage of GMM and other such approaches, in contrast to the earlier work by Quitkin et al. (Reference Quitkin, Rabkin, Ross and Stewart1984) and Stassen et al. (Reference Stassen, Delini-Stula and Angst1993), is that subpopulations and thresholds do not need to be defined or identified a priori or arbitrarily (Muthén et al. Reference Muthén, Brown, Masyn, Jo, Khoo, Yang, Wang, Kellam, Carlin and Liao2002; Levine & Rabinowitz, Reference Levine and Rabinowitz2008; Muthén & Brown, Reference Muthén and Brown2009). GMM provides a formal framework to identify these trajectories and to determine the optimal number of trajectories to best describe a given data set (Muthén et al. Reference Muthén, Brown, Masyn, Jo, Khoo, Yang, Wang, Kellam, Carlin and Liao2002; Levine & Rabinowitz, Reference Levine and Rabinowitz2008; Muthén & Brown, Reference Muthén and Brown2009).
We undertook this study with three major objectives: (1) to identify the number of distinct trajectories that optimally define antipsychotic response in large double-blind placebo-controlled clinical trials; (2) to determine whether there are any trajectories that are unique to either drug-treated or placebo-treated subjects; and (3) to examine whether the trajectories of response for the different dimensions (positive symptoms, negative symptoms, and total scores) were identical or different.
Method
Data for this study were obtained from two previously published clinical trials (Beasley et al. Reference Beasley, Sanger, Satterlee, Tollefson, Tran and Hamilton1996a, Reference Beasley, Tollefson, Tran, Satterlee, Sanger and Hamiltonb) undertaken to assess the efficacy of olanzapine versus placebo. A total of 420 patients were enrolled in the two studies, were aged between 18 and 65 years, met the DSM-III-R criteria for schizophrenia, and were required to have a minimum Brief Psychiatric Rating Scale (BPRS; Overall & Gorham, Reference Overall and Gorham1962) total score of ⩾24. In both studies, the patients first entered a single-blind placebo lead-in phase of 4–7 days and those who showed a >25% improvement in BPRS score or whose BPRS total score decreased to <24 during the placebo lead-in phase were discontinued from the study. Once randomized, patients were then followed for 6 weeks with weekly ratings.
Patients were assigned randomly to one of five double-blind treatment groups [olanzapine: low dose (2.5, 5 or 7.5 mg/day), medium dose (7.5, 10 or 12.5 mg/day) or high dose (12.5, 15 or 17.5 mg/day), haloperidol (10, 15 or 20 mg/day), or placebo (Beasley et al. 1996 b)] or to one of three double-blind treatment groups (olanzapine 1 or 10 mg/day or placebo) (Beasley et al. 1996 a). For this study we included all randomized patients who had BPRS values available; we combined patients on low-dose olanzapine (1 mg/day, n=52) and placebo (n=117) into the placebo group (PBO group, n=169) and patients treated with haloperidol (10–20 mg/day, n=69) or medium- to high-dose olanzapine (7.5–17.5 mg/day, n=182) into the antipsychotic group as these doses of olanzapine and haloperidol are now known to be therapeutically effective (AP group, n=251).
For the purposes of this analysis we focused on clinical response as measured using the BPRS. As GMM is a technique that finds homogeneous trajectories among varying individual responses, it is very important that the outcome measure (i.e. the clinical scale in which the change is being measured) represents a single factor. Composite scales such as the BPRS and the Positive and Negative Symptom Scale (PANSS) cover many dimensions (3–5 depending upon the kind of factor analyses). Therefore, we first applied trajectory analysis to the BPRS positive subscale and examined the effect of drug and placebo on it, and then applied the same approach to the BPRS negative and total scores.
GMM
As described in Muthén et al. (in press), GMM is a generalization of conventional repeated-measures random-effects modelling using the mixed linear model. It can be seen as a combination of conventional repeated-measures modelling and cluster analysis allowing prediction of latent trajectories and individual membership within those. GMM was implemented in Mplus (Muthén & Muthén, Reference Muthén and Muthén2007), wherein one to five trajectory solutions were applied sequentially and the fit parameters and statistics obtained. Type of treatment (i.e. antipsychotic versus placebo) was included as a covariate in all of these solutions. The following different options were tested: linear versus quadratic growth and correlated versus independent adjacent residuals. The combination of options yielding the best statistical fit was used in the final growth models. The ‘best’ solution was based on a combination of objective statistical performance as assessed based on a bootstrap likelihood ratio test (BLRT) and Bayesian Information Criteria (BIC) with the further constraint that the trajectories each include at least 5% of the subjects. We also examined the individual patient trajectories within each of the classes to assess the extent to which the overall trajectory solution accurately described the behaviour of the individual patients in the study. The stability of our final solutions was tested through a Monte Carlo simulation to ensure that our findings could be replicated.
Growth model analysis of the BPRS positive score
To identify the different trajectories of response in the BPRS positive score, data were fit to a sequential series of growth models reflecting one to five different trajectories. These models allow a variety of straight and curved trajectories with up to two sharp breaking points to capture different rates of improvement at different stages of treatment. The best model was selected on the basis that it provided a good description of the data with relatively few parameters and classified individuals into trajectories with each of them including a significant number of subjects.
In our data, treatment status was included as a covariate, these solutions allowing us to determine objectively whether the probability of experiencing each unique type of response was influenced by treatment status. We found that the better fits were obtained (as measured by BIC values), and the individual patient trajectories tracked the estimated class means most closely, if we assumed quadratic (rather than linear) growth and if we assumed that the adjacent measurements had correlated (rather than uncorrelated) residuals. We refined this approach further by setting to zero the growth parameters not significantly different from zero (in this case, the variance associated with the slope and quadratic terms).
The performance of the different models is shown in Table 1, and according to our decision criteria the four-trajectory model outperformed the others as both the BIC and BLRT converged on this solution, the class sizes were of reasonable magnitude for interpretation, and the solution demonstrated a reasonable level of tracking with individual patient trajectories. Monte Carlo simulations found this solution to be fairly stable and replicable, with a minimum coverage value (across all estimated parameters) of 91.9% in 1000 replications. Thus, a four-trajectory model rather than a simple responder/non-responder dichotomy (which is an arbitrary version of a two-trajectory model) provides a much better solution for the observed data.
The fit statistics for the five different sequential models explored, that is for BPRS positive scores on growth mixture models

BPRS, Brief Psychiatric Rating Scale; BIC, Bayesian Information Criteria; BLRT, bootstrap likelihood ratio test; n.a., not applicable.
a The p value refers to the testing of the k class model versus the k – 1 class model.
Results
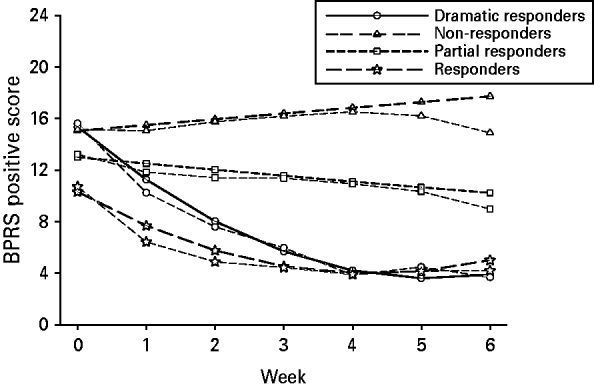
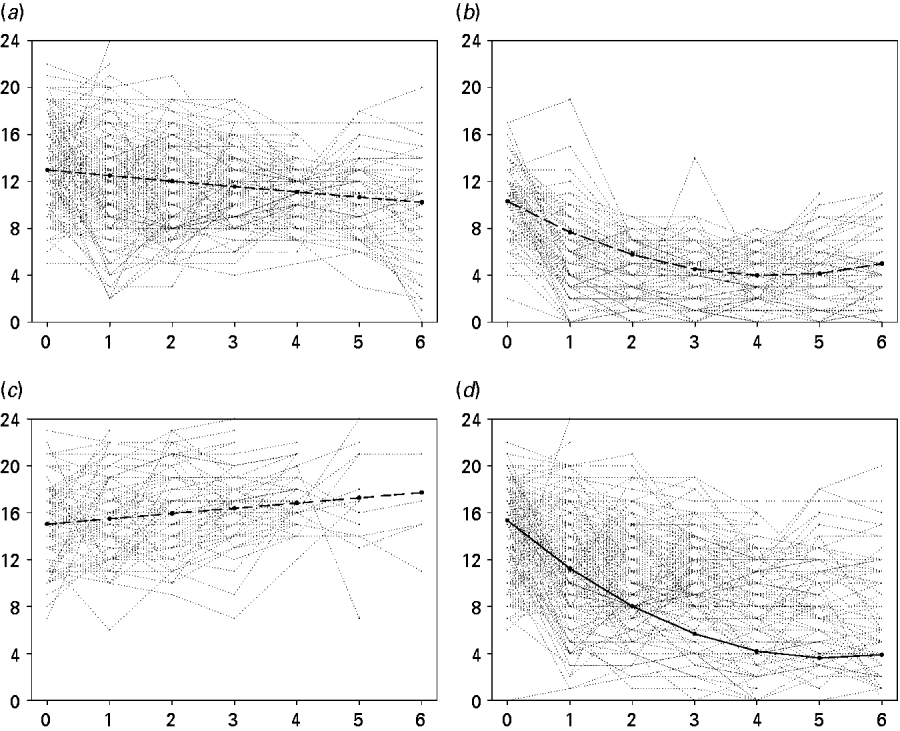
Fig. 2 shows the four trajectories for the entire cohort. The largest class of patients (203/420; 48%) start off with average [±standard deviation (s.d.)] scores of about 13.0±2.3 and show a decrease of about 3 points over the entire duration of the study. As these patients showed only about a 20% change during the entire study, we chose to call this trajectory ‘Partial responders’. The second largest class of patients (91/420; 22%) enter the study with average scores of 10.3±2.3 and show a robust response (decrease of about 5 points, 50%) through the course of the study; as this degree of response easily exceeds the threshold of clinical relevance, we named this trajectory ‘Responders’. The third category is a set of patients (83/420; 19.8%) who are more ill than the previous two at entry, enter with scores of 15.0±2.3, and show little change during the course of the 6 weeks; we named this trajectory ‘Non-responders’. Finally, there is a small group of patients (43/420; 10.2% of overall group) who start off with high levels of illness (15.4±2.3) and show a dramatic decrease in symptoms over the course of the study (an improvement of about 11 points, 74%), such that by the 6-week mark they are as well as the other responders, even though they started with a significantly higher symptom load. We have labelled this trajectory ‘Dramatic responders’. Fig. 3 shows the individual response curves that underlie each of these trajectories.
The observed (bold dashed line) and estimated (additional dashed line) response for the four trajectories embedded in the data.

The individual response curves of the patients assigned to the four trajectories: (a) Partial responders, (b) Responders, (c) Non-responders and (d) Dramatic responders.

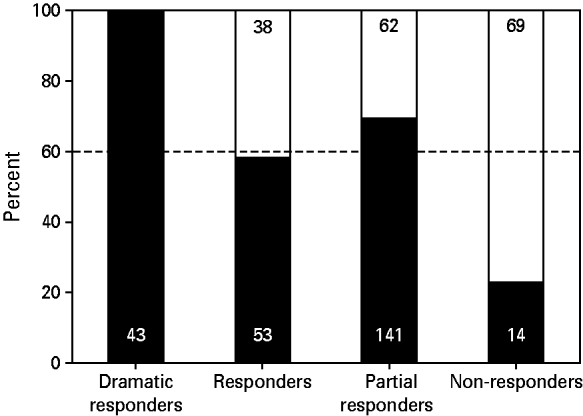
Fig. 4 shows the proportion of drug-treated versus placebo-treated patients in each of the trajectories. Given the number of antipsychotic (251) versus placebo (169) patients, under the null hypothesis each trajectory would have been expected to consist of 40% placebo patients and 60% drug patients; however, this hypothesis was rejected. Odds ratios (ORs) associated with the covariate effect of drug confirmed the impression that there was a differential contribution of drug versus placebo to the different trajectories. ‘Responders’ and ‘Partial responders’ were significantly more likely to have been drug treated than ‘Non-responders’ [OR 4.22, 95% confidence interval (CI) 1.64–10.80, p=0.003 and OR 5.55, 95% CI 0.07–0.48, p=0.001 respectively]. However, the ‘Responders’ were just as likely to have been drug treated as ‘Partial responders’ (OR 0.78, 95% CI 0.32–1.89, p=0.580). ORs associated with the ‘Dramatic responder’ group could not be calculated because of the complete absence of placebo-treated subjects in this group, suggesting that, at least in this sample, the ‘Dramatic responder’ course is unique to and only observed in drug-treated patients.
The proportion of patients in each trajectory by antipsychotic (▪) versus placebo (□). The broken line represents the null hypothesis level based on their relative proportion (60:40) in the overall randomized set.

Although the BPRS is not a sensitive instrument to examine negative symptoms, we were curious to examine whether similar or different trajectories were identified with negative symptoms; however, we were unable to find robust or interpretable convergence and different statistical indices favoured different models. Given that the solutions were neither statistically robust nor insightful, this was not pursued further. As the BPRS total score is a mixture of several distinct factors, we were aware that it would be difficult to find simple differentiable trajectories to describe the entire scale. Not surprisingly, the same approach applied to the BPRS total score showed no clear convergence.
Discussion
Although it is customary to present data for groups of patients treated with ‘drug’ or with ‘placebo’, the underlying reality of response shows remarkable inter-individual variation. Trajectory analysis using GMM suggests that there are differentiable pathways of response, with the ‘Dramatic responder’ trajectory observed only in the antipsychotic-treated group in this data set. We now discuss the potential implications of these results for theory and practice and also outline the caveats and limitations of our dataset and its analysis.
With the exception of a few efforts in depression (Quitkin et al. Reference Quitkin, Rabkin, Ross and Stewart1984; Stewart et al. Reference Stewart, Quitkin, McGrath, Amsterdam, Fava, Fawcett, Reimherr, Rosenbaum, Beasley and Roback1998) and schizophrenia (Garver et al. Reference Garver, Holcomb and Christensen2000), the mainstream analysis of clinical trials has always focused on groups as a whole, usually drug versus placebo, with the underlying assumption of a continuously distributed response within a group and a clear distinction across the groups. The analyses here robustly show that there are several intrinsic trajectories within a cohort of antipsychotic-treated patients and that there is substantial overlap of trajectories between the drug-treated and placebo-treated subjects. Based on these data, the single largest class is a group of patients (nearly half) who show about 20% improvement in their positive symptoms across the course of a 6-week trial, a degree of improvement that is only marginally discernable at a global clinical level (Leucht et al. Reference Leucht, Kane, Etschel, Kissling, Hamann and Engel2006). Another major segment (nearly 20%) comprises subjects who show a fairly good response, nearly 50% decrease in symptoms by the end of 6 weeks, a level of effect that the clinicians find to be clinically significant (‘much improved’) (Leucht et al. Reference Leucht, Kane, Etschel, Kissling, Hamann and Engel2006). Together, these ‘Partial responders’ and ‘Responders’ form the majority (70%) of patients within the trial; however, in this category the drug and the placebo do not differentiate themselves robustly.
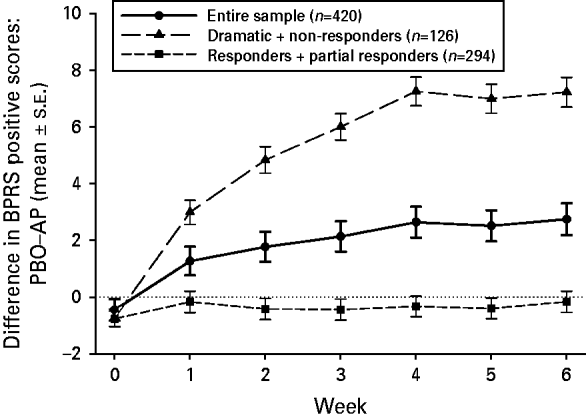
The most notable differentiation between drug and placebo is observed in the ‘Dramatic responders’. This 10% of the overall group is seen only among the drug-treated group (i.e. 43/251 or 17% of the drug-treated group). This group starts off with a slightly greater level of symptomatology but shows a dramatic and striking response (~70% improvement in 6 weeks), a level of improvement that would be labelled as ‘very much improved’ on the basis of clinical global impression (Leucht et al. Reference Leucht, Kane, Etschel, Kissling, Hamann and Engel2006). With the exception of the ‘Dramatic responder’ trajectory, there is no other trajectory that is unique to either drug or placebo, and being on either drug or placebo did not further distinguish the response within the trajectory. This implies that the real difference between drug and placebo when analysed as groups is driven by the dramatically different effects of the drug versus placebo in 30% of the patients who follow the ‘Non-responder’ and ‘Dramatic responder’ trajectories, with 70% of the patients contributing relatively little to the eventual drug–placebo differentiation. Fig. 5, which shows the drug–placebo differences in the entire group and in the two different groups of trajectories, clearly illustrates this point.
The differences between antipsychotic-treated (AP) and placebo-treated (PBO) patients in the entire sample and in informative and non-informative trajectories.

Although we are not aware of any other study that has attempted a similar dissection, Levine & Rabinowitz (Reference Levine and Rabinowitz2008) reported the results from 497 first-episode patients randomized to risperidone versus haloperidol. Although the patients in their study were ‘first-episode’ (a group generally more responsive), there was no placebo control and the data were not analysed by subscale, the general trend of their findings is similar to ours. They found that the most common trajectory seen in the majority (65%) of the population was a modest 19–21% response, very similar to our finding of ‘Partial responders’. The most distinctive trajectory in their study was a small group (about 20% of the drug-treated patients) who showed a striking response (59% in 4 weeks), very similar to our ‘Dramatic responders’ (17% of the drug-treated group who showed 74% improvement over 6 weeks). Our data and those of Levine & Rabinowitz need to be replicated in larger datasets and across different drugs to determine whether these findings are universal and generalizable, but nevertheless the consistency of these findings is encouraging.
We suggest that these findings may have important implications for how the antipsychotic response is considered. First, data from clinical trials are always presented as group means, leaving the general impression that placebo-treated patients improve a little (e.g. on average 20%) whereas drug-treated patients improve more (on average 30%). Our analysis shows that both drug and placebo produce a range of responses. Second, the ‘Dramatic responders’, the 10% of the overall group (and 17% of the drug-treated group) who start off with a slightly higher level of sickness than the rest of the patient classes and end up with nearly 74% improvement are exclusively from the drug-treated cohort. If this is a consistently replicated and observed patient class, then this could identify a particularly responsive subset that may have a unique genetic profile or biology of their illness. Third, at present there are few predictors of ‘response’ to antipsychotics. Most doctors usually initiate treatment in patients and usually advise the apocryphal ‘rule of thirds’ (i.e. one-third get better a lot, one-third partially so, and the other one-third not much). The empirical data do not suggest this simple trichotomy. If our results can be replicated in larger datasets, we can provide patients with much more definitive expectations of outcome (Kinon et al. Reference Kinon, Chen, Ascher-Svanum, Stauffer, Kollack-Walker, Sniadecki and Kane2008). Finally, there are several efforts under way to ‘stratify’ patients into more homogeneous groups in terms of outcome. These attempts often use genetic, genomic and imaging data to predict outcomes as defined by simple dichotomous thresholds (e.g. 30% improvement at 6 weeks identifies responders). Such end-point thresholds, though convenient, are artificial and may even be misleading in terms of underlying biology. For instance, in the above example a patient showing a 29% improvement (who would be classified as a ‘Non-responders’) and one showing a 30% response (who would be classified as a ‘Responder’) would be classified into distinct classes even though they are very similar in terms of trajectory. Furthermore, the patient showing a 29% response would be classified with all other ‘Non-responders’, for example someone showing only a 5% response who displays a totally distinct trajectory. Therefore, we hypothesize that efforts to link baseline genetic, genomic and imaging variables to outcome are much more likely to be successful if they are related to natural trajectories inherent in the data rather than artificial (albeit clinically useful) end-point threshold-based cut-offs.
The identification of different trajectories of antipsychotic response may have implications for antipsychotic clinical trial design and drug development. First, the existence of different and heterogeneous subgroups of responders may be the responsible for the low average efficacy of antipsychotics, and if a reliable predictor or biomarker of these different response patterns could be found, it would allow for stratification of the to-be-treated population. Second, the identification of the underlying mechanism for a dramatic response would be helpful in the development of new antipsychotics. The recognition of different temporal patterns of change during antipsychotic treatment could shed some light on when and how antipsychotics operate. Finally, several prior trials have used an arbitrary cut-off (say 30% improvement in PANSS by week 6) as a categorical outcome indicator; the examination of the trajectories may require that this approach be rethought.
Limitations
In the strictest sense, these trajectories may only be applicable to placebo-controlled double-blind settings. The placebo-controlled trials are selective in many ways; first, they include a much more restricted set of patients than observed in the clinic, and second, the setting of randomization and blindness introduces an element of artificiality. Furthermore, the trajectories highlighted in this analysis are the optimal description of what happens over 6 weeks; if we had data on longer time scales or if the design allowed for switching to other medications (as often happens in clinical practice), the trajectories may well look different. Third, although we find an overall four-class solution for these data, there is no ‘absolute’ optimal number of classes. With larger sample sizes, it is likely that other classes may emerge, or that the currently large trajectories may split into further sub-trajectories. Therefore, in any dataset the total number of classes will be a function of statistical optimization and heuristic interpretability, and in this case both converged into four trajectories. Finally, although we note that ‘Dramatic responders’ were observed only in the drug-treated patients, this observation needs to be replicated in larger trials with different drugs before it receives further consideration from a clinical point of view.
Another potential limitation concerns the different placebo response trajectories observed. In schizophrenia, placebo response rate is approximately 20–40%, with variation across trials. Different factors may account for the placebo effect, such as trial duration, the stabilizing effect of contact with services or the simple regression to the mean after a symptomatic inflation for enrolment in the studies. Although it is impossible to know if we are observing a true placebo effect (related to the pill) or an effect related to the other non-specific effects of the therapeutic environment, the same methodology (GMM) was used recently in a very large dataset and showed different placebo trajectories in an antipsychotic RCT (Agid et al. Reference Agid, Potkin, Remington, Kapur, Watsky, Vanderburg and Siu2010), giving confidence that we are in fact in the presence of true placebo response trajectories.
We also must acknowledge the fact that, in chronic schizophrenia, clinical trials patients are often enrolled in different stages of their response to medication and present different baseline symptom severity. Thus, we could argue that the observed trajectory is mainly a function of where they are symptomatically prior to the initiation antipsychotic rather than a different inherent individual response pattern. In this sense the ‘Responders’ curve and the ‘Dramatic responders’ curve are just different time points of a more universal antipsychotic response curve. Although we cannot refute this hypothesis without access to pretreatment data, the fact that ‘Responders’ and ‘Dramatic responders’ trajectories were also observed in first-episode studies without prior antipsychotic exposure (Levine & Rabinowitz, Reference Levine and Rabinowitz2008), and the fact that the two groups entered the trial with similar symptom starting values, strengthens the case that the trajectories represent different pathways of antipsychotic response, rather than just different periods of ascertainment.
GMM is a new statistical methodology that only recently has been used in psychiatric. Although some previously mentioned papers have been published using GMM in antipsychotic medication, this is the first study to present data in antipsychotic placebo-controlled trials. The application of GMM to other large datasets of placebo-controlled trials will be needed to support the current findings. The replication of these data in different samples and with different antipsychotic medications will establish which aspects of the presents results are replicable and represent true underlying response trajectories.
In summary, we show that the simple drug/placebo or responder/non-responder model for classifying short-term response in schizophrenia provides an incomplete description of the remarkable inter-individual variation in response. The data in this study suggest four distinct trajectories of antipsychotic response, with considerable overlap in placebo and drug treatment across three of them, whereas the trajectory of ‘Dramatic responders’ was seen only in drug-treated patients. We think these approaches can be more widely applied to response datasets, should be contrasted to the standard responder/non-responder approaches, and are likely to lead to a more natural understanding of response and more biologically meaningful subgroups.
Acknowledgements
We thank Drs R. Uher and S. Natesan, Institute of Psychiatry, King's College London, for their thoughtful comments and Dr V. Stauffer, Eli Lilly, for her help with this manuscript.
Declaration of Interest
S.K. has received grant support or has been a consultant/scientific advisor or had speaking engagements with AstraZeneca, Bristol–Myers Squibb, Eli Lilly, EMD Darmstadt, Glaxo Smith Kline, Janssen (Johnson & Johnson), Neuromolecular Inc., Pfizer, Otsuka, Organon, Sanofi-Synthelabo, Servier, Solvay Wyeth. L.C.C. and B.J.K. are employees of Eli Lilly.