





1. Introduction
Surface waves have a notable influence on turbulence in water, affecting turbulence mixing and transport within the ocean surface boundary layer (Sullivan & McWilliams Reference Sullivan and McWilliams2010; D'Asaro Reference D'Asaro2014). Turbulence undergoes oscillating stretching and tilting straining imposed by wave orbital motions, which cause fluctuations in both the strength and tilting angles of turbulence vortices correlated with the wave phase (Guo & Shen Reference Guo and Shen2013; Fujiwara, Yoshikawa & Matsumura Reference Fujiwara, Yoshikawa and Matsumura2018; Xuan, Deng & Shen Reference Xuan, Deng and Shen2019; Smeltzer et al. Reference Smeltzer, Rømcke, Hearst and Ellingsen2023; Tsai & Lu Reference Tsai and Lu2023). The Reynolds stresses also exhibit wave-phase-correlated variations, as illustrated in theoretical (Teixeira & Belcher Reference Teixeira and Belcher2002), experimental (Jiang & Street Reference Jiang and Street1991; Rashidi, Hetsroni & Banerjee Reference Rashidi, Hetsroni and Banerjee1992; Thais & Magnaudet Reference Thais and Magnaudet1996; Veron, Melville & Lenain Reference Veron, Melville and Lenain2009; Gemmrich Reference Gemmrich2010) and numerical (Guo & Shen Reference Guo and Shen2014; Xuan, Deng & Shen Reference Xuan, Deng and Shen2020; Xuan & Shen Reference Xuan and Shen2022) studies. For example, turbulence bidirectionally exchanges kinetic energy with waves due to phase-varying wave orbital straining (Xuan et al. Reference Xuan, Deng and Shen2020). In addition to the periodic modulation effect occurring within a wave period, waves also exert an accumulative effect on turbulence. Streamwise vortices are cumulatively intensified by surface waves (Guo & Shen Reference Guo and Shen2013; Xuan et al. Reference Xuan, Deng and Shen2019; Smeltzer et al. Reference Smeltzer, Rømcke, Hearst and Ellingsen2023), which leads to the predominance of elongated quasi-streamwise vortices in Langmuir turbulence. Although the energy exchange between a wave and turbulence is bidirectional within a wave period, there exists a net energy flux from the wave to turbulence (Thais & Magnaudet Reference Thais and Magnaudet1996; Guo & Shen Reference Guo and Shen2014; Xuan et al. Reference Xuan, Deng and Shen2020), i.e. the wave can enhance turbulence. Furthermore, turbulence under the influence of water waves features distinctive coherent structures such as Langmuir circulations (Leibovich Reference Leibovich1983; McWilliams, Sullivan & Moeng Reference McWilliams, Sullivan and Moeng1997; Thorpe Reference Thorpe2004).
The wave effects on turbulence, particularly for non-breaking waves, have been conventionally modelled using the wave-phase-averaged approach in the literature. In this approach, the turbulence is assumed to evolve over a slow time scale compared with the wave period. By employing a multiscale asymptotic analysis, the Craik–Leibovich (CL) equations can be derived to describe the averaged turbulence motions without considering the wave-phase-correlated fluctuations (Craik & Leibovich Reference Craik and Leibovich1976; Andrews & Mcintyre Reference Andrews and Mcintyre1978; Leibovich Reference Leibovich1980; Holm Reference Holm1996). In the CL formulation, the averaged effect of the waves is represented by a vortex force term, defined as the cross-product of the vorticity  $\boldsymbol {\omega }$ and the wave Stokes drift velocity
 $\boldsymbol {u}_s$, where the Stokes drift is a wave property quantifying the cumulative mass transport by the wave (Longuet-Higgins Reference Longuet-Higgins1953). This modelling approach has been extensively applied in studies of ocean turbulence, notably in the context of Langmuir circulations and associated turbulence processes.
In a realistic ocean environment, water waves are inherently transient. These waves can be viewed as the superposition of numerous wave components. Although wave spectra generally evolve over a long time scale, the instantaneous wave orbital velocities of superimposed wave components with different frequencies and amplitudes undergo rapid variations. Travelling wave groups, which are a series of spatially and temporally coherent waves bounded by an amplitude envelope, can emerge from random surface waves (Tucker, Challenor & Carter Reference Tucker, Challenor and Carter1984; Viotti et al. Reference Viotti, Dutykh, Dudley and Dias2013; Onorato et al. Reference Onorato, Cavaleri, Randoux, Suret, Ruiz, de Alfonso and Benetazzo2021; Waseda et al. Reference Waseda, Watanabe, Fujimoto, Nose, Kodaira and Chabchoub2021). These wave groups are expected to exert a transient effect on the underlying turbulence. In contrast to a monochromatic wave train for which the surface elevation varies periodically, the wave group introduces variability in amplitude over multiple wave periods. Consequently, the strength of the orbital straining imposed on turbulence also varies as the wave group passes. The Stokes drift also varies with the wave group (Smith Reference Smith2006; Webb & Fox-Kemper Reference Webb and Fox-Kemper2015). For example, for a Gaussian wave packet, the Stokes drift velocity reaches its peak at the centre of the packet and attenuates towards the edges of the packet (van den Bremer & Taylor Reference van den Bremer and Taylor2016; van den Bremer et al. Reference van den Bremer, Whittaker, Calvert, Raby and Taylor2019). Therefore, it is expected that the response of turbulence to a wave group would also exhibit variability over the time scales of the wave group.
Regarding the transient evolution of turbulence under waves, Teixeira & Belcher (Reference Teixeira and Belcher2002) studied the distortion of initially isotropic turbulence under a progressive wave train. It is found that the vertical and spanwise fluctuations increase over several wave periods, while the streamwise fluctuations decrease. Smeltzer et al. (Reference Smeltzer, Rømcke, Hearst and Ellingsen2023) conducted an experimental study of the interactions between grid turbulence and a wave group. A significant enhancement in streamwise vorticity near the surface is observed after the passage of the wave group. Melville, Shear & Veron (Reference Melville, Shear and Veron1998) studied the evolution of a surface shear layer after the wind starts to blow over an initially quiescent flow. They found that small-scale Langmuir circulations are generated rapidly after the onset of wind waves. The generated small-scale structures have a considerable effect on the momentum mixing and thus the growth of the shear layer (Melville et al. Reference Melville, Shear and Veron1998; Veron & Melville Reference Veron and Melville2001). They also play an important role in scalar transport near the surface (Tejada-Martínez et al. Reference Tejada-Martínez, Hafsi, Akan, Juha and Veron2020). In these studies, the transient wave is imposed on either an isotropic turbulence field or a quiescent flow field, and fully developed turbulence with dominant coherent structures, such as streamwise streaks in the shear-driven turbulence boundary layer, is not considered.
In this study, to understand how a wave group impacts initially fully developed shear-driven turbulence, we perform a set of simulations in which we impose a Gaussian wave packet on turbulence and let the wave packet propagate and impact the underlying turbulence. This can be considered an ideal case in which an ocean boundary layer that is dominantly driven by wind shear is disturbed by an incoming wave group.
Compared with employing the wave-phase-averaged formulation to model the wave effect, we opt for a more direct approach that resolves the wave phases in turbulence–wave interactions. This method retains wave and turbulence motions with time scales comparable to or shorter than a wave period, in contrast to the wave-phase-averaged approach, which filters out these fast motions based on the scale separation assumption. Therefore, the wave-phase-resolved approach can provide more accurate modelling of the transient interactions between the wave group and turbulence. Additionally, in previous simulations of turbulence interacting with explicitly resolved waves (Zhou Reference Zhou1999; Fujiwara et al. Reference Fujiwara, Yoshikawa and Matsumura2018; Wang & Özgökmen Reference Wang and Özgökmen2018; Xuan et al. Reference Xuan, Deng and Shen2019, Reference Xuan, Deng and Shen2020; Tsai & Lu Reference Tsai and Lu2023), quantitative differences between the predictions obtained from wave-phase-averaged and wave-phase-resolved simulations were demonstrated. Zhou (Reference Zhou1999) and Wang & Özgökmen (Reference Wang and Özgökmen2018) compared wave-resolved simulations of Langmuir turbulence under a monochromatic wave train with CL simulations and found that although the simulation results obtained using the two approaches are qualitatively similar, the flow statistics differ quantitatively. In particular, Zhou (Reference Zhou1999) found that the turbulence intensity is stronger in the wave-resolved simulation than in the CL simulation. Xuan et al. (Reference Xuan, Deng and Shen2019) and Xuan et al. (Reference Xuan, Deng and Shen2020) investigated the turbulence–wave interaction mechanisms in Langmuir turbulence. It was identified that the turbulence is modulated by wave orbital motions, and the resulting wave-phase-dependent variation in turbulence plays an important role in the cumulative (or wave-phase-averaged) turbulence–wave interaction dynamics.
The results of the previous studies reviewed above suggest the advantage of resolving the wave phase for accurate predictions of the turbulence boundary layer under waves and for a comprehensive understanding of all the processes involved in turbulence–wave interactions. However, such simulations are often computationally expensive, mostly due to the necessity of using a deforming domain (see e.g. Ho & Patera Reference Ho and Patera1990; Hodges & Street Reference Hodges and Street1999; Xuan & Shen Reference Xuan and Shen2019). This computational cost can pose a challenge when applying wave-phase-resolved simulations to large-scale cases involving a complex wave field, such as a wave packet with multiple waves investigated in the present study. To efficiently simulate the wave packet effect on turbulence, in this study, we propose a novel simulation method based on Helmholtz decomposition. In this approach, the wave and turbulence fields are solved using two separate solvers. The wave, corresponding to the irrotational part in the Helmholtz decomposition, is simulated using the high-order spectral (HOS) method (Dommermuth & Yue Reference Dommermuth and Yue1987). The turbulence field is simulated by the modified Naiver–Stokes equations, which incorporate the wave orbital velocity such that the turbulence is directly coupled with phase-dependent wave forcing. We also propose an approximate boundary condition treatment based on Taylor series to describe the free-surface boundary conditions of the wave surface on the mean water surface, which allows the turbulence simulation to be conducted in a rectangular domain, thereby substantially reducing the computational cost while still resolving the wave packet effect.
Our analyses of the data obtained from the proposed simulation method indicate that turbulence undergoes a significant change within the short time that the wave packet passes through. For example, streamwise vortices are amplified, and vertical and spanwise velocity fluctuations are enhanced considerably, whereas streamwise velocity fluctuations are only minimally impacted. Moreover, the most rapid change in turbulence occurs within a narrow bandwidth at the core of the wave packet. Additionally, the turbulence velocity spectra with respect to spanwise wavelengths are examined to identify the scales of turbulence motions influenced by the wave packet. The most pronounced enhancement occurs near the surface for small-scale motions, yet changes in large-scale motions are also observed after the passage of the wave packet. The turbulence–wave interaction mechanisms at different scales are further analysed based on the evolution equation of the energy spectra within a wave-packet-following frame.
The present study of turbulence interacting with a wave packet offers two key contributions. First, the simulation results demonstrate that the proposed efficient simulation method for wave-phase-resolved simulation of turbulence under waves holds the potential for large-scale simulations of ocean surface boundary layers with complex waves. Second, the analyses of the transient evolution of turbulence under a wave packet reveal the key turbulence–wave interaction processes in a transient ocean and suggest the possible limitations of traditional turbulence–wave interaction models in fully capturing the dynamics. The remainder of this paper is organised as follows. The proposed simulation method and simulation set-up are described in § 2. The decompositions of the flow statistics are presented in § 3 as the foundation of the analyses. The wave packet impact on turbulence statistics is presented in § 4. Then, the underlying mechanisms are analysed in § 5. Finally, the conclusions are given in § 6, along with discussions about the implications for the turbulence–wave interaction dynamics.
2. Simulation method and set-up
In this section, we describe the proposed numerical scheme for the wave-phase-resolved simulation of turbulence under waves in § 2.1. We then present the simulation set-up and parameters for turbulence interacting with a wave packet in § 2.2.
2.1. Decomposition-based simulation of the turbulence–wave system
The wave and turbulent motions are described by the incompressible Navier–Stokes equations as
 $$\begin{gather} \frac{\partial \boldsymbol{U}}{\partial t} + (\boldsymbol{U}\boldsymbol{\cdot}\boldsymbol{\nabla})\boldsymbol{U} =-\frac{1}{\rho}\boldsymbol{\nabla} P + \nu\boldsymbol{\nabla}^2 \boldsymbol{U} - \boldsymbol{\nabla} \boldsymbol{\cdot} {\tau}^{SGS}, \end{gather}$$
 $$\begin{gather}\boldsymbol{\nabla}\boldsymbol{\cdot} \boldsymbol{U} = 0. \end{gather}$$
In the above equations,  $\boldsymbol {U}$ is the total flow velocity,
 $P$ is the dynamic pressure,
 $\rho$ is the water density and
 $\nu$ is the kinematic viscosity. The flow is modelled by large-eddy simulation, i.e. the above flow variables and equations are filtered to resolve only grid-scale structures, and
 ${\tau }^{SGS}$ is the subgrid-scale stress that accounts for the effect of unresolved small-scale motions. We remark that, in this study, we mainly focus on the wave effect on turbulence and, therefore, the Coriolis and stratification effects are neglected.
Then, we decompose the flow velocity  $\boldsymbol {U}$ into a potential part
 $\boldsymbol {u}_\phi$ and a rotational part
 $\boldsymbol {u}$, inspired by the Helmholtz theorem, as
 \begin{equation} \boldsymbol{U} = \boldsymbol{u}_\phi + \boldsymbol{u}. \end{equation}
The potential part can be associated with a velocity potential  $\phi$ as
 $\boldsymbol {u}_\phi =\boldsymbol {\nabla }\phi$, and
 $\phi$ satisfies the Laplace equation:
 \begin{equation} \nabla^2 \phi = 0. \end{equation}
By subtracting  $\boldsymbol {u}_\phi$ from (2.1) and (2.2), we obtain the governing equations for the rotational part
 $\boldsymbol {u}$:
 $$\begin{gather} \frac{\partial \boldsymbol{u}}{\partial t} + (\boldsymbol{u}\boldsymbol{\cdot}\boldsymbol{\nabla})\boldsymbol{u} =-\boldsymbol{u}_\phi\boldsymbol{\cdot}\boldsymbol{\nabla}\boldsymbol{u} - \boldsymbol{u}\boldsymbol{\cdot}\boldsymbol{\nabla}\boldsymbol{u}_\phi -\frac{1}{\rho}\boldsymbol{\nabla} p + \nu\boldsymbol{\nabla}^2 \boldsymbol{u} - \boldsymbol{\nabla}\boldsymbol{\cdot} \tau^{SGS}, \end{gather}$$
 $$\begin{gather}\boldsymbol{\nabla}\boldsymbol{\cdot} \boldsymbol{u} = 0. \end{gather}$$
Since the wave motions are predominantly irrotational, while turbulence is characterised by vortices or rotational motions, we assume that  $\boldsymbol {u}_\phi$ represents wave motions and that
 $\boldsymbol {u}$ corresponds to current and turbulence motions. Notably, treating the irrotational and rotational parts of the flow as waves and turbulence, respectively, is mainly for physical interpretation, while the Helmholtz decomposition does not imply the natures of the two parts. However, this interpretation is supported by the fact that most ocean wave theories are based on the irrotational flow assumption (Mei, Stiassnie & Yue Reference Mei, Stiassnie and Yue2005). Moreover, this interpretation is adopted by Craik & Leibovich (Reference Craik and Leibovich1976) for the derivation of CL formulations, where the wave motions are assumed to be irrotational and the vorticity equations are used to describe the current and turbulence motions. We note that the Helmholtz decomposition has also been widely applied to the analyses of various free-surface flow problems, such as the decay of viscous waves (Lamb Reference Lamb1932) and the interaction of vortex tubes with a free surface (Dommermuth Reference Dommermuth1993). Additionally, this decomposition approach is useful for studying the effect of one known component on another component (Joseph Reference Joseph2006), which aligns with the aim of the present study to investigate the wave effect on turbulence.
In (2.5), it is important to highlight the terms  $-\boldsymbol {u}_\phi \boldsymbol {\cdot }\boldsymbol {\nabla }\boldsymbol {u} - \boldsymbol {u}\boldsymbol {\cdot }\boldsymbol {\nabla }\boldsymbol {u}_\phi$, which arise from the decomposition of the advection term in the original (2.1). These terms account for the coupling between the irrotational and rotational parts. Since the irrotational and rotational parts are associated with the wave and turbulence motions, respectively, these two terms represent the wave effect on turbulence.
At the water surface described by  $z=\eta (x,y)$, where
 $\eta$ denotes the surface elevation,
 $x$ and
 $y$ denote the horizontal coordinates and
 $z$ denotes the vertical coordinate, the balance of stress leads to the following dynamic boundary conditions:
 \begin{equation} {\boldsymbol{n}} \boldsymbol{\cdot} \boldsymbol{\sigma} \boldsymbol{\cdot} {\boldsymbol{n}}^{\mathrm{T}} = 0, \quad {\boldsymbol{t}}_x \boldsymbol{\cdot} \boldsymbol{\sigma} \boldsymbol{\cdot} {\boldsymbol{n}}^{\mathrm{T}} = \tau_x, \quad {\boldsymbol{t}}_y \boldsymbol{\cdot} \boldsymbol{\sigma} \boldsymbol{\cdot} {\boldsymbol{n}}^{\mathrm{T}} = \tau_y, \end{equation}
where  $\boldsymbol {\sigma } = -P \boldsymbol {I}+\rho \nu (\boldsymbol {\nabla } \boldsymbol {U}+\boldsymbol {\nabla }\boldsymbol {U}^\mathrm {T})$ is the stress tensor and
 $\boldsymbol {I}$ denotes the identity tensor. The boundary condition (2.7a) describes the stress balance with the normal force applied by the air on the water surface and
 $\boldsymbol {n}$ denotes the surface-normal unit vector defined as
 \begin{equation} {\boldsymbol{n}} = \frac{{(-\eta_x, -\eta_y, 1)}}{C_0}, \end{equation}
where  $\eta _x$ and
 $\eta _y$ denote the derivatives
 $\eta _x=\partial \eta /\partial x$ and
 $\eta _y=\partial \eta /\partial y$, respectively. The term
 $C_0$, defined as
 $C_0={(\eta _x^2 + \eta _y^2 + 1)}^{1/2}$, normalises the vector to a unit length. Here, the air-side normal stress is set to zero. Equations (2.7b) and (2.7c) state that the tangential shear stresses imposed by the air on the surface are
 $\tau _x$ and
 $\tau _y$ in the
 $\boldsymbol {t}_x$ and
 $\boldsymbol {t}_y$ directions, respectively, where
 ${\boldsymbol {t}}_x$ and
 ${\boldsymbol {t}}_y$ are the surface tangential unit vectors defined as
 \begin{equation} {\boldsymbol{t}}_x = \frac{(1, 0, \eta_x)}{\sqrt{1+\eta_x^2}}, \quad {\boldsymbol{t}}_y = \frac{(0, 1, \eta_y)}{\sqrt{1+\eta_y^2}}. \end{equation}
The no-penetration condition of the surface leads to the free-surface kinematic boundary condition, which can be used to describe the evolution of  $\eta (x,y)$ as follows:
 \begin{equation} \frac{\partial \eta}{\partial t} - \boldsymbol{U}\boldsymbol{\cdot} (-\eta_x, -\eta_y, 1) = 0.\end{equation}
The boundary conditions above also need to be determined for  $\boldsymbol {u}_\phi$ and
 $\boldsymbol {u}$. First, since turbulence in the ocean mixed layer is typically much weaker than wave motions, we adopt the assumption that free-surface motions are mainly driven by wave motions or the irrotational velocity
 $\boldsymbol {u}_\phi$. In other words, we assume that the turbulence-induced surface fluctuations are much smaller than the wave elevations. This assumption is similar to that used by the CL formulation, in which the wave is undisturbed by turbulence and current. This assumption is further supported by the simulations of the Langmuir circulations under a progressive wave conducted by Xuan et al. (Reference Xuan, Deng and Shen2019), who reported that the turbulence-induced surface fluctuation is less than
 $1.2$ % of the wave amplitude. Under this assumption, we obtain the following decomposed kinematic boundary conditions for
 $\boldsymbol {u}_\phi$ and
 $\boldsymbol {u}$:
 $$\begin{gather} \frac{\partial \eta}{\partial t} - C_0 {\boldsymbol{n}}\boldsymbol{\cdot} \boldsymbol{u}_\phi = 0, \end{gather}$$
 $$\begin{gather}{\boldsymbol{n}}\boldsymbol{\cdot} \boldsymbol{u} = 0. \end{gather}$$
The normal stress balance (2.7a) can be written as an evolution equation for the velocity potential at the wave surface  $\phi |_{z=\eta }$ (Dommermuth Reference Dommermuth1993). In the present study, we neglect the turbulence effect on the wave, which is consistent with the assumption we use for the kinematic boundary condition. We also neglect the viscous dissipation of the wave, considering the short-term evolution of the wave packet in the simulation set-up (see § 2.2). These assumptions lead to the following evolution equation for
 $\phi$ that governs
 $\boldsymbol {u}_\phi$:
 \begin{equation} \frac{\partial \phi}{\partial t} + \frac{1}{2}{|\boldsymbol{\nabla}\phi|}^2 + g\eta = 0, \quad \text{at } z=\eta. \end{equation}
With the above assumptions, the wave evolution becomes independent of the turbulence simulation. As a result, the tangential stress balance for  $\boldsymbol {u}$ can be computed from (2.7b,c) as follows:
 \begin{equation} {\boldsymbol{t}}_x\boldsymbol{\cdot} \boldsymbol{\sigma}_u \boldsymbol{\cdot} {\boldsymbol{n}}^{\mathrm{T}} = \tau^r_x, \quad {\boldsymbol{t}}_y\boldsymbol{\cdot} \boldsymbol{\sigma}_u \boldsymbol{\cdot} {\boldsymbol{n}}^{\mathrm{T}} = \tau^r_y. \end{equation}
Here,  $\tau ^r_x$ and
 $\tau ^r_y$ are the stresses excluding the contributions from the irrotational velocity, defined as
 \begin{equation} \tau^r_x = \tau_x - {\boldsymbol{t}}_x\boldsymbol{\cdot} \boldsymbol{\sigma}_{u_\phi} \boldsymbol{\cdot} {\boldsymbol{n}}^{\mathrm{T}}, \quad \tau^r_y = \tau_y - {\boldsymbol{t}}_y\boldsymbol{\cdot} \boldsymbol{\sigma}_{u_\phi} \boldsymbol{\cdot} {\boldsymbol{n}}^{\mathrm{T}}, \end{equation}
where  $\boldsymbol {\sigma }_u=-p\boldsymbol {I}+\rho \nu (\boldsymbol {\nabla } \boldsymbol {u} + \boldsymbol {\nabla }\boldsymbol {u}^\mathrm {T})$ and
 $\boldsymbol {\sigma }_{u_\phi }=-p\boldsymbol {I}+\rho \nu (\boldsymbol {\nabla } \boldsymbol {u}_\phi + \boldsymbol {\nabla }\boldsymbol {u}_\phi ^\mathrm {T})$, with
 $\boldsymbol {u}_\phi$ being a known quantity when solving
 $\boldsymbol {u}$.
As discussed above, the rotational field  $\boldsymbol {u}$ described by (2.5) and (2.6) is bounded by the wave surface. Solving this system would traditionally require a boundary-fitted grid, as in Hodges & Street (Reference Hodges and Street1999) and Xuan & Shen (Reference Xuan and Shen2019), which is computationally expensive, especially for complex wave surface elevations such as the wave packet in the present problem. To reduce the simulation cost, we employ the Taylor expansion to approximate the boundary conditions using quantities on a flat plane
 $z=0$. The surface velocity at
 $z=\eta$ can be expressed using the Taylor series as
 \begin{equation} {u_i |}_{z=\eta} = {u_i |}_{z=0} + \sum_{l=1}^{M}{\frac{\eta^l}{l!}\left.\frac{\partial^l u_i}{\partial z^l}\right|}_{z=0} + O(\eta^{M+1}).\end{equation}
Here, we truncate the Taylor expansion at  $M=1$ to derive a first-order approximation of the boundary conditions (see Appendix A for detailed formulations of the boundary conditions). In this way, the boundary conditions become dependent on the values at
 $z=0$, which enables the solution of the rotational velocity
 $\boldsymbol {u}$ in a rectangular box rather than a wavy domain. As a result, the computational cost is reduced because the computation of the metric coefficients arising from a boundary-fitted grid is no longer needed. We note that the accuracy of this boundary approximation depends on the higher-order terms that are omitted, with the leading-order error being proportional to
 $(\eta /\delta )^{M+1}$, where
 $\delta$ represents a characteristic length scale related to the velocity gradient
 $\partial ^l u_i/\partial z^l$. Following the assumption made by Craik & Leibovich (Reference Craik and Leibovich1976) and Leibovich (Reference Leibovich1977) that the length scale
 $\delta$ is proportional to the inverse of the wavenumber
 $k^{-1}$, the magnitude of the error term is
 $O(\alpha ^{M+1})$, where
 $\alpha$ is the wave steepness. Our validation case based on the comparison between the present method and the boundary-fitted-grid method, which is detailed below, indicates that the first-order approximation can effectively capture the wave boundary effect. This approximation can be naturally applied to waves with multiple components, provided that the wave slope remains moderate. Therefore we anticipate that this approach can be used to simulate flows under more complex wave fields, such as broadband sea waves. However, for wave fields with higher steepness, a higher-order approximation might be necessary, which exceeds the scope of this study and is a direction for future research.
In the present study, a large-eddy simulation solver (Deng et al. Reference Deng, Yang, Xuan and Shen2019, Reference Deng, Yang, Xuan and Shen2020; Deng, Yang & Shen Reference Deng, Yang and Shen2022) is adapted to solve the governing equations (2.5) and (2.6) with the boundary conditions (2.12) and (2.14a,b) for  $\boldsymbol {u}$. The Fourier pseudo-spectral method is employed in the discretisation of the horizontal directions, and the finite-difference method is employed in the vertical direction. The solver is advanced in time using a second-order Adam–Bashforth method with the fractional-step method to enforce the incompressibility condition (Kim & Moin Reference Kim and Moin1985).
The potential wave flow determined by the boundary conditions (2.11) and (2.13) is solved using the HOS method (Dommermuth & Yue Reference Dommermuth and Yue1987; West et al. Reference West, Brueckner, Janda, Milder and Milton1987), which employs the Zakharov formulation (Zakharov Reference Zakharov1968) to describe the nonlinear wave evolution. This method has been widely applied for predicting phase-resolved nonlinear waves due to its accuracy and efficiency (see e.g. Hao & Shen Reference Hao and Shen2020). The details of the HOS method and the validations are given in Dommermuth & Yue (Reference Dommermuth and Yue1987).
To validate the accuracy of the numerical method to capture turbulence–wave interaction dynamics, we use the proposed method to simulate Langmuir circulations under a monochromatic wave train and compare the results with those obtained by the boundary-fitted-grid method. The detailed validation set-up and result comparisons are presented in Appendix C. The results obtained by our proposed method agree well with the results predicted by the boundary-fitted-grid method in terms of both the depth variation and wave-phase variation in the turbulence statistics. These results indicate that the proposed method can effectively capture the dominant turbulence–wave interaction dynamics with wave-phase dependency resolved.
It is worth noting that, although the decomposition results in two systems to simulate, both systems are simulated using efficient numerical methods. Therefore, the overall numerical method is still substantially cheaper than solving a unified system on a deforming boundary-fitted grid. The HOS method is formulated using surface variables, i.e. the surface elevation  $\eta =\eta (x,y)$ and the surface potential
 $\phi _s=\phi (x,y; z=\eta )$, and does not solve a fully three-dimensional wave velocity field. Therefore, its computational cost scales with the horizontal grid size. For the rotational motions, a three-dimensional field is required to capture complex turbulence structures. However, using a rectangular domain, facilitated by the approximated boundary conditions based on the Taylor expansion, has a significantly lower computational cost than does using a boundary-fitted-grid method.
Finally, we remark that the proposed approach, although solved in a rectangular domain, is fundamentally different from the rigid-lid approximation used in the CL formulation. First, the CL formulation is based on wave-phase averaging, wherein the vortex force term represents the averaged effect of the wave on turbulence. This is in contrast to the coupling term in (2.5), which depends on the phase-resolved wave orbital motions and represents the instantaneous effect of the wave motions on turbulence. We note that the wave coupling term in (2.5) can be reformulated using the cross product of  $\boldsymbol {u}_\phi$ and
 $\boldsymbol {\omega }$, as detailed in Appendix B. However, this alternative formulation fundamentally differs from the vortex force in the CL formulation in terms of the time scales resolved, despite their superficial similarity. It is worth noting that previous studies using wave-phase-resolved methods have shown that motions with time scales shorter than the wave period, which are unresolved in the CL formulation, can exert appreciable influences on motions with longer time scales (Zhou Reference Zhou1999; Xuan et al. Reference Xuan, Deng and Shen2020; Xuan & Shen Reference Xuan and Shen2022). In other words, these unresolved time scales in the CL formulation can lead to quantitative differences in turbulence statistics. Second, the flat surface of the CL formulation is a result of using the wave-phase-averaging formulation. In other words, the wave elevation is removed by averaging. In our proposed method, the approximated boundary conditions based on Taylor expansions about the flat plane
 $z=0$ still account for the effects associated with the wave elevation. This can be seen in the validation results of the wave-phase variation in the Reynolds stress (figure 20) presented in Appendix C. Both features are essential for retaining phase-related information in the simulation of turbulence–wave interactions and providing a more accurate representation of physical processes compared with the CL formulation.
2.2. Simulation parameters
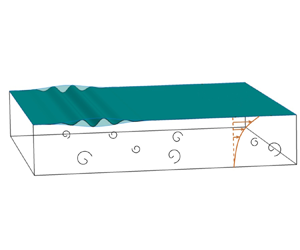
Figure 1 illustrates the simulation set-up, depicting a turbulent flow field influenced by an incoming Gaussian wave packet. We first simulate the base flow without waves, which is a fully developed turbulence boundary layer forced by a constant shear stress at the surface representing the effect of wind-driven shear. A free-slip boundary condition is applied at the bottom boundary, mimicking an ocean surface boundary layer base with weak shear (Belcher et al. Reference Belcher2012). To ensure that the turbulent flow reaches an equilibrium state, we apply a uniform adverse pressure gradient  $\partial p/\partial x=\tau _0/H$ to balance the surface momentum flux from the wind shear
 $\tau _0$, where
 $H$ is the boundary layer depth. In this study, we neglect the Coriolis effect to focus only on the turbulence and wave effects. Although the Coriolis effect is insignificant in coastal settings with a no-slip bottom (Tejada-Martínez & Grosch Reference Tejada-Martínez and Grosch2007; Grosch & Gargett Reference Grosch and Gargett2016), which is related to the dynamics of Langmuir supercells (Gargett et al. Reference Gargett, Wells, Tejada-Martínez and Grosch2004), the Coriolis force does influence momentum balance in the open ocean. Our set-up uses the pressure gradient to balance the wind shear, facilitating our analysis of turbulence–wave dynamics without the rotational effect. This set-up has been employed in studying turbulence–wave interactions in the context of Langmuir turbulence by Xuan et al. (Reference Xuan, Deng and Shen2020). The base flow is simulated with a moderate Reynolds number
 $Re_\tau =u_* H/\nu = 2000$. The simulated flow condition with a moderate Reynolds number could be directly relevant to small-scale turbulence–wave interactions, e.g. Langmuir circulations of length scales
 $O(10\ {\rm cm})$ (see the discussions in Xuan et al. (Reference Xuan, Deng and Shen2020)). These small-scale circulations naturally arise from the interactions of gravity–capillary waves with underlying turbulence, e.g. after wind starts blowing over an initially quiescent water (Melville et al. Reference Melville, Shear and Veron1998; Veron & Melville Reference Veron and Melville2001; Tejada-Martínez et al. Reference Tejada-Martínez, Hafsi, Akan, Juha and Veron2020). The Reynolds number in a realistic ocean surface boundary layer is higher. Although it would be desirable to perform simulations at larger Reynolds numbers, which can be crucial for a realistic ocean boundary layer with interplays of other forces including the Coriolis and buoyancy forces, it is worth noting that low- and moderate-Reynolds-number flows can still provide valuable insights into higher-Reynolds-number dynamics. Xuan et al. (Reference Xuan, Deng and Shen2019) compared the wave-phase-resolved simulations of Langmuir turbulence at
 $Re_\tau =2000$ with those at
 $Re_\tau =500$ and found that the fundamental turbulence–wave interaction mechanisms remain consistent across different Reynolds numbers. Therefore, the present set-up is appropriate for capturing the dominant turbulence structures and the associated turbulence–wave interaction dynamics.
Sketch of the problem set-up: turbulence interacting with a Gaussian wave packet.

We then add the wave packet into the simulation and enable the turbulence–wave coupling described in § 2.1. The wave packet is initialised by the wave elevation  $\eta$ and surface potential
 $\phi _s$ according to the linear wave theory as
 $$\begin{gather} \eta(x,t)|_{t=0} = A_0(x)\cos (k_0 x), \end{gather}$$
 $$\begin{gather}\phi_s(x,t)|_{t=0} = A_0(x) \omega_0 k_0^{-1} \sin (k_0 x). \end{gather}$$
This corresponds to a carrier wave with wavenumber  $k_0$ and angular frequency
 $\omega _0$ bounded by an initial envelope
 $A_0(x)$. The envelope
 $A_0(x)$ is a Gaussian shape given by
 \begin{equation} {A_0(x) = a_0 \exp \left(-{\frac{{(x - x_0)}^2}{2\chi^2}}\right),} \end{equation}
where  $a_0$ is the amplitude of the packet,
 $x_0$ is the initial centre of the packet and
 $\chi$ is the bandwidth of the Gaussian packet. The carrier wavelength is set to
 $k_0 H=12$ and the carrier wave satisfies the deep-water wave condition. Following van den Bremer & Taylor (Reference van den Bremer and Taylor2016), we characterise the wave packet with two dimensionless parameters: a steepness parameter
 $\alpha$ defined as
 $\alpha =a_0 k_0$ and a bandwidth parameter
 $\epsilon$ defined as
 $\epsilon ={(k_0 \chi )}^{-1}$. Wave packets with different carrier wave steepnesses are considered, including
 $\alpha =a_0 k_0 =0.12$,
 $0.09$ and
 $0.06$, and the three cases are denoted as
 ${W}_{12}$,
 ${W}_{09}$ and
 ${W}_{06}$, respectively. We set the bandwidth parameter to
 $\epsilon =0.13$ to ensure a relatively small dispersion (van den Bremer & Taylor Reference van den Bremer and Taylor2016). Here, we use the friction velocity at the water surface,
 $u_*=\sqrt {\tau _0/\rho }$, as the characteristic velocity. The Froude number, defined as
 $Fr=u_*/\sqrt {gH}$, affects the characteristic velocity of the wave motion and is set to
 $3.74 \times 10^{-4}$. This Froude number is chosen such that the resulting wave packet has a fast propagation velocity compared with the underlying turbulent flow and can exert strong straining on turbulence. Based on the linear wave theory, the phase velocity of the carrier wave and the group velocity of the wave packet are
 $c_0=\sqrt {g/k_0}={(Fr\sqrt {k_0 H})}^{-1} u_*=772 u_*$ and
 $c_g=c_0/2=386 u_*$, respectively. Notably, the mean current velocity of a developed shear-driven boundary layer, which typically reaches a maximum of
 $O(20 u_*)$ at the surface where the driving stress is applied, is negligibly small compared with the wave packet propagation. In other words, the mean current advection of turbulence is expected to be nearly stationary compared to the wave packet passage. The ratios between the maximum wave orbital straining magnitude within the wave packet
 $a_0 k_0^2 c_0$ and the characteristic turbulence large-eddy strain rate
 $u_*/H$ are
 $1112$,
 $834$ and
 $556$ for cases
 ${W}_{12}$,
 ${W}_{09}$ and
 ${W}_{06}$, respectively, indicating that the wave straining effect is much stronger than the shear effect. To estimate the cumulative effect of the wave on turbulence compared with that of the shear straining, we compute the turbulence Langmuir number
 ${La}_t =\sqrt {u_*/U_s}$, where we use the maximum surface Stokes drift of the wave packet
 $U_s=\alpha ^2 c_0$ as the characteristic Stokes drift velocity. We obtain
 ${La}_t=0.3$,
 $0.4$ and
 $0.6$ for the three cases, respectively, which fall within the Langmuir regime where the cumulative wave forcing effect is dominant (Li, Garrett & Skyllingstad Reference Li, Garrett and Skyllingstad2005). Furthermore, we note that the Froude number
 $Fr=3.74 \times 10^{-4}$ selected falls within a range typical of oceanic conditions. For example, this could correspond to a friction velocity
 $u_*=8 \times 10^{-3}\ \text {m}\ \text {s}^{-1}$ and a mixed layer depth of
 $47$ m. The domain size is set to
 $L_x \times L_y \times H = 6{\rm \pi} H \times 2{\rm \pi} H \times H$. The domain is discretised by a grid of size
 $512 \times 256 \times 112$. To obtain the statistics of turbulence modified by the wave packet, we perform ensemble simulations of the wave packet propagating through the turbulence field using different initial instants. The wave field is maintained the same across different ensemble runs. For each case,
 $30$ ensemble runs are carried out.
3. Definitions of mean flows and fluctuations
The wave packet described by (2.17) introduces two length or time scales into the turbulence–wave interaction, corresponding to the carrier wave and the wave group envelope (see also the animation in the supplementary movie available at https://10.1017/jfm.2024.724). In this study, since we focus on the variation in turbulence statistics with respect to the wave packet scale, we define a flow decomposition for further analyses based on the following averaging procedure. We first introduce a Reynolds decomposition based on spanwise and ensemble averaging, denoted by  $\langle {\cdot} \rangle$, which is defined as
 \begin{equation} \langle \,f \rangle(x,z,t) = \frac{1}{N L_y}\sum_{i = 1}^{N}\int f(x,y,z,t;i) \,\mathrm{d} y. \end{equation}
Here,  $N$ is the number of ensembles, and the index
 $i$ denotes the
 $i$th ensemble. Given that the imposed wave packet remains the same across ensemble runs and that the wave is two-dimensional, i.e. spanwise uniform, we interpret the averaged quantity obtained from (3.1) as the mean quantity associated with each wave phase. For the rotational motions
 $\boldsymbol {u}$, the mean flow velocity
 $\langle \boldsymbol {u} \rangle$ includes the mean current and the current variations induced by the passage of the wave group. The residual fluctuating motions are considered as turbulence fluctuations, denoted by
 $\boldsymbol {u}'$, i.e.
 $\boldsymbol {u} = \langle \boldsymbol {u} \rangle + \boldsymbol {u}'$.
Considering the two scales associated with the wave group, we proceed to decompose the mean quantity  $\langle {f}\,\rangle$ into a packet-scale mean
 $\hat {f}$ and a carrier-wave-scale variation
 $\tilde {f}$, i.e.
 $\langle \,f \rangle = \hat {f} + \tilde {f}$. The packet-scale mean
 $\hat {f}$ is obtained through averaging in a packet-following moving frame, defined as
 \begin{equation} \hat{f}(x', z) = \frac{1}{t_2 - t_1} \int_{t_1}^{t_2} {\langle \,f \rangle (x' + x_0 +c_g t, z, t)}\,\mathrm{d}t.\end{equation}
Here,  $x' = x - (x_0 + c_g t)$ is the coordinate in the packet-following frame, where
 $c_g$ is the group velocity of the wave packet. Within the packet-following frame,
 $x'=0$ is the centre of the wave packet. Due to the use of periodic boundary conditions, the wave packet is allowed to propagate through the domain and impacts the turbulent flows repeatedly. In the present study, we focus only on the first passage of the wave packet, which is equivalent to studying the turbulence response to one single wave packet.
Because the phase speed of the carrier wave is twice the group velocity of the wave packet for deep-water waves according to linear wave theory, averaging within a frame moving at the group velocity effectively filters out fluctuations at the time scale of the carrier wave. Therefore, through this averaging process, we can obtain the mean statistics associated with the wave group. We also remark that the packet-following averaging is feasible because, with weak dispersion, the wave packet maintains its envelope throughout the averaging duration. Moreover, the turbulence statistics observed in the packet-moving frame remain quasi-steady for a significant amount of time during the propagation of the wave packet, excluding only the initial stage of the wave packet onset. Based on the observation of data, we set  $t_1$ and
 $t_2$ (equation (3.2)) for the averaging duration to
 $0.01$ and
 $0.04$, respectively.
Following the above procedure, we obtain a triple decomposition of flow variables as
 \begin{equation} f = \langle\, {f}\rangle + f' = \hat{f} + \tilde{f} + f'. \end{equation}
As defined above,  $\langle\, {f}\rangle$ is the ensemble average,
 $f'$ is the turbulence fluctuation,
 $\hat {f}$ is the packet-scale mean and
 $\tilde {f}$ is the carrier-wave-scale variation. In the following analyses, we focus on the flow response to the wave packet at the packet scale, e.g. the packet-scale turbulence fluctuation intensity
 $\widehat {f'^2}$.
4. Variations in the turbulence statistics and structure with respect to the wave packet
In this section, we analyse the variation in the turbulence statistics with respect to the wave packet, including the enstrophy components (§ 4.1) and Reynolds normal stresses (§ 4.2). Additionally, the energy spectra are examined to identify the length scales at which the turbulence is influenced (§ 4.3).
4.1. Enstrophy
The enstrophy quantifies the strength of turbulence vorticity fluctuations. Figure 2 shows the three components of the packet-scale mean enstrophy,  $\widehat {\omega '^2_i}$, near the surface. We find that the variations in
 $\widehat {\omega '^2_i}$ are qualitatively similar across all considered cases, and the primary difference lies in the magnitude of changes. This is because the imposed wave packets have the same characteristic length scales, i.e. the carrier wavenumber
 $k_0$ and bandwidth
 $\chi$, while the wave amplitudes vary. Therefore, only the results for case
 ${W}_{12}$ are presented. The quantitative differences among the cases, particularly the effect of the wave steepness, are discussed later in this section. First, we note that the streamwise and spanwise vortices are dominant and are related to the quasi-streamwise vortices and the head of the hairpin vortices, which are the predominant structures in a shear-driven boundary layer (Jeong et al. Reference Jeong, Hussain, Schoppa and Kim1997; Wu & Christensen Reference Wu and Christensen2006). In contrast to a no-slip boundary condition, vertical vortices are allowed to attach to the free surface. Therefore,
 $\widehat {\omega '^2_z}$ is non-zero at the surface (Shen et al. Reference Shen, Zhang, Yue and Triantafyllou1999). Figure 2 clearly shows that the turbulence vortices are influenced by the wave packet and that the strengths of the enstrophy components change during the passage of the wave packet.
Contours of the packet-following average of the enstrophy components: (a)  $\widehat {\omega '^2_x}/{(u_*^2/\nu )}^2$, (b)
 $\widehat {\omega '^2_y}/{(u_*^2/\nu )}^2$ and (c)
 $\widehat {\omega '^2_z}/{(u_*^2/\nu )}^2$, where
 $u_*^2/\nu$ is the mean shear at the surface. The dashed lines at the top of the panels illustrate the shape of the wave envelope. The arrow within the envelope indicates the direction of the wave group velocity
 $c_g$. Correspondingly, the right and left sides are the leading and trailing edges of the packet, respectively. Case
 ${W}_{12}$ is shown.

Figure 3 shows the ratio of the enstrophy components to their values at each depth under the leading edge of the wave packet to provide a clearer view of the relative change in the vorticity strength. All three components of enstrophy show enhancement below the wave packet core, followed by a decrease, creating an intensity bump below the packet core. This intensity bump is caused by the kinematic disturbances by the wave elevation. We take the spanwise enstrophy component,  $\widehat {\omega _y'^2}$, which exhibits the most significant influence, as an example. We note that
 $\omega _y' = \partial u'/\partial z - \partial w'/\partial x$ and thus
 $\widehat {\omega _y'^2}$ is contributed by the variances of
 $\partial u'/\partial z$ and
 $\partial w'/\partial x$ and their cross-correlation. A comparison among the three contributions reveals that
 $(\partial u'/\partial z)^2$ accounts for approximately
 $80\,\%$ of the near-surface
 $\widehat {\omega _y'^2}$ around the wave packet core (
 $k_0 z > -0.5$ and
 $-\chi < x' < \chi$). As the wave packet core approaches, the wave amplitude increases and the stretching and compression of spanwise vortices in the vertical direction intensify with the increasing surface fluctuations, leading to strong variations in
 $\partial u'/\partial z$, and consequently in
 $\widehat {\omega _y'^2}$ under the packet core. At the trailing edge of the wave packet, with the decreasing wave surface fluctuation amplitude, the disturbances in vorticity fluctuations caused by the wave surface diminish rapidly. In a fully developed shear-driven boundary layer,
 $u'$ is the strongest among the three velocity components, therefore
 $\partial u'/\partial z$ exhibits the greatest influence and
 $\widehat {\omega _y'^2}$ shows the largest intensity bump under the packet core. By comparison, the intensity bumps in the streamwise and spanwise enstrophy components are relatively weak. For the streamwise vorticity fluctuations, variations in
 $\partial w'/\partial z$ predominantly contribute to the observed increase in
 $\widehat {\omega '^2_x}$ at the wave packet core. For
 $\widehat {\omega '^2_z}$, the increase can be attributed to the forward and backward tilting of surface-connected vertical vortices as different wave phases pass.
Relative variation in the enstrophy components compared with their undisturbed values at the leading edge of the wave packet ( $x'=3\chi$): (a)
 $\widehat {\omega '^2_x}/\widehat {\omega '^2_x}|_{x'=3\chi }$, (b)
 $\widehat {\omega '^2_y}/\widehat {\omega '^2_y}|_{x'=3\chi }$ and (c)
 $\widehat {\omega '^2_z}/\widehat {\omega '^2_z}|_{x'=3\chi }$. The dashed lines at the top of the panels illustrate the shape of the wave envelope. The arrow within the envelope indicates the direction of the wave group velocity
 $c_g$. Correspondingly, the right and left sides are the leading and trailing edges of the packet, respectively. Case
 ${W}_{12}$ is shown.

Figure 4 plots the relative increases in the enstrophy,  $\Delta \widehat {\omega '^2_i}/\widehat {\omega '^2_i}|_{x'=3\chi }$, at fixed depths for cases with different steepness
 $\alpha = a_0 k_0$ (
 ${W}_{12}$,
 ${W}_{09}$ and
 ${W}_{06}$; see § 2.2), where
 $\Delta \widehat {\omega '^2_i}$ denotes the change from leading edge of the wave packet, defined as
 $\vphantom{\widehat {\omega '^2_i}^{12}}\Delta \widehat {\omega '^2_i} = \widehat {\omega '^2_i} - \widehat {\omega '^2_i}|_{x'=3\chi }$. In figure 4, two depths,
 $k_0 z=-0.5$ and
 $k_0 z = -0.8$, are plotted as examples, but the following observations apply to all depths unless otherwise stated. After the wave packet core passes and the strong disturbances caused by the wave elevation subside quickly, the three enstrophy components are still considerably enhanced compared with their initial values at the leading edge for all cases considered, indicating that the modification of turbulence by the wave packet persists.
Relative increase in the enstrophy components at fixed depths,  $k_0 z = -0.5$ (——–) and
 $k_0 z =-0.8$ (– – –), for cases
 ${W}_{12}$ (
 $\alpha =0.12$,
 $\bullet$),
 ${W}_{09}$ (
 $\alpha =0.09$,
 $\blacksquare$) and
 ${W}_{06}$ (
 $0.06$,
 $\blacktriangledown$): (a)
 $\Delta \widehat {\omega _x'^2}/\widehat {\omega _x'^2}|_{x'=3\chi }\vphantom{\widehat {\omega '^2_i}^{12}}$, (b)
 $\Delta \widehat {\omega _y'^2}/\widehat {\omega _y'^2}|_{x'=3\chi }$ and (c)
 $\Delta \widehat {\omega _z'^2}/\widehat {\omega _z'^2}|_{x'=3\chi }$.

To understand the changes in turbulence vorticity after the wave packet passes, the vertical profiles of  $\Delta \widehat {\omega '^2_i}/\widehat {\omega '^2_i}|_{x'=3\chi }$ at the trailing edge of the wave packet (
 $x'=-3\chi$) are plotted in figure 5. It is evident from the figure that the turbulence vorticity fluctuations in all three directions are enhanced, and the streamwise vorticity is enhanced the most at the trailing edge. For example, in case
 ${W}_{12}$, at the trailing edge (
 $x'=-3\chi$), the relative increase in
 $\widehat {\omega '^2_x}$ reaches
 $30\,\%$ at
 $k_0 z=-0.3$. By comparison, the final enhancements of
 $\widehat {\omega '^2_y}$ and
 $\widehat {\omega '^2_z}$ at the trailing edge relative to the leading edge are weaker, with the peak relative increases being less than
 $20\,\%$. Among the three cases, the vertical variations of
 $\Delta \widehat {\omega '^2_i}/\widehat {\omega '^2_i}|_{x'=3\chi }$ at the trailing edge are similar. The wave effect is most prominent near the surface, consistent with the contours shown in figures 2 and 3. Away from the surface, e.g. below
 $z < 2k_0^{-1}$, the turbulence vorticity intensity is changed much less.
Vertical profiles of the relative changes in the enstrophy components at the trailing edge ( $x'=-3\chi$) compared with the leading edge (
 $x'=3\chi$) for cases
 ${W}_{12}$ (
 $\alpha =0.12$,
 $\bullet$),
 ${W}_{09}$ (
 $\alpha =0.09$,
 $\blacksquare$) and
 ${W}_{06}$ (
 $\alpha =0.06$,
 $\blacktriangledown$): (a)
 $\Delta \widehat {\omega '^2_x}/\widehat {\omega '^2_x}|_{x'=3\chi }$, (b)
 $\Delta \widehat {\omega '^2_y}/\widehat {\omega '^2_y}|_{x'=3\chi }$ and (c)
 $\Delta \widehat {\omega '^2_z}/\widehat {\omega '^2_z}|_{x'=3\chi }$.

We further quantify the overall intensification of the enstrophy components by evaluating a vertical integration as
 \begin{equation} \Delta \varOmega_i = \int_{D}^0 \Delta\widehat{\omega'^2_i} \,\mathrm{d}z = \int_{D}^0 (\widehat{\omega'^2_i}|_{x'=-3\chi} - \widehat{\omega'^2_i}|_{x'=3\chi} ) \,\mathrm{d}z, \end{equation}
where the depth  $D$ from which the integration starts is set to
 $D = -2 k_0^{-1}$ considering that the changes in the enstrophy are negligible below this depth (figure 5). The normalised integrated changes for cases
 ${W}_{12}$,
 ${W}_{09}$ and
 ${W}_{06}$ are listed in table 1, which confirms our observation that the streamwise vortices are enhanced more significantly than the other two components.
Relative changes in the enstrophy components integrated from  $k_0 z=-2.0$ to the surface after the passage of the wave packet.

Figures 4 and 5, along with table 1, indicate that the relative changes in the enstrophy increase with the wave steepness  $\alpha =a_0 k_0$, both during the packet passage and for the final effect after the packet passes. We find that the variation in the streamwise enstrophy component,
 $\widehat {\omega '^2_x}$, approximately scales with
 $\alpha ^2$, as shown by the collapse of curves in figure 6. The normalisation with the steepness squared is also applied to the integrated changes in the streamwise enstrophy components, as listed in table 1. The integrated relative
 $\widehat {\omega '^2_x}$ enhancement, when normalised by
 $\alpha ^2$, becomes comparable, further confirming that the leading-order changes induced by the wave packet in the streamwise vorticity fluctuations are proportional to
 $\alpha ^2$. However, such a relationship is not observed for the spanwise and vertical enstrophy components.
Normalised relative changes in the streamwise enstrophy,  $\Delta \widehat {\omega '^2_x}/\widehat {\omega '^2_x}|_{x'=3\chi }$, for cases
 ${W}_{12}$ (
 $\alpha =0.12$,
 $\bullet$),
 ${W}_{09}$ (
 $\alpha =0.09$,
 $\blacksquare$) and
 ${W}_{06}$ (
 $\alpha =0.06$,
 $\blacktriangledown$). (a) Variation along the wave packet at fixed depths,
 $k_0 z = -0.5$ (——–) and
 $k_0 z =-0.8$ (– – –). (b) Vertical profiles of the changes at the trailing edge (
 $x'=-3\chi )$ compared with at the leading edge (
 $x'=3\chi$).

The fact that the streamwise vortices have the largest enhancement is to some extent consistent with the prediction by the CL theory (Craik & Leibovich Reference Craik and Leibovich1976) or the analysis based on the wave-phase-resolved simulation of Langmuir turbulence interacting with a monochromatic wave (Xuan et al. Reference Xuan, Deng and Shen2019), i.e. the surface wave cumulatively tilts vertical vortices to enhance the streamwise vortices. This effect of the surface wave is considered related to the generation of elongated quasi-streamwise vortices in Langmuir turbulence. The enhancement of the streamwise vortices is also reported in laboratory experiments of grid turbulence interacting with a passing wave group (Smeltzer et al. Reference Smeltzer, Rømcke, Hearst and Ellingsen2023), consistent with the prediction of isotropic turbulence distortion by a surface wave using the rapid distortion theory (Teixeira & Belcher Reference Teixeira and Belcher2002). Smeltzer et al. (Reference Smeltzer, Rømcke, Hearst and Ellingsen2023) also found that the streamwise enstrophy enhancement increases with the wave steepness, consistent with our data. In the present study, the base flow is a fully developed shear-driven boundary layer, and therefore the turbulence–wave interactions are not expected to be quantitatively comparable to other types of flows. However, the trend of the overwhelming enhancement of streamwise vortices suggests that the streamwise vorticity enhancement is a universal feature of turbulence–wave interactions. Considering the relations of streamwise vortices with vertical and spanwise turbulent motions, we expect that the vertical and spanwise Reynolds normal stresses will also exhibit strong enhancement. On the other hand, given that the vertical vortices near the surface boundary are mostly related to spanwise variations in streamwise velocity fluctuations, known as high-speed and low-speed streaks (Jeong et al. Reference Jeong, Hussain, Schoppa and Kim1997), we expect that the moderate enhancement of vertical vortices would be associated with a slight increase in streamwise velocity fluctuations. The detailed statistics of the Reynolds normal stresses are discussed next.
4.2. Reynolds normal stresses
The mean Reynolds normal stresses in the packet-following frame  $\widehat {u'^2_i}$ for case
 ${W}_{12}$ are plotted in figure 7. Here, case
 ${W}_{12}$ is used as the representative case for the qualitative discussions of the wave packet effect on
 $\widehat {u'^2_i}$ because cases
 ${W}_{09}$ and
 ${W}_{06}$ share similar characteristics. The quantitative differences among the cases are discussed in detail later in this section.
Contours of the packet-following average of the Reynolds normal stresses: (a)  $\widehat {u'^2}$, (b)
 $\widehat {v'^2}$ and (c)
 $\widehat {w'^2}$. The dashed lines at the top of the panels illustrate the shape of the wave envelope. The arrow within the envelope indicates the direction of the wave group velocity
 $c_g$. Correspondingly, the right and left sides are the leading and trailing edges of the packet, respectively. Case
 ${W}_{12}$ is shown.

We can observe the relation  $\widehat {u'^2} > \widehat {v'^2} > \widehat {w'^2}$, which is characteristic of a fully developed turbulent boundary layer driven by shear forcing. Due to the free-surface kinematic boundary condition (2.12), the vertical fluctuations are suppressed near the surface (Shen et al. Reference Shen, Zhang, Yue and Triantafyllou1999). From the variations in contour levels and shapes, all three components of the Reynolds normal stresses exhibit a strong dependence on the wave packet location. Consistent with the results of the enstrophy components in § 4.1, the disturbance in the Reynolds normal stresses persists at the trailing edge of the wave packet (
 $x'=-3\chi$), confirming that the wave packet induces cumulative changes in turbulence. Specifically, all three velocity fluctuations experience varying degrees of enhancement, suggesting a net energy transfer from the waves to turbulence.
To further quantify the turbulence enhancement effect of the wave packet, we calculate the relative changes in the Reynolds normal stresses by normalising them by their values at each depth under the leading edge of the wave packet, i.e.  $\widehat {u'^2_i}/\widehat {u'^2_i}|_{x'=3\chi }$. The contours of these ratios are presented in figure 8. It is shown that the vertical velocity fluctuations undergo the most substantial increase among the three components. Notably, by the moment the wave packet has passed, i.e. at the trailing edge
 $x'=-3\chi$,
 $\widehat {w'^2}$ increases as much as
 $45\,\%$. The increase in the spanwise velocity fluctuations is less pronounced than that in the vertical velocity fluctuations but can still reach approximately
 $24\,\%$ after the passage of the wave packet. By comparison, the change in the streamwise velocity fluctuations is relatively small, less than
 $10\,\%$ at the trailing edge.
Relative variation in the Reynolds normal stresses compared with their undisturbed values at the leading edge of the wave packet ( $x'=3\chi$): (a)
 $\widehat {u'^2}/\widehat {u'^2}|_{x'=3\chi }$, (b)
 $\widehat {v'^2}/\widehat {v'^2}|_{x'=3\chi }$ and (c)
 $\widehat {w'^2}/\widehat {w'^2}|_{x'=3\chi }$. The dashed lines at the top of the panels illustrate the shape of the wave envelope. The arrow within the envelope indicates the direction of the wave group velocity
 $c_g$. Correspondingly, the right and left sides are the leading and trailing edges of the packet, respectively. Case
 ${W}_{12}$ is shown.

The wave effect differs by velocity components, not only in terms of the enhancement ratio but also in terms of the depth dependence. As evident in figures 7 and 8, the enhancement effect is most pronounced near the surface. Due to the near-surface enhancement, the peak of  $\widehat {w'^2}$ shifts towards the surface after the wave packet passes, as shown in figure 7(c). Because both the undisturbed
 $\widehat {u'^2}$ and
 $\widehat {v'^2}$ are stronger near the surface, the enhancement by the wave does not alter their peak depths. The depths that the wave can influence also differ by component. The vertical velocity fluctuations are affected not only in the near-surface region but also away from the surface, with an increase of more than
 $10\,\%$ at
 $k_0 z=-1$ (figure 8c). The deep influence of the wave on
 $\widehat {w'^2}$ is also evident in figure 7(c), in which we can observe a considerable change in the contour shapes of
 $\widehat {w'^2}$. By comparison, the wave impact on
 $\widehat {v'^2}$ is more localised near the surface and relatively weak below
 $k_0 z = -1$ (figure 8b). The weak wave effect on
 $\widehat {u'^2}$ is also confined to the near-surface region. Given that the length scales of turbulent coherent structures usually increase with distance from the boundary, we expect that the wave packet may influence some relatively large-scale structures associated with
 $w'$, which is further discussed in § 4.3.
Figure 9 shows the relative variation in the Reynolds normal stresses at fixed depths,  $\Delta \widehat {u'^2_i}/\widehat {u'^2_i}|_{x'=3\chi }$, for cases with different steepness
 $\alpha =a_0 k_0$ (
 ${W}_{12}$,
 ${W}_{09}$ and
 ${W}_{06}$), where
 $\Delta \widehat {u'^2_i}$ denotes the change in the Reynolds normal stresses, defined as
 $\Delta \widehat {u'^2_i} = \widehat {u'^2_i} - \widehat {u'^2_i}|_{x'=3\chi }$. Here,
 $\Delta \widehat {u'^2_i}$ at two depths,
 $k_0 z =-0.5$ and
 $k_0 z=-0.8$, are plotted as examples. At all depths, the turbulence enhancement increases with the steepness
 $\alpha$. We find that the changes in Reynolds normal stresses can be approximately normalised by
 $\alpha ^2$. Figures 10 and 11 show the along-packet variations and the vertical profiles of
 $\Delta \widehat {u'^2_i}/(\alpha ^2 \widehat {u'^2_i}|_{x'=3\chi })$. In both figures, the curves of
 $\Delta \widehat {w'^2}/(\alpha ^2 \widehat {w'^2}|_{x'=3\chi })$ and
 $\Delta \widehat {v'^2}/(\alpha ^2 \widehat {v'^2}|_{x'=3\chi })$ collapse, indicating that such scaling works well for the vertical and spanwise Reynolds normal stresses at different depths throughout the passage of the wave packet. As analysed in § 4.1, the scaling with
 $\alpha ^2$ is also observed for the streamwise enstrophy. Considering that the streamwise vorticity fluctuation
 $\omega _x'$ is related to the gradients of
 $w'$ and
 $v'$, the observed
 $\alpha ^2$ scaling law is consistent across these turbulence statistics. The behaviour of the streamwise Reynolds normal stress deviates from the proposed scaling. As shown in figures 10 and 11, after applying the
 $\alpha ^2$ normalisation, the variations in
 $\Delta \widehat {u'^2}$ are not monotonically dependent on
 $\alpha$, suggesting that the wave steepness may not be the only parameter for scaling the variation behaviour of streamwise velocity fluctuations. Since the gradients of
 $u'$ are related to the spanwise and vertical vorticity, this deviation is also consistent with our findings that the changes in the spanwise and vertical enstrophy components do not follow the
 $\alpha ^2$ scaling law.
Relative increase in the Reynolds normal stresses at fixed depths,  $k_0 z = -0.5$ (——–) and
 $k_0 z =-0.8$ (– – –), for cases
 ${W}_{12}$ (
 $\alpha =0.12$,
 $\bullet$),
 ${W}_{09}$ (
 $\alpha =0.09$,
 $\blacksquare$) and
 ${W}_{06}$ (
 $0.06$,
 $\blacktriangledown$): (a)
 $\Delta \widehat {u'^2}/\widehat {u'^2}|_{x'=3\chi }$, (b)
 $\Delta \widehat {v'^2}/\widehat {v'^2}|_{x'=3\chi }$ and (c)
 $\Delta \widehat {w'^2}/\widehat {w'^2}|_{x'=3\chi }$.

Relative increase in the Reynolds normal stresses at fixed depths,  $k_0 z = -0.5$ (——–) and
 $k_0 z =-0.8$ (– – –), normalised by
 $\alpha ^2$, for cases
 ${W}_{12}$ (
 $\alpha =0.12$,
 $\bullet$),
 ${W}_{09}$ (
 $\alpha =0.09$,
 $\blacksquare$) and
 ${W}_{06}$ (
 $0.06$,
 $\blacktriangledown$): (a)
 $\Delta \widehat {u'^2}/(\alpha ^2\widehat {u'^2}|_{x'=3\chi })$, (b)
 $\Delta \widehat {v'^2}/(\alpha ^2\widehat {v'^2}|_{x'=3\chi })$ and (c)
 $\Delta \widehat {w'^2}/(\alpha ^2\widehat {w'^2}|_{x'=3\chi })$.

Normalised vertical profiles of the changes in the Reynolds normal stresses at the trailing edge ( $x'=-3\chi$) compared with at the leading edge (
 $x'=3\chi$) for cases
 ${W}_{12}$ (
 $\alpha =0.12$, ——–),
 ${W}_{09}$ (
 $\alpha =0.09$, – – –) and
 ${W}_{06}$ (
 $\alpha =0.06$, —
 $\cdot$ —): (a)
 $\Delta \widehat {u'^2}/(\alpha ^2\widehat {u'^2}|_{x'=3\chi })$, (b)
 $\Delta \widehat {v'^2}/(\alpha ^2\widehat {v'^2}|_{x'=3\chi })$ and (c)
 $\Delta \widehat {w'^2}/(\alpha ^2\widehat {w'^2}|_{x'=3\chi })$.

To further quantify the overall intensification of turbulence, we examine the integrated changes in the Reynolds normal stresses near the surface, defined as
 \begin{equation} \Delta E_i = \int_D^0 \Delta\widehat{u'^2_i} \,\mathrm{d}z = \int_D^0 (\widehat{u'^2_i}|_{x'=-3\chi} - \widehat{u'^2_i}|_{x'=3\chi} ) \,\mathrm{d}z. \end{equation}
Here, the depth from which we compute the integration is set to  $D=-2k_0^{-1}$. This depth captures most of the regions influenced by the wave, as shown in figures 7, 8 and 11. The normalised integrated changes in the Reynolds normal stresses for cases
 ${W}_{12}$,
 ${W}_{09}$ and
 ${W}_{06}$ are listed in table 2. The increase in the integrated Reynolds normal stress exhibits consistent behaviour as discussed above, i.e. the relative increase in the vertical fluctuations is the largest among the three velocity components. Also listed in table 2 is the relative change normalised by
 $\alpha ^2$. The normalisation significantly reduces the difference in the enhancement ratio among the cases. The results indicate that the leading-order wave effect on the turbulence enhancement, particularly the enhancement of spanwise and vertical turbulence kinetic energy, is proportional to
 $\alpha ^2$.
Relative changes in the Reynolds normal stresses integrated from  $k_0 z=-2.0$ to the surface after the passage of the wave packet for the streamwise component
 $\mathcal {E}_u=\Delta E_u/E_u\vert_{x'=3\chi }$, spanwise component
 $\mathcal {E}_v = \Delta E_v/E_v\vert_{x'=3\chi }$ and vertical component
 $\mathcal {E}_w = \Delta E_w/E_w\vert_{x'=3\chi }$.

It can also be observed from figures 9 and 10 that the most significant changes in  $\widehat {u'^2_i}$ occur approximately between
 $x'=\chi$ and
 $x'=-\chi$, especially for
 $\widehat {v'^2}$ and
 $\widehat {w'^2}$, indicating that the direct effect of the wave forcing on turbulence is most active around the core of the wave packet. Notably, this range (
 $-\chi < x' <\chi$) corresponds to only a small number of wave periods. With the bandwidth parameter
 $\epsilon =(k_0\chi )^{-1}=0.13$ (see § 2.2),
 $\chi$ is approximately equal to
 $1.22\lambda$ with
 $\lambda$ being the wavelength of the carrier wave. Since the group speed of the wave packet is twice the phase speed of the carrier wave, the time that the wave envelope takes to propagate for a width of
 $2\chi$ is approximately five wave periods. Compared with the large-eddy turnover time of the turbulence boundary layer, which is
 $O(H/u_*)$, this duration is only
 $0.0033 H/u_*$, indicating that the wave packet acts on turbulence for a significantly shorter time than the characteristic time scale of large eddies. We note again that during this relatively short period, the vertical fluctuations are enhanced by as much as
 $45\,\%$ (figure 8c). This result indicates that a passing wave packet can rapidly exert a substantial impact on the turbulence underneath.
In the present study, we simulate the changes to a fully developed surface shear-driven turbulence boundary layer impacted by an incoming wave packet. This idealised set-up is designed to reveal the unsteady evolution of turbulence that is initially in an equilibrium state but without wave effects, i.e. not Langmuir turbulence. Previous studies on the unsteady turbulence–wave interactions were based on different set-ups, such as the modification of isotropic turbulence (Teixeira & Belcher Reference Teixeira and Belcher2002; Smeltzer et al. Reference Smeltzer, Rømcke, Hearst and Ellingsen2023) and the co-development of the turbulence and waves under wind shear (Melville et al. Reference Melville, Shear and Veron1998; Veron & Melville Reference Veron and Melville2001; Tejada-Martínez et al. Reference Tejada-Martínez, Hafsi, Akan, Juha and Veron2020). Therefore, exact quantitative agreement with existing studies is not anticipated. However, we find that our results share similar characteristics with the previous research, with some statistics aligning within the same order of magnitude as earlier predictions or observations. First, we compare our results with the theoretical prediction of the changes in isotropic turbulence by a constant-amplitude progressive wave train obtained by Teixeira & Belcher (Reference Teixeira and Belcher2002). Using the rapid distortion theory, Teixeira & Belcher (Reference Teixeira and Belcher2002) showed that the vertical component of the Reynolds normal stresses can be enhanced three times after ten wave periods for a wave train with wave steepness  $\alpha =0.2$. The exact rate of increase was not provided, but an estimation can be made based on figure 7 in Teixeira & Belcher (Reference Teixeira and Belcher2002), which indicates that the change is approximately linear with time. Therefore, we estimate the increase in the vertical Reynolds normal stress to be
 $1.5$ after five wave periods. Since the relative change is proportional to
 $\alpha ^2$, the prediction given by the rapid distortion theory, when scaled to match our
 ${W}_{12}$ with
 $\alpha =0.12$, roughly corresponds to a
 $54\,\%$ increase. This estimated increase rate aligns with our simulation data, which show an increase of
 $45\,\%$. This comparison suggests that the rapid distortion theory may capture the leading-order effect during the initial stage of the turbulence–wave interaction. However, we note that there still exist some differences between the predictions obtained via rapid distortion theory and our results. Although the streamwise velocity fluctuation intensity is the least influenced among the three velocity components, the theory predicts that the streamwise fluctuations weaken as the wave propagates. This prediction is in contrast to our results, where the streamwise velocity fluctuations still exhibit a minor increase. This difference is likely because the flow in the present set-up with a wind shear-driven turbulent flow and a transient wave packet is different from the isotropic turbulence interacting with a monochromatic wave studied by Teixeira & Belcher (Reference Teixeira and Belcher2002). Savelyev, Maxeiner & Chalikov (Reference Savelyev, Maxeiner and Chalikov2012) investigated the turbulence evolution under the influence of a passing wave packet using wave tank experiments and large-eddy simulations. They observed an increase in the surface kinetic energy, i.e. the streamwise and spanwise velocity fluctuations. The surface spanwise velocity fluctuations were found to grow faster than the streamwise component, as shown in their figure 5, which aligns with our simulation data where
 $\widehat {v'^2}$ is more enhanced than
 $\widehat {u'^2}$. Interestingly, they also noted that the surface streamwise velocity fluctuations can either increase or decrease, and they attributed these behaviours to the difference in the initial turbulence conditions. This result supports our conjecture that pre-existing turbulence can influence the outcomes of turbulence–wave interactions.
4.3. Spectra of the turbulence fluctuations
In this section, to elucidate the contributions to the change in the Reynolds normal stress from different length scales, the spectra of the turbulence velocity fluctuations are analysed. Specifically, we focus on the change in the spectra before and after the passage of the wave packet to understand how surface waves influence turbulence structures at various scales. Here we analyse the energy spectra with respect to spanwise scales considering that  $y$ is the homogeneous direction. The spectra at spanwise wavenumbers
 $k_y$ can be computed as
 $\varPhi _i(x, k_y, z) = U^*_i U_i$, where
 $U_i$ denotes the Fourier coefficients of turbulence velocity fluctuations
 $u'_i$ and
 $U^*_i$ denotes its complex conjugate. Hereafter, we use case
 ${W}_{12}$ as the representative case for discussions about the length scales of turbulence structures influenced by the wave packet because the affected length scales are similar among various cases.
We first look at the spectra of the most impacted velocity component,  $w'$. Figure 12(a,b) shows the pre-multiplied spectra of
 $w'$ as functions of
 $\lambda _y/H$ and
 $k_0 z$ at the leading edge (
 $x'=3\chi$) and the trailing edge (
 $x'=-3\chi$) of the wave packet. The pre-multiplied spectrum
 $k_y\varPhi _w$ accounts for the logarithmic scale used in the plots and represents the energy density per logarithmic wavenumber, i.e. per
 $\log {k_y}$, or equivalently, per
 $\log {\lambda _y}$. After the wave packet passes, the peak in the energy density shifts closer to the surface, indicating a significant near-surface enhancement that changes the depth where the maximum
 $\widehat {w'^2}$ occurs, consistent with the behaviour of
 $\widehat {w'^2}$ described earlier (figure 7c). Furthermore, the energy spectra indicate that
 $w'$ becomes dominated by smaller-scale fluctuations. In figure 12(c), the ratio of the spectra after and before the wave packet passage is plotted to directly quantify the enhancement at different scales and depths. These results confirm that near the surface, the enhancement effect is the strongest for small-scale structures. The enhancement of small-scale vertical fluctuations can also be observed in the supplementary movie, which shows that the regions of positive and negative
 $w'$, intensified after the wave packet passes, mostly exhibit narrow spanwise length scales. While the intensification of near-surface small-scale
 $w'$ structures is the most prominent, the near-surface effect extends over at least a decade of spanwise scales, reaching up to
 $\lambda _y \sim H$. This result suggests that the wave packet can affect turbulence structures with large spanwise length scales comparable to the boundary layer depth. Additionally, as one moves away from the surface, the most amplified scales become increasingly larger, supporting the conjecture in § 4.2 that the deep impact of the wave packet on
 $w'$ is related to larger-scale structures.
Pre-multiplied energy spectrum of vertical velocity fluctuations  $w'$ with respect to the spanwise wavelength
 $\lambda _y$ at (a) the leading edge (
 $x'=3\chi$) and (b) the trailing edge (
 $x'=-3\chi$) of the wave packet. (c) The ratio between the spectra at the trailing edge and the leading edge. Case
 ${W}_{12}$ is plotted.

Figure 13 shows the pre-multiplied spectra of the spanwise velocity fluctuations  $v'$. Similar to the vertical velocity fluctuations, the spanwise velocity fluctuations are enhanced near the surface across a wide range of scales, as evidenced by figure 13(c). Close to the surface (approximately above
 $k_0 z > -0.3$), the most enhanced scale near the surface is found around
 $\lambda _y \sim 0.2 H$, which is slightly larger than that for
 $w'$. The influence extends to large-scale motions with
 $\lambda _y\sim H$ but is more localised near the surface than is
 $w'$. Slightly away from the surface (at
 $k_0 z = -0.5$), an enhancement at smaller scales can be observed. The overall enhancement effect on
 $v'$ at different scales is weaker than that on
 $w'$, consistent with the observations of
 $\widehat {v'^2}$ in § 4.2.
Pre-multiplied spectrum of spanwise velocity fluctuations  $v'$ with respect to the spanwise wavelength
 $\lambda _y$ at (a) the leading edge (
 $x'=3\chi$) and (b) the trailing edge (
 $x'=-3\chi$) of the wave packet. (c) The ratio between the spectra at the trailing edge and the leading edge. Case
 ${W}_{12}$ is shown.

Figure 14 shows the pre-multiplied energy spectra of the streamwise velocity fluctuations  $u'$. In the near-surface region, characteristic double peaks occur, which is associated with the separation of large-scale motions from smaller-scale turbulence motions near the boundary in high-Reynolds-number flows (Hutchins & Marusic Reference Hutchins and Marusic2007). Consistent with the earlier findings in § 4.2 that
 $\widehat {u'^2}$ experiences the least impact from the wave packet among the three velocity components, the pre-multiplied spectra shown in figure 14 demonstrate that most scales are only slightly affected. The observed enhancement in
 $\widehat {u'^2}$ is mostly attributed to small-to-mid scales
 $\lambda _y < 0.3h$. Additionally, we can observe weak yet distinct enhancement at large spanwise scales
 $\lambda _y \sim H$. This result further supports that the wave packet can affect large-scale turbulent coherent structures.
Pre-multiplied spectrum of streamwise velocity fluctuations  $u'$ with respect to the spanwise wavelength
 $\lambda _y$ at (a) the leading edge (
 $x'=3\chi$) and (b) the trailing edge (
 $x'=-3\chi$) of the wave packet. (c) The ratio between the spectra at the trailing edge and the leading edge. Case
 ${W}_{12}$ is shown.

In summary, the passage of a wave packet is found to induce considerable changes in turbulence, intensifying turbulence fluctuations in all three velocity components, which suggests the transfer of energy from the wave to turbulence. The wave impact on the three velocity components follows the order  $w' > v' > u'$, in terms of both the enhancement magnitude and the depth of influence. This observation aligns with our findings for the enstrophy components, where the streamwise vorticity fluctuations experience the most significant enhancement, correlating with the intensification of
 $w'$ and
 $v'$. We also find that the enhancement of vertical and spanwise Reynolds normal stresses
 $\widehat {u'^2_i}$ is approximately proportional to the square of the wave steepness
 $\alpha ^2$. Furthermore, we find that the variation in the Reynolds normal stresses occurs rapidly within approximately five wave periods in the cases considered. Spectral analysis reveals that the wave packet enhances the near-surface vertical velocity fluctuations at small scales. We note that the appearance of small-scale near-surface streamwise vortices and the associated spanwise alternating vertical velocity fluctuations were observed in laboratory experiments (Melville et al. Reference Melville, Shear and Veron1998; Veron & Melville Reference Veron and Melville2001) and numerical simulations (Li & Garrett Reference Li and Garrett1993; Tejada-Martínez et al. Reference Tejada-Martínez, Hafsi, Akan, Juha and Veron2020) of an initially quiescent flow after the wind started to blow on the surface. The subsequent growth and merging of vortices were considered related to the spin-up and formation of larger-scale Langmuir circulations. In addition to small-scale structures, the present results suggest that surface waves can influence coherent structures at larger scales too. For example, for vertical velocity fluctuations, medium scales rather than small scales are enhanced away from the surface. Moreover, we observe structures with a spanwise scale
 $\lambda _y \sim h$ in the energy spectra, implying that the wave packet may trigger the generation of large-scale structures. These observations suggest that existing turbulent coherent structures in turbulent flows may be modified by waves. Since the enhanced length scales vary by the velocity components and depth, the underlying mechanisms at different length scales are likely to be different and therefore are analysed next in § 5.
5. Mechanisms of the variations in the Reynolds normal stresses at various length scales
To further understand the turbulence–wave interaction induced by a wave packet, in this section, we analyse the evolution equations of the spectra of the Reynolds normal stresses to identify the dominant mechanisms for their variations at different length scales. The evolution equation for the spanwise spectra of turbulence velocity fluctuations  $\varPhi _i(k_y)$ in the packet-following frame is given by
 \begin{equation} \frac{\partial \hat{\varPhi}_i}{\partial t} - c_g \frac{\partial \hat{\varPhi}_i}{\partial x} = P^w_{i} + P^r_{i} + {\varPi^s}_{i} + T^p_{i} + T^t_{i} + A_i + \mathcal{V}_{i}.\end{equation}
The derivation of the spectral evolution equation is detailed in Appendix D. Since the Reynolds normal stresses in the packet-following frame are quasi-steady, the unsteady term on the left-hand side of the above equation is approximately zero. Therefore, the left-hand side is primarily an advection term, which arises from evaluating the equation in a frame translating with the group velocity of the wave packet,  $c_g$. In other words, the advection term on the left-hand side represents the change rate of the velocity spectra along the wave packet. The right-hand-side terms represent the different mechanisms contributing to the change in the velocity spectra, including the wave-induced production
 $P^w$, the current-induced production
 $P^r$, the inter-scale transfer due to the pressure–strain term
 $\varPi ^s$, the pressure diffusion
 $T^p$, the turbulence diffusion
 $T^t$, the advection due to wave and rotational motions
 $A_i$ and the viscous and subgrid-scale effects
 $\mathcal {V}$. Before encountering the wave packet, the turbulent flow is in a homogeneous quasi-steady state, where both
 $\partial \hat {\varPhi }/\partial t$ and the advection
 $c_g \partial \hat {\varPhi }_i/\partial x$ on the left-hand side of (5.1) are approximately zero, with the right-hand-side terms in balance. As the wave packet passes, the right-hand-side terms in (5.1) deviate from the equilibrium state, leading to the changes in the spectra along the wave packet, which corresponds to a non-zero
 $c_g \partial \hat {\varPhi }_i/\partial x$ term on the left-hand side. To identify the wave-packet-induced changes in these terms, their differences from their values at the leading edge of the wave packet (
 $x'=3\chi$) are computed, denoted by a prefix
 $\Delta$, e.g.
 $\Delta P^w$. The magnitudes of the wave-induced production
 $\Delta P^w$, the inter-scale transfer due to the pressure–strain term
 $\Delta \varPi ^s$, the pressure diffusion
 $\Delta T^p$ and the advection
 $\Delta A_i$ are found to be dominant. The remaining terms,
 $\Delta P^r$,
 $\Delta T^t$ and
 $\Delta \mathcal {V}$, are two orders of magnitude smaller than the aforementioned terms. Further validation shows that the error between the sum of
 $\Delta P^w$,
 $\Delta \varPi ^s$,
 $\Delta T^p$ and
 $\Delta A_i$ and the left-hand-side terms is within
 $3\,\%$, confirming that these terms represent the dominant mechanisms responsible for the observed changes in turbulence fluctuations at different scales.
Figure 15 shows the pre-multiplied spectra of  $\Delta P^w$,
 $\Delta \varPi ^s$,
 $\Delta T^p$ and
 $\Delta A$ at the core of the wave packet (
 $x'=0$) for the vertical velocity component. Here, because we primarily focus on the underlying mechanisms, which are essentially the same for the cases considered, we use case
 ${W}_{12}$ for discussions. The characteristics of these terms at
 $x'=0$ can reflect the energy gains and losses at different scales during the rapid amplification of
 $w'$ within the range
 $-\chi < x' <\chi$ (see figure 10), which is also the region where most of the changes in
 $w'$ occur. As shown in figure 15(a), the wave-induced production
 $\Delta P^w$ is positive near the water surface, confirming that the energy transfers from the wave to turbulence. This energy transfer occurs across nearly all scales, reaching its maximum at small scales, which indicates that most of the wave-induced turbulence energy production goes towards small-scale vertical velocity fluctuations. The pressure–strain effect
 $\Delta \varPi ^s$ (figure 15b) is negative near the surface but positive away from it. The negative
 $\Delta \varPi ^s$ may be related to the ‘splat’ phenomenon Mansour, Kim & Moin Reference Mansour, Kim and Moin1988; Perot & Moin Reference Perot and Moin1995; Shen et al. Reference Shen, Zhang, Yue and Triantafyllou1999, in which the vertical velocity fluctuations are suppressed due to the kinematic constraints imposed by the free-surface boundary condition (2.12). Consequently, energy is transferred from the vertical velocity component to surface-parallel components. This inter-component transfer is most pronounced at small scales. As shown in figure 12, the near-surface vertical fluctuations
 $w'$ are enhanced significantly at these scales, which in turn promotes energy transfer towards the horizontal components through the ‘splat’ events. On the other hand, the positive
 $\Delta \varPi ^s$ away from the surface indicates an energy transfer from
 $u'$ and
 $v'$ to
 $w'$. The positive
 $\Delta \varPi ^s$ is observed to concentrate at medium scales (approximately
 $\lambda _y \sim 0.2H$) at
 $k_0 z \approx -0.3$ and extends towards larger scales with increasing depth, reaching up to
 $\lambda _y \sim H$.
Pre-multiplied spectra of the dominant terms in the spectral evolution equation of the vertical velocity fluctuations  $w'$: (a) wave-induced production term
 $\Delta P^w$, (b) pressure–strain term
 $\Delta \varPi ^s$, (c) pressure diffusion term
 $\Delta T^p$ and (d) advection term
 $\Delta A$. These terms are evaluated at the core of the wave packet
 $x'=0$ for case
 ${W}_{12}$ and are normalised by
 $\alpha u_*^2 \omega _0$.

The pressure diffusion term is shown in figure 15(c). In the spectral evolution equation for the vertical velocity fluctuations, the pressure diffusion term  $T^p$ is derived from the spectrum of
 $- \langle {\partial (\mathring {w}' p')}/{\partial z} + {\partial (w'_i \mathring {p}')}/{\partial \mathring {z}} \rangle / \rho$ (see (D4)), where the symbol
 $\mathring{(\cdot )}$ denotes a variable separated by a distance in the spanwise direction. In other words, the pressure diffusion
 $T^p$ arises from the vertical divergence of the flux of the spatial correlation between
 $w'$ and
 $p'$. Therefore, the pressure diffusion here represents the energy gain or loss due to the vertical flux related to pressure fluctuations. As shown in figure 15(c), the negative region between
 $k_0 z = -0.2$ and
 $k_0 z=-0.4$ indicates that the pressure diffusion acts as an energy sink in this region. The removed energy is fluxed upward and downward, where
 $T^p$ turns positive. The downward transport enhances
 $w'$ in deeper regions, with the enhanced scales increasing with depth.
Figure 15(d) shows the advection effect  $\Delta A$, which can be driven by both the wave motions
 $\boldsymbol {u}_\phi$ and the mean rotational flow
 $\langle \boldsymbol {u} \rangle$ (see the last term in (D2)). By evaluating different contributions (not plotted separately here), we find that the observed advection effect can be mostly attributed to the term related to vertical wave velocity
 $w_\phi$. We note that the wave orbital velocity alternates signs depending on the wave phase and its average in the packet-following frame,
 $\hat {w}_\phi$, is zero. Therefore, the presence of the advection effect indicates that the turbulence statistics are correlated with the wave motion or the wave phase. It is the imbalance between the fluxes during upward wave motions (
 $w_\phi > 0$) and downward motions (
 $w_\phi <0$) that leads to the net effect in this advection term. This result indicates that the wave-phase-correlated dynamics can influence the turbulence–wave interactions. The overall advection effect contributes to energy transport from both above and beneath towards the region near
 $k_0 z=-0.3$. It should be noted that the advection effect, although weak, remains acting as an energy sink below
 $k_0 z<-0.4$ at large scales (
 $\lambda _y \sim H$) and extends further below
 $k_0 z =-1.0$. At these large scales, the wave advection removes energy from a broader region at a low rate and enhances the region around
 $k_0 z=-0.3$. Compared with other factors, advection plays a less important role in the characteristic changes in
 $w'$.
Overall, the above analysis indicates that the enhancement of  $w'$ is due to the interplay of multiple mechanisms. Specifically, wave-induced production directly contributes to the increase in
 $w'$ near the surface, particularly for small-scale vertical velocity fluctuations. Meanwhile, in the region slightly away from the surface (
 $k_0 z<-0.3$),
 $w'$ gains energy from
 $u'$ and
 $v'$ due to the pressure–strain effect. The energy is then moved vertically through the pressure diffusion mechanism, ultimately contributing to
 $w'$ in the surface and deeper regions. We also note that these terms are still active at larger scales, indicating that existing large-scale coherent structures can also be amplified through interactions with the wave packet.
Figure 16 shows the dominant contributors to the spanwise velocity spectra evolution, including the pressure–strain effect  $\Delta \varPi ^s$ and the advection effect
 $\Delta A$. Because the wave motions
 $\boldsymbol {u}_\phi$ are in the
 $x$ and
 $z$ directions, the wave straining does not contribute to the spanwise velocity fluctuations directly through the production mechanism (see Appendix D). Furthermore, pressure diffusion does not influence the spectra, with
 $y$ being the homogeneous direction. As shown in figure 16(a), the pressure–strain effect is positive for small-scale motions close to the surface, coinciding with the negative
 $\Delta \varPi ^s$ region for
 $w'$ (figure 15b), which indicates that ‘splats’ transfer energy from
 $w'$ to
 $v'$. Slightly away from the surface,
 $\Delta \varPi ^s$ is negative and mostly coincides with the positive
 $\Delta \varPi ^s$ region for
 $w'$, indicating that in this region the inter-component energy transfer mostly occurs between
 $v'$ and
 $w'$. Figure 16(b) indicates that the advection effect transports the energy away from the surface. Similar to the dynamics of
 $w'$ spectra, we find that the observed
 $\Delta A$ for the
 $v'$ spectra evolution is mostly due to the advection by the vertical wave orbital velocity
 $w_\phi$ and therefore is driven by the phase dependency of turbulence–wave interactions, i.e. the imbalance of the vertical fluxes between when
 $w_\phi > 0$ and when
 $w_\phi < 0$. Clearly, the source of the vertical velocity fluctuation intensification is the inter-component energy transfer through the pressure–strain term, which mostly comes from vertical velocity fluctuations, whereas the advection effect moves the energy away from the surface and results in the observed increase in the small-scale spanwise velocity fluctuations at around
 $k_0 z = -0.5$ and the medium-scale (
 $\lambda _y \sim 0.2 H$) fluctuations near the surface (see figure 13).
Pre-multiplied spectra of the dominant terms in the spectral evolution equation of the spanwise velocity fluctuations  $v'$: (a) pressure–strain term
 $\Delta \varPi ^s$ and (b) advection term
 $\Delta A$. These terms are evaluated at the core of the wave packet
 $x'=0$ for case
 ${W}_{12}$ and are normalised by
 $\alpha u_*^2 \omega _0$.

Regarding the evolution of the streamwise velocity spectra, the dominant mechanisms, including the wave-induced production  $\Delta P^w$, the pressure–strain effect
 $\Delta \varPi ^s$, the pressure diffusion effect
 $\Delta T^p$ and the advection effect
 $\Delta A$, are plotted in figure 17. As shown in figure 17(a), the wave-induced production
 $\Delta P^w$ is positive across a wide range of scales. However, the production is largely offset by the negative advection effect
 $\Delta A$ (figure 17d). Figure 17(b) indicates that the pressure–strain effect transfers energy from
 $w'$ to
 $u'$ near the surface (see also figure 15b) and transfers from
 $u'$ to
 $w'$ in a deeper region near
 $k_0 z = -0.3$. The pressure diffusion term, which represents the transport of the spectra in the streamwise direction by pressure, has a negligible effect. Regarding the overall evolution of the streamwise velocity spectra, we find that the production effect slightly outweighs the advection effect. As a result, the combined effect of
 $\Delta P^w$ and
 $\Delta A$ is weakly positive, consistent with the finding in § 4 that streamwise velocity fluctuations experience only a slight influence from the wave packet. We note that at large scale
 $\lambda _y \sim H$, the positive
 $\Delta \varPi ^s$, indicating a transfer of energy from the wave packet, is consistent with the observed enhancement at this scale (figure 14c). The negative pressure–strain term, representing an inter-component energy transfer to
 $w'$, hinders the amplification of
 $u'$ at smaller scales.
Pre-multiplied spectra of the dominant terms in the spectral evolution equation of the streamwise velocity fluctuations  $u'$: (a) wave-induced production term
 $\Delta P^w$, (b) pressure–strain term
 $\Delta \varPi ^s$, (c) pressure diffusion term
 $\Delta T^p$ and (d) advection term
 $\Delta A$. These terms are evaluated at the core of the wave packet
 $x'=0$ for case
 ${W}_{12}$ and are normalised by
 $\alpha u_*^2 \omega _0$.

In summary, we find that the wave-packet-induced changes in the energy spectra are primarily driven by the wave-induced production, pressure–strain effect, pressure diffusion and wave advection. The wave-induced production signifies the transfer of energy from the wave packet to turbulence, intensifying near-surface small-scale vertical velocity fluctuations. Due to the offset effect of wave advection, the wave transfers less energy to the streamwise velocity fluctuations. This behaviour deviates significantly from shear-induced energy transfer from the mean flow to turbulence, where the streamwise velocity fluctuations, rather than the vertical velocity fluctuations, gain energy. The energy transfer to the vertical velocity component aligns more closely with the budget of the Reynolds stresses in Langmuir turbulence. The Reynolds stress transport equations derived from the CL formulation show the presence of wave-induced production, modelled using the Stokes drift in the vertical component, acting as the dominant energy source for the vertical velocity fluctuations (see e.g. Harcourt Reference Harcourt2013; Deng et al. Reference Deng, Yang, Xuan and Shen2019; Pearson, Grant & Polton Reference Pearson, Grant and Polton2019). However, the observed weaker yet still discernible energy transfer from the wave packet to the streamwise velocity fluctuations suggests that the CL formulation may not fully capture the full dynamics of the present problem.
The effects related to turbulence pressure fluctuations, including the pressure–strain term and the pressure diffusion term, play an important role in enhancing the vertical velocity fluctuations at medium–large scales away from the surface. The pressure–strain term also acts as an energy source for spanwise velocity fluctuations by transferring energy from the vertical component. Notably, the characteristics of the inter-component energy are also significantly different from those observed in shear-driven turbulent flows, such as channel flows. In the latter case, the pressure–strain term primarily redistributes energy from  $u'$ to the other two components (see e.g. Lee & Moser Reference Lee and Moser2019). However, here we observe energy exchanges between
 $w'$ and the other two components and, interestingly, the transfer occurs in both directions depending on the depth. This indicates that the wave packet passage significantly alters the dynamics underlying the pressure–strain term. While some phenomena, such as the strong near-surface transfer from
 $w'$ to
 $v'$ and
 $u'$, may be partially related to changes in the velocity fluctuation intensity, accounting for the changes in pressure fluctuations induced by the wave packet is also crucial (Pearson et al. Reference Pearson, Grant and Polton2019).
6. Conclusions and discussion
In this study, we have investigated the evolution of turbulence in response to a passing wave packet to elucidate the key processes occurring in the transient wave-induced modification of turbulence. The influence of the wave packet on turbulence is quantitatively examined through analyses of the enstrophy components, Reynolds normal stresses and their spectra. The mechanisms of the Reynolds normal stress variation at different scales are identified by analysing the evolution equations of the energy spectra. We also developed a novel simulation methodology that can efficiently couple turbulence simulation with the phase-resolved wave field. To our knowledge, this approach is the first simulation method for turbulence–wave interaction allowing for resolving wave phases within a rectangular computational domain.
The proposed simulation method for simulating turbulence under waves utilises a Helmholtz decomposition-based approach, which represents the waves and turbulence by the irrotational and rotational parts of the decomposition, respectively. The effect of wave orbital motions on turbulence is represented by terms directly derived from the decomposition of the Navier–Stokes equations (2.5), which faithfully capture the phase-resolved wave effect on the flow. To reduce the computational cost, the turbulence simulation utilises an approximated surface boundary condition. This approach employs Taylor expansion to express the exact boundary conditions on the wave surface using flow quantities at the mean plane of the wave surface. Such boundary condition treatment facilitates the flow simulation in a rectangular Cartesian domain and avoids solving for the flow field in a wave-boundary-fitted domain, which typically requires a non-Cartesian grid that is more computationally expensive than a Cartesian grid. The proposed method is validated by comparing the simulation result of Langmuir turbulence under a monochromatic wave train with that obtained by the boundary-fitted-grid method and the parametrisation from the literature. The turbulence statistics obtained by the two numerical methods are in agreement, affirming the effectiveness of the proposed method in capturing phase-resolved turbulence–wave interactions with reasonably good accuracy. Because the Taylor-series-based approximation primarily depends on the surface wave steepness, the proposed boundary condition is suitable for applications to more complex wave fields with multiple wave components. The simulations of the turbulence interacting with a wave packet further demonstrate the ability of the present method to handle a more complex wave field than the monochromatic wave often considered in the literature. Therefore, we believe that the proposed method addresses a major challenge of existing phase-resolved turbulence–wave simulations using boundary-fitted grids, namely the computational cost, and achieves a good balance between accuracy and simulation efficiency. As the waves are simulated using the HOS method, which is capable of simulating the evolution of complex nonlinear wave fields, the proposed method can be readily applied in future research to investigate the ocean surface boundary layer under realistic wave fields, such as those with broadband wind-waves and swells. We note that the proposed model currently considers only the non-breaking wave effects, whereas the wave breaking can significantly affect the underlying turbulence as well (Drennan et al. Reference Drennan, Donelan, Terray and Katsaros1996; Terray et al. Reference Terray, Donelan, Agrawal, Drennan, Kahma, Williams, Hwang and Kitaigorodskii1996; Sutherland & Melville Reference Sutherland and Melville2015). Future work can extend this model to include wave breaking effects by incorporating stochastic wave breakers (Sullivan, McWilliams & Melville Reference Sullivan, McWilliams and Melville2007).
Our simulations of turbulence under a passing wave packet consider the scenario where the wave packet travels at a group speed significantly faster than the mean turbulent current (see § 2.2). The characteristic time scale of the wave packet, based on the straining rate of the carrier wave  ${(a_0 k_0^2 c_0)}^{-1}$, is also considerably shorter than the large-eddy turnover time of the turbulence
 $H/u_*$ (see also § 2.2). Our results demonstrate that within a short period acting on turbulence, the wave packet induces substantial and rapid changes in the turbulence. The turbulence statistics exhibit a strong dependence on the relative location to the wave packet, indicating a dynamic turbulence evolution as the wave packet passes. This interaction ultimately leads to modifications in the turbulence characteristics after the wave packet passes. We observe significantly amplified streamwise vorticity fluctuations after the wave packet passes, while the spanwise and vertical components of the enstrophy exhibit smaller increases. This result indicates a preferential enhancement of streamwise vortices by the wave packet. Regarding the Reynolds normal stresses, we observe that the three components of turbulence velocity fluctuations are enhanced to different extents, with a relative increase
 $w' > v' > u'$. Notably, the vertical Reynolds normal stress increases by
 $45\,\%$ for a wave packet with steepness
 $\alpha =0.12$ while the streamwise Reynolds normal stress changes by less than
 $10\,\%$. Moreover, the strong influence of the wave packet on the vertical velocity fluctuations
 $w'$ is not only reflected in the magnitude of its increase but also extends deeper into the water column than the streamwise and spanwise components. The analysis of the energy spectra further reveals that the enhancement can be observed for coherent structures across a wide range of scales. In particular, small-scale vertical velocity fluctuations near the surface are the most enhanced. Moreover, the enhancement of larger-scale structures can be observed for all three velocity components, and the largest spanwise scale exhibiting amplification is comparable with the boundary layer depth.
By analysing the evolution equations of the energy spectra of different velocity components, we attribute the enhancement of small-scale vertical velocity fluctuations close to the surface to both the energy transfer from the wave to turbulence and the energy transport by pressure fluctuations. The enhancement away from the surface can be primarily attributed to the pressure effects, including both the energy gain from the inter-component energy redistribution and the downward pressure transport that moves energy into deeper regions. The peaks in the pre-multiplied spectra of pressure-related terms are not limited to small scales, leading to enhancement of medium- to large-scale vertical velocity fluctuations away from the surface as well. The spanwise velocity fluctuations are enhanced by the pressure–strain effect transferring energy between  $w'$ and
 $v'$. The wave advection effect term transports energy in spanwise turbulence fluctuations from the near-surface region to a deeper region. Regarding the streamwise Reynolds normal stress, the wave-induced production effect and wave advection effect, which are directly associated with the wave orbital motions, roughly cancel each other. As a result, the streamwise velocity fluctuations are only weakly influenced by the wave packet at most scales. However, the excess energy transfer from the wave packet can induce the amplification of streamwise velocity fluctuations at large scales with
 $\lambda _y \sim H$.
The findings from the present study of fully developed shear-driven turbulence interacting with a transient surface wave packet exhibit some similarities to more idealised scenarios, including Langmuir turbulence or isotropic turbulence interacting with a monochromatic wave train. Notably, the predominant increase in streamwise enstrophy observed in the present study is also found in monochromatic wave cases, where wave straining enhances streamwise vortices by tilting vertical vortices but barely changes the vertical vorticity strength (Teixeira & Belcher Reference Teixeira and Belcher2002; Xuan et al. Reference Xuan, Deng and Shen2019). This result also aligns with the prediction of the CL theory that waves primarily affect the streamwise vorticity because the Stokes drift, which represents the wave effect, appears only in the streamwise vorticity equation (Leibovich Reference Leibovich1980). Regarding the Reynolds normal stresses, after the wave packet passage, the vertical velocity fluctuations are the most enhanced, while the streamwise fluctuations are least affected. This result suggests that the shear-driven boundary layer begins developing features of a wave-driven turbulent flow, i.e. Langmuir turbulence, where the vertical velocity fluctuations become stronger than streamwise velocity fluctuations.
While these results suggest similar turbulence–wave interaction mechanisms across different turbulence and wave conditions, notable differences from the monochromatic wave cases still exist. As described earlier, vorticity analysis based on Langmuir turbulence under a monochromatic wave indicates that wave straining does not enhance the vertical vorticity. However, unlike Langmuir turbulence under a uniform wave train, a weak increase in vertical enstrophy is observed in the present simulation with a wave packet. Additionally, rapid distortion theory predicts the suppression of streamwise velocity fluctuations in isotropic turbulence by waves (Teixeira & Belcher Reference Teixeira and Belcher2002), but the present simulation indicates that the streamwise Reynolds normal stress is slightly enhanced after the wave packet passage.
These differences may stem from several factors, which have important implications for capturing the full transient dynamics of turbulence evolution under a wave packet. The first factor is the presence of coherent structures in the shear-driven boundary layer. We observe that nearly all the terms contributing to the evolution of the energy spectra span a wide range of scales (figures 15–17), which indicates that a hierarchy of turbulent coherent structures dynamically interacts with the wave. This observation suggests that the assumption of isotropic turbulence in some of the previous theoretical studies may not be entirely valid for all affected structures. Therefore, the turbulence–wave interaction still depends on the specific characteristics of the turbulence and wave fields, warranting further investigation in future studies. Moreover, the results of the present study suggest contributions from medium- to large-scale structures to turbulence evolution, such as the generation of Langmuir circulations. For an initially quiescent flow, where no turbulence structures exist, small-scale turbulent structures are often observed to be generated and grow in size. Therefore, the inverse energy cascade related to the amplification and merging of small-scale vortices has been associated with the spin-up of Langmuir turbulence (Melville et al. Reference Melville, Shear and Veron1998; Veron & Melville Reference Veron and Melville2001; Tejada-Martínez et al. Reference Tejada-Martínez, Hafsi, Akan, Juha and Veron2020). However, in a realistic ocean boundary layer, various large-scale coherent turbulent structures may already be present. Although small-scale velocity fluctuations are the most influenced by the wave packet, the present findings suggest that the modification of turbulence velocity fluctuations at larger scales also leads to changes in turbulence characteristics, such as the enhancement of vertical velocity fluctuations away from the surface (figure 12c). This observation suggests a simultaneous evolution of large- and small-scale structures. Because the present study focuses only on the initial evolution of turbulence, it is not clear how turbulence structures at different scales evolve in the long term. This should be a subject for future research.
Furthermore, the inherent heterogeneity of the wave packet and the resulting turbulence variation were not considered in the aforementioned idealised scenarios in the literature. As discussed earlier, in our problem set-up, most of the changes in turbulence statistics occur around the core of the wave packet (figures 9 and 10), corresponding to only five carrier wave periods. This period is also significantly shorter than the characteristic time scale of turbulence. Despite the short duration that the wave packet acts on turbulence, there is a substantial change in turbulence, such as an increase of up to  $45\,\%$ in vertical velocity fluctuations. This rapid change, occurring at a time scale not significantly longer than the wave period, may affect the accuracy and validity of the traditional wave-phase-averaged modelling of turbulence–wave interactions, which assumes a slow evolution of turbulence compared with the wave period. This implies that the transient effect in turbulence–wave interactions in a non-equilibrium state may need to be considered for more accurate predictions of turbulence statistics. These discoveries of turbulence–wave interactions suggest that further research is needed to understand the evolution of turbulence under waves in a realistic oceanic environment with transient and heterogeneous wave fields and complex coherent turbulent structures.
Supplementary movie
Supplementary movie is available at https://10.1017/jfm.2024.724.
Acknowledgements
The authors gratefully acknowledge the anonymous referees for their valuable comments.
Funding
This work was supported by the Office of Naval Research.
Declaration of interests
The authors report no conflict of interest.
Appendix A. Formulation of Taylor expansions of the boundary conditions of  $\boldsymbol {u}$

The proposed approximate boundary conditions for the rotational velocity  $\boldsymbol {u}$ at the wave surface using quantities at the mean plane
 $z=0$ are detailed in this appendix. The boundary conditions for the shear stress balance (2.14a,b) are written as
 \begin{align} \tau^r_x & =-\frac{\rho\nu}{C_0 C_x} \left[ 2\eta_x\left(\frac{\partial u_1}{\partial x_1}-\frac{\partial u_3}{\partial x_3}\right)+\eta _y\left(\frac{\partial u_1}{\partial x_2}+\frac{\partial u_2}{\partial x_1}\right) \right. \nonumber\\ &\quad +\left.\left(\eta_x^2-1\right)\left(\frac{\partial u_3}{\partial x_1}+\frac{\partial u_1}{\partial x_3}\right)+\eta _x \eta _y \left(\frac{\partial u_2}{\partial x_3}+\frac{\partial u_3}{\partial x_2}\right)\right], \end{align}
 \begin{align} \tau^r_y & =-\frac{\rho\nu}{C_0 C_y} \left[2\eta_y\left(\frac{\partial u_2}{\partial x_2}-\frac{\partial u_3}{\partial x_3}\right)+\eta_x\left(\frac{\partial u_1}{\partial x_2}+\frac{\partial u_2}{\partial x_1}\right)\right. \nonumber\\ &\quad + \left.\left(\eta _y^2-1\right)\left(\frac{\partial u_2}{\partial x_3}+\frac{\partial u_3}{\partial x_2}\right)+\eta_x\eta _y\left(\frac{\partial u_1}{\partial x_3}+\frac{\partial u_3}{\partial x_1}\right)\right], \end{align}
where  $C_x={(1+\eta _x^2)}^{1/2}$ and
 $C_y={(1+\eta _y^2)}^{1/2}$. By applying the Taylor expansion (2.16) to (A1) and (A2), we can obtain the boundary conditions in terms of the values evaluated at
 $z=0$. We assume that
 $\eta _x$,
 $\eta _y$ and
 $\eta$ are of
 $O(\alpha )$ with
 $\alpha =a_0k_0$ being the steepness parameter (§ 2.2). By collecting the terms with the same order with respect to
 $\alpha$, we obtain the approximated dynamic boundary conditions truncated to a certain order. The kinematic boundary condition (2.12) is treated in a similar way.
The free-surface kinematic and dynamic boundary conditions approximated to  $O(1)$ at
 $z=0$ are
 $$\begin{gather} u_3 = 0 + O(\alpha), \end{gather}$$
 $$\begin{gather}\tau^r_x = \rho\nu \frac{\partial u_1}{\partial x_3}, \end{gather}$$
 $$\begin{gather}\tau^r_y = \rho\nu \frac{\partial u_2}{\partial x_3}. \end{gather}$$
We remark that the above boundary conditions essentially describe a flat surface, equivalent to the rigid-lid approximation adopted in the wave-phase-averaged framework, such as the CL formulation. By retaining the terms up to  $O(\alpha )$, we can obtain the following expressions for the truncated boundary conditions:
 \begin{gather} u_3 = \frac{\partial u_1 \eta}{\partial x_1} + \frac{\partial u_2 \eta}{\partial x_2},\end{gather}
 \begin{gather} \begin{aligned}\tau^r_x & = \rho\nu \left[\left(\frac{\partial u_3}{\partial x_1} + \frac{\partial u_1}{\partial x_3}\right) -2\eta_x\left(\frac{\partial u_1}{\partial x_1}-\frac{\partial u_3}{\partial x_3}\right) \right. \cr & \quad - \left.\eta _y\left(\frac{\partial u_1}{\partial x_2}+\frac{\partial u_2}{\partial x_1}\right) + \eta \left(\frac{\partial^2 u_3}{\partial x_3 \partial x_1} + \frac{\partial^2 u_1}{\partial^2 x_3}\right)\right], \end{aligned} \end{gather}
 \begin{gather} \begin{aligned}\tau^r_y & =\rho\nu \left[\left(\frac{\partial u_2}{\partial x_3}+\frac{\partial u_3}{\partial x_2}\right) -2\eta_y\left(\frac{\partial u_2}{\partial x_2}-\frac{\partial u_3}{\partial x_3}\right)\right. \cr &\quad - \left. \eta_x\left(\frac{\partial u_1}{\partial x_2}+\frac{\partial u_2}{\partial x_1}\right) +\eta \left(\frac{\partial^2 u_2}{\partial x_3^2}+\frac{\partial^2 u_3}{\partial x_3 \partial x_2}\right)\right], \end{aligned}\end{gather}
which are used for the simulations in the present study. We can see that, compared with the  $O(1)$ boundary conditions (A3)–(A5), i.e. the rigid-lid approximation, the boundary conditions we adopt, (A6)–(A8), include
 $\eta$ and its derivatives and thereby retain the effect of the varying boundary geometry (Xuan & Shen Reference Xuan and Shen2022).
Appendix B. Alternative formulation of the wave-phase-resolved rotational velocity governing equations
By invoking the vector identity on the wave coupling terms as follows:
 \begin{equation} \boldsymbol{u}\boldsymbol{\cdot}\boldsymbol{\nabla}\boldsymbol{u}_\phi + \boldsymbol{u}_\phi\boldsymbol{\cdot}\boldsymbol{\nabla}\boldsymbol{u} = \boldsymbol{\nabla}(\boldsymbol{u}\boldsymbol{\cdot}\boldsymbol{u}_\phi) -\boldsymbol{u}{\times}(\boldsymbol{\nabla}{\times}\boldsymbol{u}_\phi) -\boldsymbol{u}_\phi{\times}(\boldsymbol{\nabla}{\times}\boldsymbol{u}), \end{equation}
we can rewrite the momentum equations for the rotational part  $\boldsymbol {u}$ as
 \begin{equation} \frac{\partial \boldsymbol{u}}{\partial t} + (\boldsymbol{u}\boldsymbol{\cdot}\boldsymbol{\nabla})\boldsymbol{u} = \boldsymbol{u}_\phi\times\boldsymbol{\omega} -\boldsymbol{\nabla} \left(\frac{p}{\rho} + \boldsymbol{u}_\phi\boldsymbol{\cdot}\boldsymbol{u}\right) + \nu\boldsymbol{\nabla}^2 \boldsymbol{u} - \boldsymbol{\nabla}\boldsymbol{\cdot} \tau^{SGS}. \end{equation}
Here, the wave coupling terms are interpreted as two effects: one acts as a Bernoulli head in the form of  $\boldsymbol {\nabla }(\boldsymbol {u}_\phi \boldsymbol {\cdot } \boldsymbol {u})$, and the other is the cross product of the wave velocity and the vorticity
 $\boldsymbol {u}_\phi \times \boldsymbol {\omega }$. The latter term shows a resemblance to the vortex force term in the CL equation,
 $\boldsymbol {u}_s \times \boldsymbol {\omega }$. Taking the curl of the above equation yields the vorticity transport equation, in which the wave coupling term is expressed as
 $\boldsymbol {\nabla } \times (\boldsymbol {u}_\phi \times \boldsymbol {\omega })$. Utilising a multi-time-scale analysis, Craik & Leibovich (Reference Craik and Leibovich1976) and Leibovich (Reference Leibovich1977) showed that the time average of
 $\boldsymbol {\nabla } \times (\boldsymbol {u}_\phi \times \boldsymbol {\omega })$ can be modelled as
 \begin{equation} \boldsymbol{\nabla} \times \langle \boldsymbol{u}_\phi \times \boldsymbol{\omega} \rangle_w \approx \langle \boldsymbol{\omega} \rangle_w \boldsymbol{\cdot} \boldsymbol{\nabla} \boldsymbol{u}_s - \boldsymbol{u}_s \boldsymbol{\cdot} \boldsymbol{\nabla} \langle\boldsymbol{\omega}\rangle_w,\end{equation}
where  $\langle \cdot \rangle _w$ denotes an average over the wave period. Since the resulting equations concern only time-averaged motions, the time-average operator
 $\langle \cdot \rangle _w$ is effectively omitted. Equation (B3) leads to the vortex force term
 $\boldsymbol {u}_s \times \langle \boldsymbol {\omega } \rangle _w$ when returning to the momentum equation. In other words, the vortex force term in the CL formulation results from the time average of the wave coupling terms in the present method. By comparing the two formulations, we can see that the vortex force term in the CL formulation is closely related to the wave coupling terms in the present method. The difference lies in the fact that the CL model introduces a time average on the wave coupling terms through a multi-time-scale analysis, while the present method directly captures the wave effect in the phase-resolved wave field.
Appendix C. Validation of the numerical method
To validate the proposed numerical method, we use the present method to simulate Langmuir circulations under a monochromatic surface wave with a constant surface shear stress, and compare the results with the simulation conducted by Xuan et al. (Reference Xuan, Deng and Shen2020) using a curvilinear wave-boundary-fitted grid. We consider a case with a turbulent Langmuir number  ${La}_t = \sqrt {u_*/U_s} = 0.35$, where
 $U_s$ is the surface Stokes drift of the wave. The wavelength is set to
 $\lambda =4{\rm \pi} H/7$ and its steepness is set to
 $\alpha = 0.15$. The simulation using our proposed method is conducted in a domain with a size of
 $L_x \times L_y \times H = 16{\rm \pi} H/7 \times 16{\rm \pi} H/7 \times H$, the same as that of Xuan et al. (Reference Xuan, Deng and Shen2020) to capture the longest longitudinal structures. The grid size used is
 $N_x \times N_y \times N_z = 128 \times 128 \times 64$.
Figure 18 shows the mean Langmuir cell structures, obtained from the time- and streamwise-average of the turbulence velocity, denoted as  $\langle \boldsymbol {u}' \rangle _x$. The results from the present method and the wave-boundary-fitted-grid method indicate the presence of two pairs of counter-rotating streamwise rolls. The positive streamwise velocity
 $\langle u' \rangle _x$ indicates a jet in the convergence and downwelling regions, consistent with the feature of Langmuir circulations. These results confirm that the present method can capture Langmuir circulations.
Comparison of the Langmuir cell structures captured in the simulations by (a) the present method and (b) the wave-boundary-fitted-grid method. The cell structure is visualised by the vectors of the streamwise-averaged velocities  $(\langle v' \rangle _x, \langle w' \rangle _x)$. The contours represent the streamwise-averaged streamwise velocity fluctuation
 $\langle u' \rangle _x$.

The vertical profiles of the Reynolds normal stresses obtained by both methods are plotted in figure 19. To demonstrate the wave effect on turbulence, we also plot the Reynolds normal stresses in a fully developed turbulent flow that is driven only by the shear stress at a flat water surface without a wave. Both the present method and the boundary-fitted-grid method capture the characteristic features of Langmuir turbulence, i.e. intensified vertical and spanwise velocity fluctuations and suppressed streamwise velocity fluctuations relative to shear-only-driven turbulence. Moreover, the Reynolds normal stresses obtained by the present method are in good agreement with those of the boundary-fitted-grid simulation.
Comparison of the vertical profiles of the Reynolds normal stresses near the surface in Langmuir circulations simulated by the present method (——–) and the wave-boundary-fitted-grid method ( $\bullet$): (a)
 $\overline {u'^2}$, (b)
 $\overline {v'^2}$ and (c)
 $\overline {w'^2}$. For reference, the Reynolds normal stresses in a shear-driven turbulent flow without the wave effect are also plotted (– – –).

The intensity of vertical velocity fluctuations is an important measure of the strength of Langmuir turbulence in the ocean surface boundary layer. Compared to the shear-driven turbulence, the vertical velocity fluctuations are significantly enhanced when waves are present, as predicted by previous simulation-based studies on Langmuir turbulence (McWilliams et al. Reference McWilliams, Sullivan and Moeng1997; Sullivan et al. Reference Sullivan, McWilliams and Melville2007). Based on large-eddy simulation data, Harcourt & D'Asaro (Reference Harcourt and D'Asaro2008) proposed a parametrisation for the bulk mean vertical kinetic energy, i.e. the vertically averaged  $\overline {w'^2}$ in the boundary layer, as
 \begin{equation} \mathcal{W}/u_*^2 = 0.398 + 0.48 {La}_{SL}^{-4/3},\quad {La}_{SL} \leq 1.\end{equation}
Here,  $\mathcal {W}$ denotes the bulk mean vertical kinetic energy and
 ${La}_{SL}$ is a surface layer turbulent Langmuir number defined as
 \begin{equation} {La}_{SL} = \sqrt{u_*/(\langle u_s \rangle_{SL} - u^{ref}_s)}, \end{equation}
where  $\langle u_s \rangle _{SL}$ is the mean Stokes drift between
 $z=-H/5$ and
 $z=0$ and
 $u^{ref}_s$ is the Stokes drift at
 $z=-0.765H$. The above parametrisation has been found consistent with field measurements in the open ocean (D'Asaro et al. Reference D'Asaro, Thomson, Shcherbina, Harcourt, Cronin, Hemer and Fox-Kemper2014). The Stokes drift profile in our present set-up yields
 ${La}_{SL} = 0.48$. The bulk mean vertical kinetic energy is
 $\mathcal {W}/ u_*^2 = 1.78$, which aligns with the prediction using (C1),
 $\mathcal {W}/u_*^2=1.67$. This result indicates that the present method can accurately simulate the wave effect on the ocean surface boundary layer.
To further validate the accuracy of the present method regarding the wave-phase effect on turbulence, we compare the wave-phase variation in the mean Reynolds normal stresses  $\langle {u'^2_i}\rangle$ at a fixed depth
 $kz=-0.1$ between the two methods. As shown in figure 20, the two methods are in agreement. Figure 20(a) also plots the streamwise velocity fluctuations measured under a wind-shear surface wave at
 $kz=-0.1$ by Jiang & Street (Reference Jiang and Street1991). Both numerical and experimental data indicate that the streamwise Reynolds normal stress
 $\langle {u'^2_i} \rangle$ reaches maximum under the wave trough and minimum under the wave crest. The observed variation at a fixed depth is mostly due to the changing distance from the wave surface (Thais & Magnaudet Reference Thais and Magnaudet1996; Xuan et al. Reference Xuan, Deng and Shen2020). In other words,
 $\langle u'^2 \rangle$ increases under the wave trough because the distance from a fixed depth to the surface is reduced and
 $\langle u'^2 \rangle$ is stronger near the wave surface. The experimental measurement exhibits a slightly larger phase variation in
 $\langle u'^2 \rangle$, which could be due to the imperfect match between the conditions of the experiments performed in a wind-wave tank and our simulation set-up. Nevertheless, the fact that the present method can capture the effect associated with the varying distance to a wave surface and the agreement between the two numerical methods indicates that the boundary treatment based on Taylor expansion employed by the proposed simulation method can resolve the dominant effect of the wave boundary.
Comparison of the normalised variation of the Reynolds normal stresses, (a)  $\langle u'^2\rangle /\overline {u'^2}$, (b)
 $\langle v'^2 \rangle /\overline {v'^2}$ and (c)
 $\langle w'^2 \rangle /\overline {w'^2}$, at a fixed depth
 $kz=-0.1$ along the
 $x$ direction for the present method (——–) and the wave-boundary-fitted-grid method (
 $\bullet$). The mean values of the three components of the Reynolds normal stresses along the
 $x$ direction are denoted by
 $\overline {u'^2}$,
 $\overline {v'^2}$ and
 $\overline {w'^2}$, respectively. In (a), the measurements of the streamwise velocity fluctuations from the experiment by Jiang & Street (Reference Jiang and Street1991) (
 $\blacktriangle$, case with
 $U_{air}=2.5\ \text {m}\ \text {s}^{-1}$) are also plotted.

Appendix D. Evolution equations of the velocity energy spectra
The evolution equations for the turbulence velocity spectra are derived based on the two-point correlation of the turbulence velocity fluctuations, essentially following Lee & Moser (Reference Lee and Moser2019). By subtracting the mean velocity from (2.5) and invoking the definitions of mean and fluctuating quantities given in § 3, we obtain the governing equations for the turbulence fluctuating velocity  $u'_i$, given by
 \begin{align} \frac{\partial u'_i}{\partial t} + [{(u_\phi)}_k + \langle u_k \rangle ] \frac{\partial u'_i}{\partial x_k} &=- u'_k \frac{\partial [{(u_\phi)}_i + \langle u_i \rangle ]}{\partial x_k} + \frac{\partial \langle u'_k u'_i \rangle}{\partial x_k} - \frac{\partial u'_k u'_i}{\partial x_k} -\frac{1}{\rho}\frac{\partial p'}{\partial x_i} \nonumber\\ &\quad + \nu \frac{\partial^2 u'_i}{\partial x_k \partial x_k} - \frac{\partial \tau'^{SGS}_{ik}}{\partial x_k}. \end{align}
Because the imposed wave packet is two-dimensional, the ensemble average of the wave velocity, as defined by (3.1), satisfies  $\langle \boldsymbol {u}_\phi \rangle = u_\phi$, i.e. both the wave motion
 $\boldsymbol {u}_\phi$ and the mean rotational velocity
 $\langle \boldsymbol {u}\rangle$ act as the mean velocity for the turbulence fluctuating velocity.
Denoting the velocity separated by a distance of  $r_y$ in the spanwise direction as
 $u'_i$ and
 $\mathring {u}'_i$, the two-point correlation
 $R_i=\langle u'_i \mathring {u}'_i\rangle$ is governed by the following evolution equation:
 \begin{align} \frac{\partial R_i}{\partial t} &= \left\langle u'_i \frac{\partial \mathring{u}'_i}{\partial t} + \mathring{u}'_i \frac{\partial u'_i}{\partial t} \right\rangle \nonumber\\ &= \underbrace{- \langle\mathring{u}'_i u'_k \rangle \frac{\partial [{(u_\phi)}_i + \langle u_i \rangle ]}{\partial x_k}- \langle{u}'_i \mathring{u}'_k \rangle \frac{\partial [{(u_\phi)}_i + \langle u_i \rangle ]}{\partial \mathring{x}_k} }_{R^P_i} \nonumber\\ &\quad \underbrace{-\left\langle \mathring{u}'_i \frac{\partial u'_i u'_k }{\partial x_k} + u'_i\frac{\partial \mathring{u}'_i \mathring{u}'_k}{\partial \mathring{x}_k} \right\rangle}_{R^T_i} \nonumber\\ & \quad \underbrace{- \frac{1}{\rho} \left\langle \mathring{u}'_i \frac{\partial p'}{\partial x_i} + {u}'_i \frac{\partial \mathring{p}'}{\partial \mathring{x}_i} \right\rangle}_{R^\varPi_i} \nonumber\\ & \quad \underbrace{+ \nu \left\langle \mathring{u}'_i \frac{\partial^2 u'_i}{\partial x_k \partial x_k} + u'_i \frac{\partial^2 \mathring{u}'_i}{\partial \mathring{x}_k \partial \mathring{x}_k} \right\rangle}_{R^\nu_i} \nonumber\\ & \quad \underbrace{- \left\langle \mathring{u}'_i \frac{\partial \tau'^{SGS}_{ik}}{\partial x_k} + u'_i \frac{\partial \mathring{\tau}'^{SGS}_{ik}}{\partial \mathring{x}_k} \right\rangle}_{R^\tau_i} \nonumber\\ & \quad \underbrace{-[{(u_\phi)}_k + \langle u_k \rangle ] \left\langle\frac{\partial u'_i}{\partial x_k} \mathring{u}'_i + \frac{\partial \mathring{u}'_i}{\partial \mathring{x}_k} {u}'_i\right \rangle}_{R^A_i}, \end{align}
where  $R^P_i$,
 $R^T_i$,
 $R^\varPi _i$,
 $R^\nu _i$,
 $R^\tau _i$ and
 $R^A_i$ represent the contributions to the evolution of
 $R_i$ due to the production, turbulence diffusion, pressure fluctuations, viscous effect, subgrid-scale effect and mean-flow advection, respectively. Note that the Einstein summation convention is not applied to the subscript
 $i$ in the above equation. The production effect can be further decomposed into contributions from wave straining and mean rotational straining, i.e.
 \begin{equation} R^P_i = \underbrace{- \langle\mathring{u}'_i u'_k \rangle \frac{\partial {(u_\phi)}_i}{\partial x_k}- \langle{u}'_i \mathring{u}'_k \rangle \frac{\partial {(u_\phi)}_i}{\partial \mathring{x}_k} }_{R^{P^w}_i} \underbrace{- \langle\mathring{u}'_i u'_k \rangle \frac{\partial \langle u_i \rangle}{\partial x_k}- \langle{u}'_i \mathring{u}'_k \rangle \frac{\partial \langle u_i \rangle}{\partial \mathring{x}_k} }_{R^{P^r}_i}. \end{equation}
The pressure-related term can be decomposed as
 \begin{equation} - \frac{1}{\rho} \left\langle \mathring{u}'_i \frac{\partial p'}{\partial x_i} + {u}'_i \frac{\partial \mathring{p}'}{\partial \mathring{x}_i} \right\rangle = \underbrace{- \frac{1}{\rho} \left\langle \frac{\partial \mathring{u}'_i p'}{\partial x_i} + \frac{\partial u'_i \mathring{p}'}{\partial \mathring{x}_i} \right\rangle}_{R^{T^p}_i} \underbrace{+ \frac{1}{\rho} \left\langle \,p' \frac{\partial \mathring{u}'_i}{\partial x_i} + \mathring{p}' \frac{\partial u'_i}{\partial \mathring{x}_i} \right\rangle}_{R^{\varPi^s}_i}.\end{equation}
The first term on the right-hand side,  $R^{T^p}_i$, represents the pressure diffusion effect for the two-point correlation
 $R_i$. The transport effect is non-zero only in the streamwise
 $x$ and vertical
 $z$ directions. The second term on the right-hand side,
 $R^{\varPi ^s}_i$, is related to the energy exchange among velocity components. It reduces to the pressure–strain correlation when
 $r_z\to 0$.
We further take the packet-following average of (D2) and obtain the equation for the packet-scale mean two-point correlation  $\hat {R}_i$:
 \begin{equation} \frac{\partial \hat{R}_i}{\partial t} - c_g \frac{\partial \hat{R}_i}{\partial x} = \widehat{R^{P^w}_i} + \widehat{R^{P^r}_i} + \widehat{R^{\varPi^s}_i} + \widehat{R^{T^p}_i} + \widehat{R^{T}_i} + \widehat{R^\nu_i} + \widehat{R^\tau_i} + \widehat{R^A_i}.\end{equation}
The term  $- c_g {\partial \hat {R}_i}/{\partial x}$ accounts for the frame translating with the wave packet. The spectral budget equations can then be obtained by taking the Fourier transform of each term in (D5) with respect to
 $r_y$ to give
 \begin{equation} \frac{\partial \hat{\varPhi}_i}{\partial t} - c_g \frac{\partial \hat{\varPhi}_i}{\partial x} = P^w_{i} + P^r_{i} + {\varPi^s}_{i} + T^p_{i} + T^t_{i} + A_i + \mathcal{V}_{i}. \end{equation}
Here, we group the viscous and subgrid-scale effects into  $\mathcal {V}_i$ for conciseness, i.e.
 $\mathcal {V}_i$ is the Fourier transform of
 $\widehat {R^\nu _i}$ and
 $\widehat {R^\tau _i}$. We remark that the spectral budget equations can be alternatively obtained by taking the Fourier transform of the governing equations for
 $\boldsymbol {u'}$, (D1), and then multiplying the resulting equations by their complex conjugates (see e.g. Bolotnov et al. Reference Bolotnov, Lahey, Drew, Jansen and Oberai2010).


 Open access

